
June 30, 2026
Understanding Critical Maritime Vulnerabilities in Global Energy Infrastructure
The global energy system operates on razor-thin margins of security, where single geographical bottlenecks can trigger cascading economic disruptions across continents. Among these critical points, maritime chokepoints represent perhaps the most underappreciated systemic risk in modern energy markets. The Strait of Hormuz closure impact would instantly reshape international trade flows worth trillions of dollars, unlike pipeline disruptions or refinery outages that affect regional supply chains.
Current market dynamics reveal how quickly energy security concerns translate into price volatility. Recent geopolitical tensions have already demonstrated this vulnerability, with Brent crude surging 10% to approximately $80 per barrel following regional conflicts, marking the highest levels since July of the previous year. Furthermore, this price movement occurred even before any actual supply disruptions, highlighting how market psychology amplifies physical risks.
The interconnected nature of global energy flows means that disruptions in key maritime passages create ripple effects far beyond immediate price spikes. Financial markets, currency valuations, and entire economic sectors can experience dramatic shifts based on perceived threats to energy transportation routes. Understanding these systemic vulnerabilities requires examining both the physical constraints of critical waterways and the economic mechanisms that translate geographical risks into market outcomes.
When big ASX news breaks, our subscribers know first
Geographic Constraints and Strategic Importance of Maritime Energy Routes
The world's most critical energy chokepoint operates within severe physical limitations that amplify its strategic importance. At its narrowest point, this waterway spans just 21 miles, with commercial shipping confined to 2-mile-wide shipping lanes. These geographical constraints force massive oil tankers through a confined space that can be easily monitored, controlled, or potentially blocked.
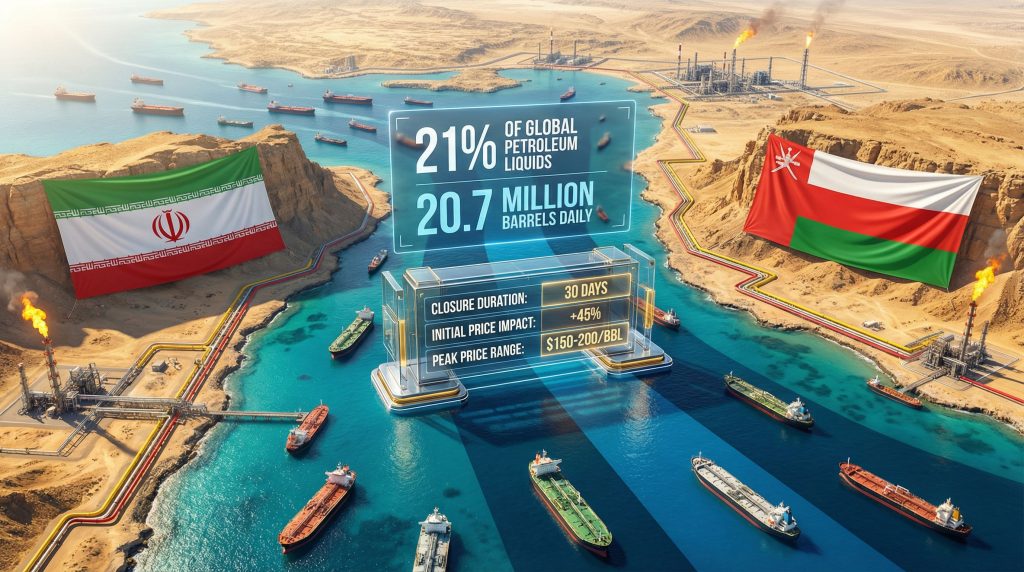
Transportation volume through this corridor represents a staggering portion of global energy trade. More than 20% of global oil passes through this single waterway, making it an irreplaceable component of international energy supply chains. This figure translates to approximately 20.7 million barrels daily, representing a flow of petroleum that cannot be quickly redirected through alternative routes.
Regional dependency on this transit route creates additional vulnerabilities. An estimated 85% of crude exports from major Middle Eastern producers including Saudi Arabia, UAE, Kuwait, Iraq, and Iran rely on passage through this waterway. Consequently, any disruption immediately affects multiple national economies simultaneously, creating compounding effects across global energy markets.
Alternative Infrastructure Limitations
Current bypass infrastructure reveals the inadequacy of alternative routes during a crisis. Existing pipeline capacity totals approximately 6.5 million barrels per day, with only 3.5 million barrels per day of unused capacity available for emergency redirection. Even with maximum utilisation of alternative routes, including Saudi Arabia's East-West pipeline and Abu Dhabi's pipeline, energy economists estimate that a complete closure would result in a net loss of 8-10 million barrels per day of crude oil supply.
Insurance markets have quantified the financial exposure of this vulnerability. Lloyd's estimates place the annual cargo value at risk at approximately $2.8 trillion, representing not just energy commodities but also manufactured goods, raw materials, and other trade flows that utilise this critical passage.
Emergency preparedness measures provide some buffer against short-term disruptions. International Energy Agency (IEA) member countries maintain 90-day emergency stock reserves, while commercial inventories typically hold 30-day supplies. However, these reserves are designed for temporary disruptions rather than extended closures of major shipping routes.
Immediate Market Response Mechanisms and Price Trajectories
Energy markets demonstrate extreme sensitivity to disruption scenarios, with price movements occurring before actual supply shortages materialise. Recent market behaviour illustrates this dynamic, where futures prices jumped 10% based solely on conflict escalation rather than confirmed supply interruptions, demonstrating clear oil price rally analysis.
Analyst predictions for various closure scenarios paint an increasingly severe picture as disruption duration extends:
| Closure Duration | Initial Price Impact | Peak Price Range | Market Recovery Time |
|---|---|---|---|
| 1-7 days | $76-$84/barrel | $90-$110 | 2-4 weeks |
| 2-4 weeks | $110-$140/barrel | $150-$180 | 2-3 months |
| 1-3 months | $150-$200/barrel | $250+ | 6-12 months |
The OPEC+ response mechanism provides limited short-term relief during crisis periods. Recent agreements to increase output by 206,000 barrels per day represent less than 0.2% of global demand, highlighting how even coordinated producer responses cannot immediately offset major supply route disruptions. For instance, OPEC production impact remains insufficient during complete blockade scenarios.
Cascading Financial Market Effects
Energy price spikes trigger systematic responses across financial markets that extend far beyond commodity trading. Equity markets typically experience 10-15% immediate declines, expanding to 25-35% losses during sustained disruptions as investors reassess corporate earnings prospects across energy-intensive sectors.
Currency markets reflect the uneven impact of energy disruptions on national economies. Oil-importing currencies typically depreciate 8-12% against the US dollar within 30 days of major supply disruptions, while currencies of energy-exporting nations often strengthen despite overall market volatility.
Bond markets experience flight-to-quality dynamics during energy crises. 10-year Treasury yields historically drop 75-125 basis points as investors seek safe-haven assets, while corporate bond spreads widen significantly for companies with high energy exposure or supply chain vulnerabilities.
Sectoral Impact Analysis and Economic Vulnerability Assessment
Different economic sectors demonstrate varying degrees of vulnerability to energy supply disruptions, creating distinct winners and losers during crisis periods. Understanding these dynamics helps investors and policymakers anticipate secondary economic effects beyond immediate energy price increases, particularly considering US oil production decline trends that compound regional vulnerabilities.
Energy Sector Beneficiaries
North American shale producers represent the most immediate beneficiaries of sustained high oil prices. With break-even costs typically ranging from $45-65 per barrel, these operators experience dramatic margin expansion when prices reach $150+ levels during supply crises.
Alternative exporters including Norway, Brazil, and Canada can capture 15-25% market share premiums during Middle Eastern supply disruptions as buyers seek stable alternative sources. These premium pricing opportunities can persist for months after initial supply routes reopen.
Renewable energy adoption experiences significant acceleration during extended high oil price periods. Typical 10-year adoption timelines compress to 5-year horizons as businesses and governments prioritise energy security through diversification away from fossil fuel dependency.
Most Vulnerable Industries
Airlines face existential threats during prolonged energy crises, with jet fuel costs representing 25-30% of operating expenses. Highly leveraged carriers face bankruptcy risk when fuel costs double or triple for extended periods.
Petrochemical manufacturers experience severe margin compression as feedstock costs can triple during supply disruptions, forcing production cuts of 30-50% to maintain profitability.
Shipping companies encounter dramatic cost increases as bunker fuel surcharges increase freight rates by 40-60%, potentially disrupting global trade flows and supply chain relationships.
Regional Economic Impact Modelling
Economic modelling reveals significant variations in national vulnerability to energy supply disruptions:
| Region | GDP Impact (3-month closure) | Inflation Increase | Recession Probability |
|---|---|---|---|
| European Union | -2.1% to -3.4% | +3.2 to +4.8% | 85% |
| Japan | -2.8% to -4.1% | +4.1 to +5.9% | 92% |
| India | -3.2% to -4.7% | +5.3 to +7.2% | 88% |
| United States | -1.4% to -2.2% | +2.1 to +3.3% | 68% |
These projections reflect each region's energy import dependency, economic diversification, and strategic reserve capabilities. Asian economies show particular vulnerability due to their heavy reliance on Middle Eastern energy imports and limited alternative supply sources.
Strategic Response Frameworks and International Coordination
Governments and international organisations maintain various mechanisms for responding to major energy supply disruptions, though their effectiveness depends heavily on disruption scale and duration. Moreover, trade war oil movements complicate traditional response mechanisms during periods of heightened international tension.
Emergency Supply Coordination
The International Energy Agency Strategic Reserve Release system provides the primary coordinated response mechanism. With 1.5 billion barrels available globally, these reserves can deliver a maximum release rate of 4.1 million barrels per day. However, this capacity represents only partial replacement for major chokepoint closures.
OPEC+ Emergency Production capabilities offer additional supply flexibility. Saudi Arabia maintains approximately 2 million barrels per day spare capacity, while the UAE can add 0.3 million barrels per day. However, these increases cannot fully offset the 8-10 million barrel daily shortfall that would result from complete strait closure.
Alternative routing infrastructure includes the East-West pipeline (5 million barrels per day capacity) and Abu Dhabi pipeline (1.5 million barrels per day). While significant, these alternatives cannot handle the full volume of displaced shipping traffic.
Diplomatic and Military Escalation Scenarios
International Maritime Coalition formation typically requires 2-4 weeks to assemble naval assets from multiple countries. Historical precedent suggests a 70-80% probability of reopening major shipping routes within 30 days through coordinated military pressure, though at substantial economic costs of $150-200 billion in deployment expenses and insurance claims.
Experts warn that potential scenarios for oil if the strait closes could reshape global markets permanently. Negotiated Settlement approaches historically achieve median resolution times of 45-60 days but often require significant political concessions. Recent examples suggest sanctions relief worth $50-80 billion annually may be necessary to secure cooperation from regional powers controlling critical waterways.
Market confidence recovery typically lags behind physical reopening of shipping routes. Risk premiums can persist for 6-12 months after resolution as traders and shippers adjust to perceived ongoing vulnerabilities.
Long-term Energy Security Evolution and Infrastructure Development
Extended energy supply disruptions accelerate fundamental changes in global energy infrastructure and security strategies that persist long after immediate crises resolve. The Strait of Hormuz closure impact fundamentally alters investment priorities and strategic planning across multiple sectors, often causing oil price stagnation factors to emerge in the recovery phase.
Infrastructure Diversification Investments
Pipeline expansion projects receive accelerated funding during energy crises, with $40-60 billion investments typically authorised to increase bypass capacity from current levels to 15 million barrels per day. These projects can take 3-5 years to complete but provide permanent risk mitigation.
LNG terminal construction experiences rapid acceleration through floating regasification units that can be deployed within months rather than years required for fixed facilities. This flexibility allows importing nations to quickly diversify supply sources.
Strategic reserve expansion becomes a political priority, with targets moving from current 90-day coverage to 180-day emergency reserves. This expansion requires substantial investment but provides crucial buffer capacity for future disruptions.
Technology Acceleration Timeline
Electric vehicle adoption can accelerate dramatically during sustained high oil prices. Fleet turnover rates increase by 5 years as businesses and consumers seek alternatives to petroleum-dependent transportation.
Renewable energy investment receives $2-3 trillion in additional funding through 2035 as governments prioritise energy independence. This acceleration can permanently alter global energy supply dynamics.
Hydrogen economy development advances significantly when traditional energy supply chains face disruption. Commercial viability timelines advance by 3-5 years as hydrogen becomes economically competitive with petroleum products at elevated price levels.
Supply Chain Restructuring
Nearshoring manufacturing gains momentum as companies prioritise supply chain resilience over cost optimisation. Energy-intensive industries particularly focus on reducing transport vulnerabilities by relocating production closer to end markets.
Regional energy hubs develop in previously underutilised areas including Arctic, African, and Latin American regions as importers diversify supply sources away from traditional chokepoint-dependent routes.
Smart grid integration expands rapidly to provide demand response capabilities that help manage price volatility and supply disruptions through more flexible electricity consumption patterns.
The next major ASX story will hit our subscribers first
Investment Risk Management and Portfolio Strategy Development
Sophisticated investors and institutions require comprehensive frameworks for managing energy security risks that can dramatically impact portfolio performance during crisis periods. Furthermore, understanding how geopolitical tensions threaten global oil markets enables better strategic positioning.
Portfolio Hedging Strategies
Energy futures positioning becomes critical during geopolitical tension periods. Long positions in crude oil, natural gas, and refined products provide direct exposure to price increases while hedging against broader portfolio losses.
Currency hedging strategies focus on short positions in oil-importing nation currencies while maintaining exposure to energy-exporter currencies that benefit from sustained high prices.
Sector rotation approaches emphasise overweighting energy, defence, and renewable technology stocks while underweighting airlines, chemicals, and transport-dependent industries during heightened risk periods.
Corporate Risk Assessment Framework
Companies require systematic evaluation of energy supply disruption exposure across multiple dimensions:
| Risk Factor | High Exposure | Medium Exposure | Low Exposure |
|---|---|---|---|
| Energy Cost Intensity | >15% of total costs | 8-15% of costs | <8% of costs |
| Geographic Concentration | >50% emerging market operations | 25-50% EM exposure | <25% EM exposure |
| Supply Chain Complexity | >5 international supply links | 3-5 international links | <3 international links |
This assessment framework enables companies to quantify their vulnerability and prioritise risk mitigation investments accordingly.
Insurance and Financial Instruments
Political risk insurance premiums increase 200-400% during crisis periods as insurers reassess country and regional risks. Companies with significant emerging market exposure often find coverage unavailable at any price.
Business interruption coverage becomes critically important as force majeure clauses activate for energy-dependent operations during supply disruptions. Standard policies may not cover extended disruptions lasting months.
Catastrophe bonds specifically designed around energy security risks provide portfolio diversification opportunities for institutional investors willing to accept correlation with geopolitical events.
Understanding these complex interdependencies between energy security, financial markets, and economic stability enables better preparation for future disruptions. The combination of physical infrastructure vulnerabilities, market psychology, and systematic economic responses creates scenarios where relatively localised events can trigger global economic consequences lasting far beyond the initial disruption period. In addition, the Strait of Hormuz closure impact would fundamentally reshape energy security planning for decades, regardless of the closure's actual duration.
This analysis is based on historical data, current market conditions, and expert projections. Energy markets remain highly volatile and unpredictable, particularly during geopolitical crises. Investors should consult financial advisers and conduct independent research before making investment decisions based on energy security scenarios.
Are You Positioned for Energy Market Volatility Ahead of Geopolitical Risks?
With maritime chokepoints threatening global energy security, savvy investors are turning to commodity-focused opportunities for portfolio protection. Discovery Alert's proprietary Discovery IQ model delivers real-time alerts on significant ASX mineral discoveries, instantly empowering subscribers to identify actionable opportunities in the energy and resources sectors ahead of the broader market. Begin your 14-day free trial today to secure your market-leading advantage during these uncertain times.