
June 19, 2026
Understanding Market Corrections: Where Australian Equities Stand Today
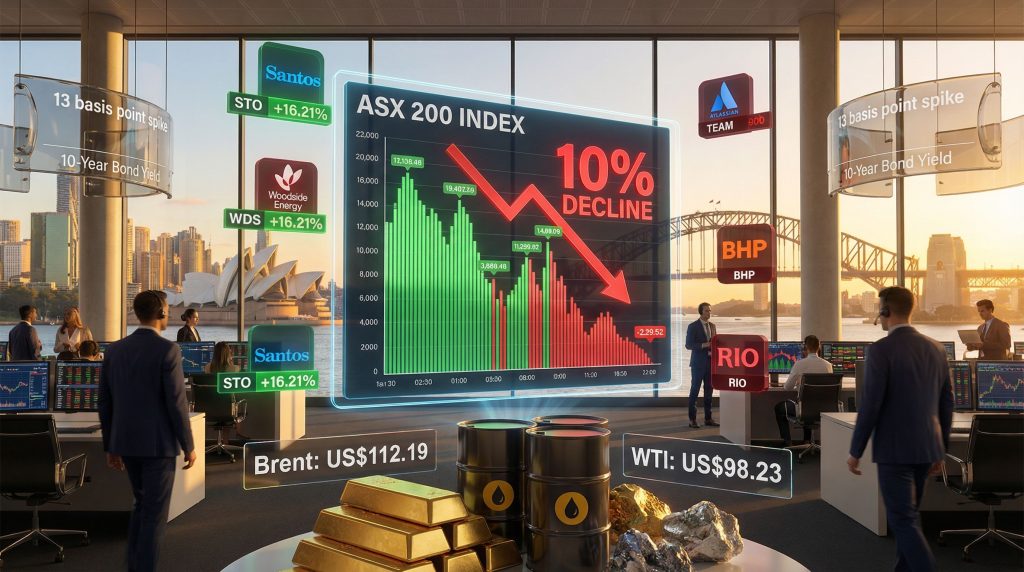
Market volatility remains an inherent characteristic of global financial systems, with periodic corrections serving as natural reset mechanisms for overextended valuations. The Australian Securities Exchange has recently entered what technical analysts classify as correction territory, representing a fundamental shift in market dynamics that extends beyond temporary price fluctuations. This ASX 200 correction demonstrates several hallmarks of systematic repricing rather than isolated sector weakness.
A market correction occurs when major indices decline between 10% and 20% from recent peaks, distinguishing these events from minor pullbacks under 10% or bear markets exceeding 20% losses. This classification system provides investors with context for understanding the severity and potential duration of market downturns.
Technical Characteristics of Current Market Conditions
The current market environment demonstrates several hallmarks of systematic repricing rather than isolated sector weakness. From its March 2, 2026 peak, the index has declined 10%, placing it precisely at the correction threshold. This timing coincides with a three-week period of sustained selling pressure, indicating institutional rather than retail-driven liquidation patterns.
Furthermore, the tariffs impact on markets has created additional uncertainty among investors. The breadth of the current correction suggests systematic rather than sector-specific concerns affecting global financial systems.
Key Correction Metrics:
• Peak-to-trough decline: 10% (correction boundary)
• Duration: Approximately 21 trading days
• Sector breadth: 8 of 11 major sectors affected
• Trading volume: Elevated above 20-day averages
Current Market Position Analysis
The breadth of the current correction suggests systematic rather than sector-specific concerns. When corrections affect over 70% of major sectors, as evidenced by the 8-of-11 sector participation rate, market participants typically respond to macro-economic factors rather than company-specific fundamentals.
This broad-based selling creates opportunities for contrarian investors while simultaneously indicating that defensive positioning becomes crucial for capital preservation. Historical analysis reveals that corrections beginning with such broad sector participation tend to persist for 60-90 trading days before establishing sustainable recovery patterns.
When big ASX news breaks, our subscribers know first
Bond Market Dynamics Driving Equity Repricing
Interest rate movements often serve as the primary transmission mechanism for converting geopolitical events into systematic market corrections. The recent 13 basis point single-session rise in 10-year Australian Treasury yields represents a magnitude of movement typically associated with major policy announcements or fundamental economic reassessment.
Discount Rate Impact on Equity Valuations
Rising bond yields create immediate pressure on equity valuations through the discount rate mechanism. When Treasury yields increase, the present value of future corporate earnings decreases proportionally, with growth stocks experiencing magnified impacts due to their longer-duration cash flow profiles.
The current environment presents particular challenges given consensus earnings expectations of 18% global growth for 2026. However, persistent inflation and debt pressures continue to weigh on long-term economic projections.
Valuation Compression Formula:
Intrinsic Value = Expected Earnings ÷ (Discount Rate + Risk Premium)
Inflation Risk Premium Reassessment
The magnitude and speed of the Treasury yield movement suggests market participants have shifted from viewing current events as temporary disruptions to recognising persistent inflation risks. This repricing occurs through several channels:
• Real yield increases affecting all equity valuations
• Sector rotation toward inflation-hedging assets
• Multiple compression across growth-oriented stocks
• Risk premium expansion reflecting uncertainty
The simultaneous rise in bond yields and decline in equity markets indicates investors are pricing both inflation risk and growth concerns, creating challenging conditions for traditional portfolio diversification strategies.
Australia's position among global central banks creates additional complexity, as domestic monetary policy must balance international inflation pressures with local economic conditions. This dynamic amplifies the impact of global events on Australian bond and equity markets.
Sector Performance Divergence During Market Stress
Market corrections often reveal underlying sector dynamics that remain obscured during broad market advances. The current market environment demonstrates significant performance divergence, with energy shares gaining 16.21% while the broader index declined 8.37%, creating a 24.58 percentage point performance spread.
Energy Sector Resilience Amid Market Turmoil
Energy companies benefit from a unique dynamic during inflationary corrections: rising input costs that pressure other sectors actually enhance energy company profitability through higher commodity prices. Brent crude reaching US$112.19 and WTI at US$98.23 demonstrates this relationship, with oil price appreciation directly translating to improved margins for energy producers.
Additionally, the gold price forecast suggests continued strength in commodity markets amid global uncertainty.
Energy Sector Performance Drivers:
• Direct commodity price exposure benefiting from supply constraints
• Inflation hedging characteristics protecting against currency debasement
• Strategic asset positioning in globally essential commodities
• Cash flow generation supporting dividend sustainability
Santos and Woodside exemplify this dynamic, with their operational leverage to crude pricing enabling positive returns despite broader market weakness. These companies possess integrated production assets with global pricing linkages, allowing them to capture value from geopolitical supply disruptions.
Materials and Mining Under Dual Pressure
Mining and materials companies face contrasting pressures during the current correction. While commodity prices provide some support, rising energy costs increase operational expenses, particularly for energy-intensive mining operations. Additionally, concerns about Chinese economic growth create demand uncertainty for industrial metals.
Dual Pressure Analysis:
| Positive Factors | Negative Factors |
|---|---|
| Commodity price support | Rising energy costs |
| Supply constraint benefits | China demand concerns |
| Currency hedging gains | Higher transportation costs |
| Strategic mineral positioning | Capital allocation uncertainty |
Technology and Growth Stock Vulnerability
High-multiple technology stocks demonstrate particular sensitivity to rising discount rates, as their valuations depend heavily on distant future cash flows. The combination of elevated growth expectations and increased discount rates creates substantial valuation pressure for this sector.
Small-cap technology companies experience amplified impacts compared to large-cap defensive stocks, as their higher growth assumptions and longer cash flow duration profiles magnify the effects of discount rate changes. This creates opportunities for value-oriented investors while challenging growth-focused strategies.
Geopolitical Risk Transmission to Financial Markets
The evolution from isolated geopolitical events to systematic market corrections follows predictable patterns that investors can recognise and potentially anticipate. Current events demonstrate how regional conflicts transform into global financial market concerns through economic linkages and supply chain dependencies.
From Regional Conflict to Global Market Impact
The transmission mechanism operates through multiple channels simultaneously. China's position as a major oil customer of Iran creates direct economic linkages between Middle Eastern geopolitical stability and Asian economic growth. In addition, the US‑China trade war impact continues to influence global markets.
This relationship affects Australian markets through China's role as Australia's largest trading partner, representing approximately 25-30% of export revenue across resources, agriculture, and manufactured goods.
Risk Transmission Pathway:
- Geopolitical tensions emerge in strategic regions
- Supply disruption concerns affect commodity markets
- Price increases create inflation pressures
- Economic growth expectations decline in affected regions
- Financial market repricing occurs globally
Historical Oil Shock Patterns and Market Outcomes
Analysis of previous oil shocks provides context for understanding potential correction severity and duration. Historical data reveals that four of the last five oil shocks have coincided with economic recessions, though causation versus correlation remains debated among economists.
Historical Oil Shock Comparison:
| Period | Oil Price Increase | Recession Outcome | ASX Impact |
|---|---|---|---|
| 1973 Crisis | 300% increase | Yes | -25% decline |
| 1979-80 Crisis | 150% increase | Yes | -18% decline |
| 1990 Gulf War | 100% increase | Yes | -12% decline |
| 2008 Financial Crisis | 40% increase | Yes | -54% decline* |
| Current Situation | 35% increase | Unknown | -10% (ongoing) |
*2008 decline amplified by financial system stress
The current 35% oil price increase appears moderate compared to historical precedents, suggesting the correction may remain within typical bounds unless additional factors emerge. However, the speed of repricing and breadth of market impact indicate systematic rather than isolated concerns.
Infrastructure Damage and Supply Persistence
Unlike demand-driven economic slowdowns where commodity prices might decline with reduced consumption, supply-side disruptions from infrastructure damage create persistent price pressures. Damaged production or transportation infrastructure requires time to rebuild, extending the duration of supply constraints regardless of demand conditions.
This distinction becomes crucial for investors, as supply-driven inflation typically persists longer than demand-driven inflation, affecting discount rates and equity valuations for extended periods.
Strategic Investment Approaches During Market Corrections
Market corrections create simultaneous challenges and opportunities for investors, requiring strategic approaches that balance capital preservation with opportunistic positioning. Historical analysis reveals specific strategies that tend to perform well during correction phases while positioning portfolios for eventual recovery.
Cash Position and Liquidity Management
Maintaining cash reserves during corrections provides flexibility for opportunistic investments while protecting against further declines. Optimal cash allocation typically ranges between 15-25% during correction phases, balancing opportunity cost against downside protection.
Cash Position Benefits:
• Downside protection during continued market stress
• Opportunity capture when attractive valuations emerge
• Psychological comfort reducing emotional decision-making
• Flexibility maintenance for strategic rebalancing
The opportunity cost of holding cash becomes less significant during corrections, as the risk-adjusted returns from cash positions improve when equity markets experience elevated volatility and uncertain outcomes.
Sector Rotation Strategy Implementation
Corrections often accelerate sector rotation patterns that develop over longer time horizons. Energy sector outperformance during the current correction exemplifies this dynamic, with inflation-hedging characteristics becoming more valuable as traditional growth sectors struggle.
Defensive Sector Characteristics:
• Stable cash flows less sensitive to economic cycles
• Dividend sustainability providing income during volatility
• Lower duration reducing sensitivity to interest rate changes
• Essential services maintaining demand stability
Utilities, consumer staples, and telecommunications typically demonstrate these characteristics, though their effectiveness depends on the specific nature of each correction's driving factors.
Dollar-Cost Averaging Implementation
Systematic investment approaches become particularly valuable during corrections, as emotional decision-making often leads to poor timing. Dollar-cost averaging allows investors to benefit from volatility while removing the pressure of perfect timing.
DCA Implementation Framework:
- Identify quality companies with strong fundamentals
- Establish investment schedule (weekly or monthly)
- Maintain discipline regardless of short-term movements
- Focus on businesses rather than stock prices
- Increase allocations during extreme weakness
Quality metrics for ASX 200 stock selection include consistent earnings growth, strong balance sheets, competitive advantages, and experienced management teams with track records through multiple market cycles.
Correction Duration and Recovery Patterns
Understanding typical correction timeframes helps investors maintain perspective during market stress while preparing for eventual recovery phases. Historical analysis of market corrections reveals consistent patterns in both duration and recovery characteristics.
Average Correction Timeframes
Australian market corrections typically persist for 60-90 trading days from peak to trough, with recovery to new highs occurring within 6-12 months under normal economic conditions. However, corrections coinciding with economic recessions can extend significantly longer.
Correction Phase Analysis:
• Initial decline: 2-3 weeks of broad selling pressure
• Stabilisation period: 4-6 weeks of sideways movement
• Recovery initiation: 2-4 weeks of tentative buying
• Sustained recovery: 8-16 weeks to new highs
The current correction, at approximately three weeks duration, appears to be in the initial decline phase, suggesting additional volatility may persist before stabilisation occurs.
Recovery Pattern Recognition
Market recoveries from corrections typically follow recognisable patterns, beginning with tentative buying in oversold conditions before establishing sustainable uptrends. Initial bounces of 20-30% from correction lows are common but often followed by retesting of low levels before sustainable recoveries commence.
ASX 200 recoveries historically show strongest performance in the first 90 days following correction lows, with quality dividend-paying stocks often leading initial recovery phases.
According to research from Monash University, timing market corrections requires careful analysis of fundamental indicators.
Recovery Indicators:
• Volume expansion during price advances
• Sector leadership rotation toward quality names
• Technical support holding at key levels
• Economic data stabilisation or improvement
Factors Accelerating or Extending Corrections
Several factors influence whether corrections resolve quickly or extend into more serious market downturns. Current conditions suggest moderate rather than severe correction risk, though monitoring key indicators remains essential.
Extension Risk Factors:
• Economic recession development
• Financial system stress emergence
• Policy response inadequacy
• Geopolitical escalation beyond current levels
Acceleration Factors:
• Central bank intervention supporting liquidity
• Geopolitical resolution reducing uncertainty
• Economic data exceeding expectations
• Corporate earnings resilience demonstration
The next major ASX story will hit our subscribers first
Warning Signs of Correction Deepening
Investors benefit from monitoring specific indicators that signal whether corrections might deepen into more severe market downturns. These warning signs help distinguish between normal correction processes and developing crisis conditions.
Technical Indicator Monitoring
Technical analysis provides early warning systems for correction severity through price and volume patterns. The ASX 200's current position near critical support levels requires careful observation for breakdown signals.
Critical Support Levels:
• 8,500-8,600 range: Major technical support zone
• Volume patterns: Increasing on declines, decreasing on rallies
• Breadth indicators: Advance-decline ratios deteriorating
• Momentum divergences: New price lows without momentum confirmation
Furthermore, market analysts at ProActive Investors suggest that oil spikes and bond sell-offs continue to impact risk appetite.
Breakdown below the 8,500 level would likely trigger additional technical selling, potentially extending the correction into bear market territory. Conversely, successful defence of these levels could signal correction maturity.
Fundamental Warning Signals
Beyond technical indicators, fundamental analysis reveals whether correction drivers reflect temporary adjustments or systemic problems requiring extended resolution periods.
Earnings Revision Trends:
Widespread analyst downgrades across ASX 200 components would indicate fundamental deterioration rather than valuation adjustment. Current earnings expectations of 18% growth appear vulnerable to modest revisions, but dramatic cuts would signal deeper problems.
Credit Market Indicators:
Corporate bond spread widening indicates credit market stress that often precedes equity market deterioration. Investment-grade spreads typically widen before equity corrections deepen, providing early warning signals for portfolio managers.
Economic Leading Indicators:
• Consumer confidence surveys indicating sentiment shifts
• Business investment plans reflecting growth expectations
• Employment data showing labour market resilience
• Housing market activity indicating consumer strength
Valuation Opportunities and Risk Management
Market corrections create valuation dislocations that experienced investors can exploit while managing downside risk through prudent position sizing and timing strategies. Current conditions present both opportunities and challenges requiring careful analysis.
Current Valuation Assessment
The 10% decline in the market has improved valuations across most sectors, though the attractiveness depends on specific companies and their fundamental outlooks. Quality companies with strong balance sheets trading at discounted multiples represent potential opportunities.
Valuation Improvement Metrics:
| Metric | Pre-Correction | Current | 5-Year Average |
|---|---|---|---|
| P/E Ratio (ASX 200) | 18.5x | 16.7x | 16.2x |
| Dividend Yield | 3.8% | 4.2% | 4.1% |
| Price-to-Book | 1.9x | 1.7x | 1.6x |
| EV/EBITDA | 12.1x | 10.9x | 10.5x |
While valuations have improved, they remain near historical averages rather than representing extreme bargains, suggesting selective rather than broad-based buying opportunities.
Risk Management During Volatility
Effective risk management during corrections requires balancing opportunity capture with capital preservation. Position sizing becomes crucial, as even quality investments can experience temporary significant declines during market stress.
Position Sizing Guidelines:
• Individual positions: 2-5% maximum during high volatility
• Sector concentration: 15-20% maximum in any single sector
• Quality focus: Emphasise companies with strong fundamentals
• Liquidity maintenance: Ensure ability to exit positions quickly
Portfolio Rebalancing Opportunities:
Corrections provide opportunities to rebalance portfolios toward target allocations at improved valuations. Selling outperforming assets (energy stocks) to buy underperforming quality names can enhance long-term returns while maintaining discipline.
Stop-Loss Versus Buy-and-Hold Approaches
The choice between systematic stop-loss strategies and buy-and-hold approaches depends on investment timeframes, risk tolerance, and market outlook. Each approach offers distinct advantages during correction phases.
Stop-Loss Strategy Benefits:
• Capital preservation during severe declines
• Emotional discipline through systematic rules
• Opportunity preservation for redeployment
• Risk limitation in uncertain environments
Buy-and-Hold Strategy Benefits:
• Avoidance of timing pressure and errors
• Long-term compounding through market cycles
• Dividend collection during market stress
• Reduced transaction costs and tax implications
The optimal approach often combines elements of both strategies, using stop-losses for speculative positions while maintaining core holdings in quality companies through market cycles.
Investment Decision Framework for Current Conditions
The current ASX 200 correction presents investors with classic market timing dilemmas: whether to buy apparent opportunities or wait for potentially lower prices. Historical analysis and current conditions suggest a nuanced approach balancing immediate opportunities with prudent caution.
Buying Opportunities Assessment
Quality ASX 200 companies trading at 10% discounts to recent highs represent moderate rather than exceptional opportunities. However, selective buying focused on companies with defensive characteristics and strong fundamentals could prove beneficial for long-term investors.
Opportunity Assessment Criteria:
• Dividend sustainability through economic cycles
• Balance sheet strength providing financial flexibility
• Competitive advantages protecting market position
• Management quality with crisis experience
• Valuation attractiveness relative to historical norms
Companies meeting these criteria historically outperform during recovery phases while providing downside protection during extended corrections.
Wait-and-See Strategy Justification
Arguments for delaying purchases include the possibility of deeper declines if economic conditions deteriorate or geopolitical tensions escalate. The historical precedent of four out of five oil shocks leading to recessions suggests caution may be warranted.
Reasons for Caution:
• Early correction stage potentially requiring more time to mature
• Economic uncertainty from persistent inflation pressures
• Geopolitical risks remaining elevated and unpredictable
• Technical support not yet firmly established
• Earnings revisions potentially forthcoming as conditions develop
Balanced Approach Implementation
Rather than making binary buy-or-wait decisions, experienced investors often employ phased approaches that capture opportunities while maintaining flexibility for changing conditions.
Phased Investment Strategy:
- Initial positioning: 25-30% of intended allocation at current levels
- Second phase: Additional 30-40% if markets decline another 5-7%
- Final phase: Remaining allocation during extreme weakness or recovery confirmation
- Continuous monitoring: Adjust phases based on developing conditions
This approach balances opportunity capture with risk management while reducing the pressure for perfect timing decisions.
Market Psychology and Investor Behaviour During Corrections
Understanding investor psychology during corrections helps explain market movements while providing insights for contrarian investment strategies. Current conditions demonstrate classic behavioural patterns that create both opportunities and risks for different investor types.
Emotional Cycle of Market Corrections
Corrections typically progress through predictable emotional phases that influence investor decision-making. Recognition of these phases helps investors maintain objectivity during stressful periods.
Correction Emotional Stages:
• Disbelief: Initial denial that significant decline is occurring
• Fear: Recognition of losses and concern about further declines
• Capitulation: Surrender and liquidation of positions
• Depression: Acceptance of losses and avoidance of markets
• Hope: Tentative re-engagement as conditions stabilise
The current correction appears to be transitioning from disbelief to fear as the 10% decline forces recognition that significant market stress is occurring.
Contrarian Opportunity Identification
Contrarian investors seek to capitalise on emotional extremes by purchasing when others are selling and maintaining patience during recovery phases. Current conditions have not yet reached contrarian extremes but show developing patterns.
Successful contrarian investing requires distinguishing between temporary sentiment extremes and fundamental deterioration that justifies persistent weakness.
Contrarian Indicators:
• Sentiment surveys showing extreme pessimism
• Margin debt declining as leverage reduces
• Insider buying increasing from corporate management
• Value opportunities emerging in quality companies
Institutional Versus Retail Behaviour
Different investor types exhibit distinct behavioural patterns during corrections, creating opportunities for those who understand these dynamics. Institutional investors typically maintain longer-term perspectives while retail investors often react more emotionally to short-term volatility.
Institutional Characteristics:
• Systematic rebalancing creating predictable buying/selling
• Risk management protocols triggering position adjustments
• Performance pressure influencing quarterly decision-making
• Liquidity requirements affecting timing of transactions
Retail Characteristics:
• Emotional reactions to daily price movements
• Media influence affecting sentiment and decisions
• Timing attempts trying to avoid losses or capture gains
• Limited diversification increasing portfolio volatility
Understanding these patterns helps investors position themselves advantageously relative to predictable behavioural responses from different market participants.
Economic Implications and Forward-Looking Analysis
The current ASX 200 correction occurs within a complex global economic environment where multiple factors interact to influence market outcomes. Analysing these relationships helps investors prepare for various scenarios while maintaining realistic expectations for recovery timing.
Base Case Scenario Analysis
The most probable outcome involves a correction duration of 2-3 months followed by gradual recovery as markets adapt to new equilibrium conditions. This scenario assumes geopolitical tensions stabilise without escalation while economic growth slows but avoids recession.
Base Case Assumptions:
• Oil prices stabilise in the US$100-115 range
• Inflation expectations moderate as supply disruptions resolve
• Economic growth slows but remains positive
• Corporate earnings experience modest revisions downward
• Central bank policy remains accommodative to support growth
Under this scenario, the ASX 200 would likely establish support near current levels before beginning recovery toward previous highs over 6-9 months.
Bear Case Considerations
Extended decline scenarios could develop if current tensions escalate or trigger broader economic deterioration. Historical precedent suggests vigilance is warranted given the correlation between oil shocks and economic recessions.
Bear Case Risk Factors:
• Geopolitical escalation damaging additional infrastructure
• Economic recession development in major economies
• Financial system stress emerging from unexpected sources
• Policy errors exacerbating rather than resolving tensions
Bear case outcomes could extend correction duration to 6-12 months with declines reaching 20-30% before establishing sustainable lows.
Bull Case Recovery Potential
Optimistic scenarios involve rapid resolution of current tensions combined with economic resilience that enables quick recovery. While less probable given current conditions, such outcomes remain possible.
Bull Case Catalysts:
• Diplomatic resolution of geopolitical tensions
• Economic data demonstrating resilience
• Corporate earnings exceeding revised expectations
• Central bank support providing market liquidity
• Technical buying emerging at support levels
Bull case scenarios could enable V-shaped recoveries within 1-2 months, though such outcomes typically require unexpectedly positive developments across multiple fronts simultaneously.
Disclaimer: This article contains forward-looking statements and analysis based on current market conditions. Past performance does not guarantee future results, and all investments carry risk of loss. Investors should conduct their own research and consider their individual financial circumstances before making investment decisions. Market corrections involve significant uncertainty, and actual outcomes may differ materially from scenarios discussed herein.
Want to Capitalise on ASX Discovery Opportunities?
Discovery Alert's proprietary Discovery IQ model delivers instant notifications on significant ASX mineral discoveries, helping investors identify actionable opportunities ahead of the broader market during volatile conditions like current corrections. Explore major historical discoveries that have generated substantial returns and begin your 14-day free trial today to position yourself strategically for market recovery.