
July 20, 2026
The Hidden Fiscal Architecture Behind Australia's Mining Revenue Machine
Few economic relationships are as structurally significant as the one between Australia's minerals sector and its federal and state governments. Unlike most industries, mining generates fiscal returns through two parallel mechanisms: company income tax calculated on profits, and royalties levied on extracted volumes or values. When commodity prices rise sharply, both streams swell simultaneously, creating the kind of revenue surges that fund hospitals, highways, and budget surpluses. When prices fall, both streams contract in unison, and the fiscal consequences ripple outward far beyond the industry itself.
Understanding why MCA mining tax and royalty payments declining in FY2023-24 requires more than a surface reading of commodity price charts. It demands an examination of how royalty structures are designed, how cost inflation interacts with profit-based taxation, and why certain states are far more exposed to commodity cycles than others.
When big ASX news breaks, our subscribers know first
The Decade That Redefined Mining's Fiscal Importance
Over the ten years to FY2024, the Australian minerals sector contributed a cumulative $394.6 billion to federal and state government revenues. To contextualise that figure, consider that it exceeds the combined annual GDP of many mid-sized economies. This extraordinary transfer of wealth from the ground to the public purse was not evenly distributed across the decade.
A disproportionate share arrived during the commodity price supercycle that peaked around FY2022 and FY2023, when global supply disruptions, post-pandemic industrial demand, and the energy crisis following Russia's invasion of Ukraine converged to push thermal coal, iron ore, and metallurgical coal prices to generational highs. The WA resources contribution alone illustrates just how pivotal the minerals sector has become to state and federal budget positions.
The combined record of $73.8 billion in mining-related government payments achieved in FY2022-23 reflected those extraordinary conditions. State royalty accounts filled rapidly, particularly in Queensland and New South Wales where coal prices at one point reached levels that had not been contemplated in royalty rate schedules designed years earlier. Federal company tax collections followed, reflecting the profitability surge flowing through to assessable income.
FY2024 marked the beginning of a normalisation phase, but the scale of the adjustment deserves careful attention.
How Much Have Mining Tax and Royalty Payments Actually Fallen?
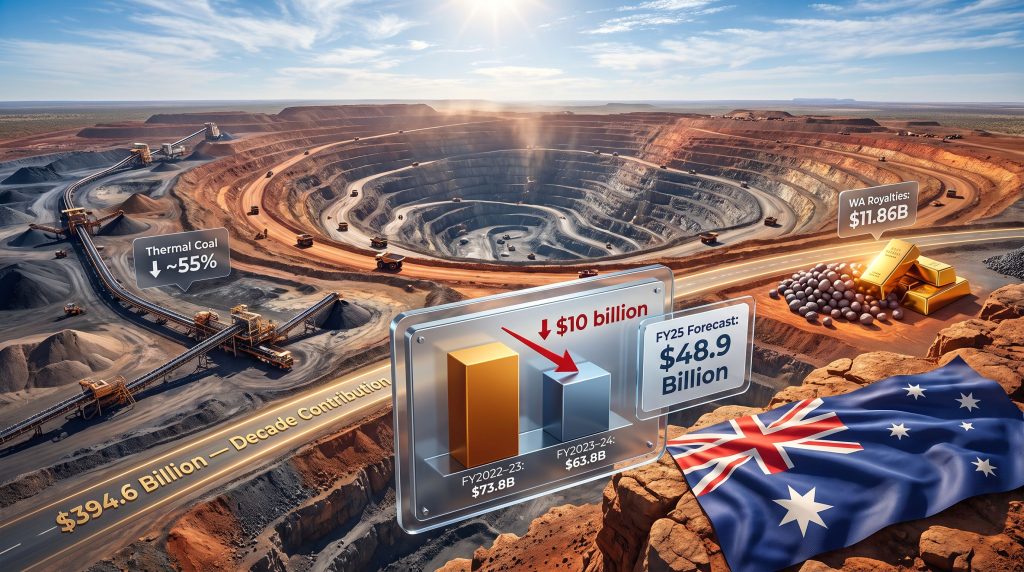
The combined total of company tax and state royalty payments from the minerals sector fell by approximately $10 billion in FY2023-24, declining from $73.8 billion to $63.8 billion. The breakdown by payment type reveals where the pressure was most acute.
| Revenue Stream | FY2022-23 | FY2023-24 | Change |
|---|---|---|---|
| State Royalties | $31.5 billion | $26.9 billion | -$4.6B (-14.6%) |
| Net Company Tax | ~$42.5 billion | ~$32.5 billion | -$10B (-23.5%) |
| Combined Total | $73.8 billion | $63.8 billion | -$10 billion |
Despite the decline, $63.8 billion represents a historically elevated level of contribution. Before the commodity supercycle of the early 2020s, annual combined payments rarely approached these figures. The current normalisation is better understood as a retreat from an exceptional peak rather than a descent into structural underperformance.
For the third consecutive year, the minerals sector's fiscal contribution exceeded that of every other sector of the Australian economy combined, a benchmark that underscores the industry's entrenched importance to public finances.
What Caused the Decline in Mining Tax and Royalty Revenue?
Several overlapping forces drove the revenue contraction. They are not equally weighted, and understanding their relative contributions is important for assessing whether the decline is temporary or structural.
Commodity Price Correction
The single most powerful driver was a 13.4% aggregate decline in commodity prices across the sector. This headline figure obscures enormous variation at the commodity level. Furthermore, while iron ore price trends showed moderate softening, thermal coal underwent a far more severe correction, falling approximately 55% from its peak levels.
That magnitude of price decline, applied to one of Australia's highest-volume export commodities, produced an outsized contraction in royalty revenue.
Thermal coal prices fell by approximately 55% from peak levels, making it the single largest driver of royalty revenue contraction, particularly for Queensland and New South Wales, where coal remains the dominant royalty-generating commodity.
Royalty Rate Structure and Ad Valorem Design
Most Australian state royalties are calculated on an ad valorem basis, meaning they are assessed as a percentage of the value of minerals extracted rather than on profits. While this provides states with revenue certainty across the cycle, it also means royalty collections fall directly and proportionally with commodity prices.
A 55% decline in coal prices translates, before volume adjustments, into a roughly equivalent decline in royalty receipts per tonne. The contrast with profit-based royalty structures, which would smooth revenue across price cycles, is significant and represents an ongoing policy debate within fiscal architecture discussions.
Cost Inflation and Margin Compression
Beyond commodity prices, the sector absorbed substantial cost inflation during and after the pandemic period. Labour costs, diesel, explosives, equipment, and logistics all remained elevated even as commodity revenue contracted. For company tax purposes, the relevant measure is not gross revenue but taxable profit.
When cost bases remain high while prices fall, profit margins compress faster than revenue declines, and company tax obligations shrink accordingly. This cost-price scissor dynamic amplified the company tax decline beyond what commodity price movements alone would have predicted. The broader resource export challenges facing Australia in 2025 compound these pressures further.
How Profitability Reductions Flow Through to Tax
Australian corporate tax operates on a 30% flat rate for large companies. When sector-wide margins contract, the aggregate taxable base narrows, reducing payments even when volume production remains stable or grows. This mechanism explains why company tax collections fell by a greater percentage than royalties, despite royalties being more directly tied to volatile spot prices.
The lagged nature of company tax assessments also means that the full impact of FY24 price corrections may not have been entirely captured within the FY24 reporting period, potentially creating residual headwinds into FY25 settlements.
Which States Were Hit Hardest by Declining Royalty Revenue?
Fiscal exposure to the royalty revenue decline was not distributed evenly across Australia's resource-producing states. The divergence reflects each jurisdiction's commodity concentration.
| State | Primary Royalty Driver | Relative Impact of Decline |
|---|---|---|
| Queensland | Thermal and metallurgical coal | High: significant revenue contraction |
| New South Wales | Thermal coal | High: elevated budget exposure |
| Western Australia | Iron ore, gold, lithium | Moderate: $11.86B collected, relatively resilient |
Queensland faced the sharpest adjustment. The state had benefited enormously from coal price peaks and had recalibrated its royalty rate schedule with additional tiers for higher price bands, a decision that generated substantial windfall revenue during the supercycle but has since created fiscal dependence on prices that have now retreated sharply.
The introduction of progressive royalty tiers in Queensland was a politically significant move that the industry argued reduced investment certainty, a tension that has not been fully resolved.
New South Wales carries similar structural exposure through its thermal coal royalty base, compounding budget planning challenges as the state manages its own fiscal trajectory.
Western Australia demonstrated considerably more resilience, collecting $11.86 billion in royalties during FY24. This relative stability reflected the state's more diversified commodity base, with iron ore volumes remaining robust despite moderate price softening, and gold royalties providing an additional buffer given gold's relative price strength during the period.
Is the Decline a Short-Term Correction or a Longer-Term Trend?
This is the question that should concern both fiscal planners and long-term investors most acutely. Independent analysis conducted by EY-Parthenon projects that combined MCA mining tax and royalty payments declining could continue, potentially reaching approximately $48.9 billion in FY25 if commodity prices do not recover materially. That figure would represent a cumulative decline of nearly $25 billion from the FY23 peak within just two years.
Three broad scenarios frame the forward outlook:
- Recovery Scenario: A meaningful rebound in thermal coal and iron ore prices stabilises combined payments above $55 billion in FY25, cushioning state budgets and moderating company tax shortfalls.
- Baseline Scenario: Prices remain subdued at current levels, payments track toward the EY-Parthenon estimate of $48.9 billion, and state governments are required to adjust spending assumptions accordingly.
- Deterioration Scenario: Continued cost inflation combined with further commodity price weakness or a global demand slowdown pushes payments below $45 billion, triggering formal budget reviews in coal-dependent states.
Historical mining revenue cycles suggest that post-peak recovery timelines are rarely linear. The decade following the end of the China-driven commodity boom of the mid-2000s saw Australian mining fiscal contributions remain below peak levels for an extended period before recovering.
The difference today is that several structural forces, including the energy transition reducing long-run thermal coal demand and the emergence of Australia's critical minerals royalty streams, may alter the shape of the next recovery relative to historical analogies.
The next major ASX story will hit our subscribers first
What the Minerals Council Is Advocating For
The Minerals Council of Australia has framed the revenue decline not as evidence of sector underperformance, but as a signal that existing fiscal frameworks require reassessment. The MCA's position centres on the argument that unstable and retrospective royalty rate changes, particularly Queensland's tiered escalation, undermine long-term capital allocation decisions by introducing fiscal uncertainty into project investment models.
The Minerals Council of Australia has argued that declining fiscal returns should prompt a reassessment of Australia's broader mining tax and royalty policy settings, framing the issue not as a sector in retreat, but as one requiring stable, predictable regulatory conditions to sustain long-term investment and future revenue generation.
This argument carries genuine economic logic. Large-scale mining projects operate over multi-decade timeframes, and the internal rate of return calculations used to justify capital commitments are sensitive to long-run royalty rate assumptions. When state governments introduce new royalty tiers mid-cycle, the effect is to retroactively alter the fiscal terms of investments already committed.
A recent EY report on mining royalty and company tax payments reinforces this point, noting that rational investors price such uncertainty into future decisions by demanding higher return thresholds or redirecting capital to more predictable jurisdictions.
The tension is real: governments facing windfall revenue temptation during price peaks will impose higher rates, only to find themselves arguing for investment attraction during downturns when those same companies are making the next generation of project decisions.
How Australia's Mining Fiscal Structure Compares Internationally
Australia operates a hybrid fiscal model in which both ad valorem royalties and corporate income tax apply, supplemented in the petroleum sector by the Petroleum Resource Rent Tax (PRRT). This stacking of fiscal instruments is relatively common internationally, but the specific rate structures and calculation bases vary considerably.
Key structural distinctions include:
- Ad valorem vs. profit-based royalties: Ad valorem systems, dominant across Australian states, generate revenue regardless of profitability but create boom-bust fiscal cycles. Profit-based or net smelter return structures, more common in some Canadian provinces and parts of Africa, smooth revenue across cycles at the cost of greater government revenue uncertainty.
- Effective rates: Australia's effective royalty rates for coal and iron ore sit within the mid-range of comparable jurisdictions globally, though the addition of corporate tax at 30% means the combined government take is toward the higher end when integrated across the fiscal stack.
- Stability premium: Jurisdictions that have maintained consistent royalty frameworks over long periods, such as some US states and parts of Canada, attract a measurable stability premium in investor capital allocation, a concept the MCA is effectively invoking in its policy reset argument.
What Declining Mining Revenue Means for Federal and State Budgets
The fiscal dependency problem is both well-understood and underaddressed in Australian budget design. When mining revenues represent a dominant proportion of state royalty income, as they do in Queensland and Western Australia, state budgets inevitably reflect commodity cycle volatility. Infrastructure pipelines, healthcare capacity expansions, and education investments sized against peak revenue assumptions become financially strained when payments contract by $10 billion or more within a single year.
State treasuries have generally adopted conservative commodity price assumptions in forward budget estimates, but the magnitude and speed of the FY24 correction tested those assumptions. Queensland's budget, in particular, was calibrated in part against coal royalty projections that required significant revision as prices fell through the year.
The forward projection of $48.9 billion in FY25 combined payments, if realised, would represent approximately 34% below the FY23 peak, demanding meaningful fiscal adjustment across multiple jurisdictions simultaneously. At the federal level, the commodity price impact on company tax collections reduces Commonwealth revenue, though the federal budget's broader diversification provides a more significant buffer than exists for coal-dependent states.
Frequently Asked Questions: MCA Mining Tax and Royalty Payments Declining
Why did Australian mining royalty payments decline in FY24?
Royalty payments fell primarily due to a significant correction in commodity prices, particularly thermal coal, which dropped approximately 55% from peak levels, combined with rising operating costs that reduced sector profitability and therefore company tax obligations.
How much did combined mining tax and royalty payments fall in FY24?
Combined payments declined by approximately $10 billion, from a record $73.8 billion in FY2022-23 to $63.8 billion in FY2023-24.
Which Australian states were most affected by the royalty revenue decline?
Queensland and New South Wales experienced the greatest impact due to their structural reliance on coal royalties. Western Australia demonstrated greater resilience, collecting $11.86 billion in royalties through its diversified commodity base.
What is the outlook for Australian mining tax revenue in FY25?
Independent analysis from EY-Parthenon projects that combined payments could fall further to approximately $48.9 billion in FY25 if commodity prices do not recover materially, representing a potential decline of over $15 billion from the FY24 level. Coverage from that's mining and other industry publications has similarly highlighted the scale of adjustment facing state and federal governments in the period ahead.
What policy changes is the minerals industry advocating for?
The Minerals Council of Australia has called for a broad policy reset focused on creating more stable and predictable fiscal settings, arguing that volatile royalty frameworks undermine the long-term investment confidence necessary to sustain future government revenue from the sector.
Key Takeaways
- Combined MCA mining tax and royalty payments declining saw a fall of $10 billion in FY24, reaching $63.8 billion
- The decline was led by a 13.4% commodity price correction, with thermal coal prices falling approximately 55%
- Despite the drop, FY24 payments remained well above pre-2022 historical averages and above all other sectors combined
- Queensland and NSW face the greatest fiscal exposure; Western Australia demonstrated relative resilience with $11.86 billion in royalties collected
- Forward projections suggest payments could fall to $48.9 billion in FY25 without a commodity price recovery
- The MCA is advocating for a policy reset to stabilise fiscal settings and preserve long-term investment incentives
- The minerals sector has contributed $394.6 billion to government revenues over the past decade
- The structural design of ad valorem royalties amplifies boom-bust fiscal cycles, a dynamic increasingly scrutinised by policy analysts
This article contains forward-looking projections and scenario modelling sourced from independent analysis. Such projections are subject to significant uncertainty and should not be relied upon as financial or fiscal advice. Actual outcomes will depend on commodity price movements, cost trajectories, production volumes, and regulatory decisions that cannot be predicted with certainty.
Want to Track the Next Major ASX Mineral Discovery Before the Market Moves?
Discovery Alert's proprietary Discovery IQ model delivers real-time alerts on significant ASX mineral discoveries, translating complex mineral data into actionable insights for both short-term traders and long-term investors — explore the historic returns major discoveries have generated and begin your 14-day free trial to position yourself ahead of the broader market.