
August 7, 2026
The Hidden Economics of Mid-Year Guidance Revisions in Gold Mining
Investors who follow gold producers closely understand that annual guidance figures released at the start of a financial year are, at best, informed estimates. They rest on modelled ore grades, assumed equipment availability, projected weather conditions, and forecast metallurgical recoveries. When a company revises that guidance upward partway through the year, it is not simply reporting better numbers. It is signalling that its operational model is outperforming assumptions across multiple variables simultaneously.
That distinction matters enormously to how the market should interpret such an announcement. Furthermore, understanding how gold prices affect mining equities adds another layer to this analysis, particularly when volume upgrades coincide with a supportive pricing environment.
Mid-year upward revisions carry a credibility premium that initial guidance simply cannot. By the time a producer revisits its annual target in the second half of a year, actual ore processing data, mill throughput records, and grade reconciliation results from the first six months provide a factual foundation that planning models never can. This is the context through which McEwen Mining's decision to lift its full-year 2026 production target for the Fox Complex deserves to be understood.
When big ASX news breaks, our subscribers know first
McEwen Increases Full-Year Output Guidance for Fox Complex: The Numbers Behind the Revision
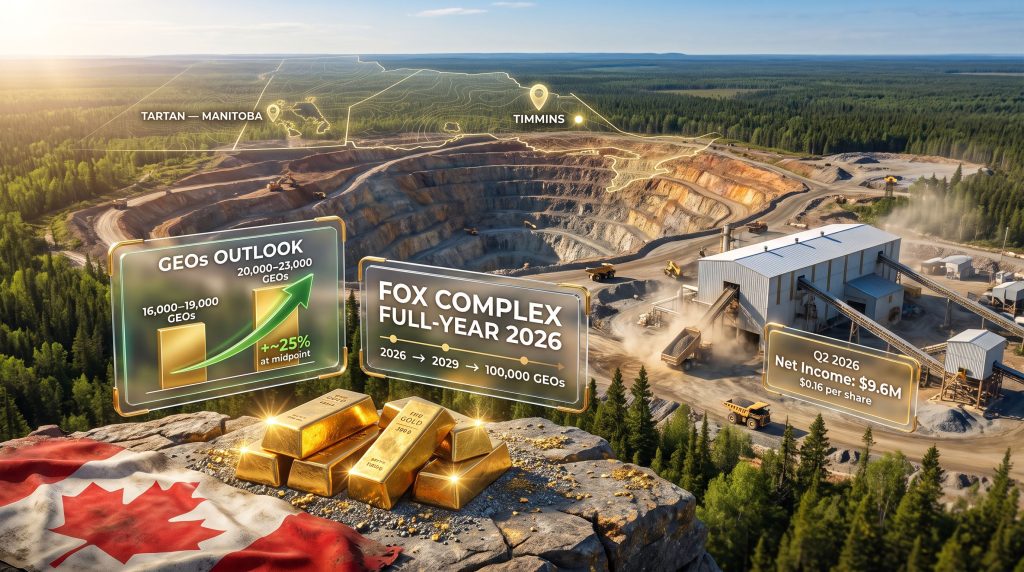
The scale of the adjustment is difficult to dismiss as routine. McEwen increases full-year output guidance for Fox Complex, moving its 2026 production target from a range of 16,000 to 19,000 gold-equivalent ounces (GEOs) to a revised range of 20,000 to 23,000 GEOs, representing an increase of approximately 25% at the midpoint. Crucially, the all-in sustaining cost (AISC) guidance for the complex remains unchanged at $2,650 to $2,850 per GEO, meaning the volume uplift arrives without any corresponding cost penalty.
The anchor for this revision is first-half 2026 actual production of 12,785 GEOs. On a simple annualised run-rate basis, that figure comfortably supports the upper end of the revised annual target and provided management with the operational confidence to make the adjustment.
| Metric | Previous Guidance | Revised Guidance | Change |
|---|---|---|---|
| Fox Complex Full-Year Output | 16,000–19,000 GEOs | 20,000–23,000 GEOs | ~+25% at midpoint |
| AISC (Fox Complex) | $2,650–$2,850/GEO | $2,650–$2,850/GEO | Unchanged |
| H1 2026 Actual Production | Reference baseline | 12,785 GEOs | Confirmed |
| Consolidated Group 2026 Output | Reference | 109,000–120,000 GEOs | Full-year target |
What Is a Gold-Equivalent Ounce and Why Does It Matter?
For investors less familiar with the metric, a GEO is a standardised unit that converts all metal production from a mine into a single gold-equivalent figure using prevailing metal prices. It allows multi-metal producers to communicate total output in one comparable number, regardless of whether the mine also produces silver, copper, or other payable metals. For the Fox Complex, which is a predominantly gold-focused operation, GEOs closely approximate actual gold ounce production, making the guidance revision a direct proxy for physical output performance.
A mid-year upward revision that leaves cost guidance unchanged is one of the cleaner positive signals a gold producer can send. It suggests volume outperformance rather than cost-cutting, which is a structurally healthier outcome for long-term margin quality.
The Fox Complex: Understanding the Asset at the Centre of McEwen's Canadian Strategy
The Fox Complex sits in the Timmins region of northern Ontario, one of the most enduring gold-producing jurisdictions in Canadian mining history. The Timmins camp has been in continuous gold production since the early twentieth century, and its geological setting within the Abitibi Greenstone Belt provides the structural and geochemical conditions that have sustained multiple generations of mining operations.
What distinguishes the Fox Complex operationally is its role as a centralised milling hub. Rather than building standalone processing infrastructure for each deposit, McEwen channels ore from multiple satellite operations into a shared milling facility. This architecture creates meaningful operational leverage: fixed processing costs are distributed across a larger ore volume as additional deposits come online, improving unit economics without requiring proportional capital reinvestment.
How the Fox Complex Compares Across McEwen's Multi-Jurisdiction Portfolio
| Asset | Location | 2026 Guidance (GEOs) | Key Status |
|---|---|---|---|
| Fox Complex | Timmins, Ontario | 20,000–23,000 | Guidance raised |
| Gold Bar Complex | Nevada, USA | 30,000–33,000 | Guidance lowered |
| San José Mine (49% interest) | Santa Cruz, Argentina | 60,000–70,000 | Attributable production |
| El Gallo Mine | Mexico | ~20,000 (from H2 2027) | Pre-production |
The Fox Complex currently contributes the second-smallest volume among McEwen's producing assets, but its growth trajectory to 100,000 GEOs by 2029 positions it as the most significant medium-term production growth engine in the portfolio. For context, broader gold market prospects suggest that producers demonstrating this kind of scalable output growth are increasingly well-positioned.
The Abitibi Greenstone Belt: Why Geology Underpins the Fox Complex's Long-Term Potential
Understanding why the Fox Complex growth thesis is credible requires a brief excursion into the geology beneath Timmins. The Abitibi Greenstone Belt, which straddles the Ontario-Quebec border, is one of the largest Archean greenstone belts on Earth and has produced more gold than virtually any comparable geological province globally. Greenstone belts form through ancient volcanic and sedimentary sequences that create the structural corridors, hydrothermal systems, and chemical traps that concentrate gold mineralisation.
The Black Fox mine, currently the primary producing asset within the Fox Complex, is a narrow-vein underground operation where gold occurs in quartz-carbonate veins hosted within a shear zone. The Stock Mine and Grey Fox deposits occupy structurally similar settings nearby, which is why McEwen's phased development strategy of feeding all three into a single mill is geologically coherent rather than merely financially convenient.
A less commonly discussed aspect of multi-deposit mill hub strategies in Archean greenstone settings is ore blending flexibility. When a central mill receives ore from deposits with varying grades and hardness characteristics, experienced metallurgical teams can optimise blending ratios to maintain consistent mill feed quality and maximise recoveries. This is one reason why softer ore from the Stock Mine is operationally significant beyond just the energy savings it implies.
The 100,000 GEO Target by 2029: Phased Development Logic
McEwen's roadmap for growing the Fox Complex from its current output level to approximately 100,000 GEOs per year by 2029 rests on two additional development projects layered onto the existing Black Fox production base.
Stock Mine: Three Compounding Cost Advantages
The Stock Mine is positioned as a lower-cost incremental production source relative to Black Fox, and three structural factors drive that cost advantage:
-
Royalty structure: The Stock Mine carries a lower royalty burden than Black Fox, directly reducing the per-ounce cost drag that royalties impose on AISC calculations at the Fox Complex level.
-
Logistics efficiency: Shorter haulage distances between the Stock Mine and the existing central mill reduce ore transport costs, which in open-pit and underground operations can represent a meaningful proportion of total cash costs.
-
Material characteristics: Softer ore requires less energy-intensive crushing and grinding in the mill. In an industry where energy is frequently the largest single operating cost at the processing stage, softer ore translates directly into lower processing costs per tonne and improved mill throughput rates.
Grey Fox: Capital Efficiency Meets High Returns
Grey Fox emerges as offering high financial returns relative to its initial capital requirements. For a mid-tier producer managing multiple simultaneous development programmes across four countries, this capital efficiency profile is strategically important. It reduces the risk of capital allocation trade-offs forcing delays to other portfolio priorities. In addition, definitive feasibility studies for projects at this stage often reveal further optimisation opportunities that can enhance the initial financial case.
| Development Phase | Key Asset | Role in 100K Target | Timeline |
|---|---|---|---|
| Current base | Black Fox Mine | Existing production anchor | 2026 |
| Phase 2 | Stock Mine | Lower-cost incremental volume | Pre-2029 |
| Phase 3 | Grey Fox | High-return production addition | Pre-2029 |
| Combined target | Full Fox Complex | ~100,000 GEOs/year | 2029 |
Tartan Mine: Why McEwen Is Rethinking the Scale of Its Manitoba Project
Separate from the Ontario cluster, McEwen is conducting a review of the Tartan Mine project in Manitoba that carries notable implications for its longer-term production profile. The original development concept envisaged milling rates of 500 to 1,000 tonnes per day. The company is now evaluating a larger scenario with throughput of 1,000 to 1,500 tonnes per day, representing up to a 50% increase in processing capacity relative to the upper end of the original plan.
At the expanded throughput scenario, Tartan has the potential to produce between 40,000 and 65,000 GEOs annually over a seven-to-ten-year operational life, which would make it a material standalone contributor to McEwen's consolidated output.
The willingness to review a larger scale scenario typically reflects one of two things: either resource definition work has returned a more extensive ore body than originally modelled, or updated capital and operating cost assumptions at higher throughput show sufficiently better unit economics to justify the additional upfront investment. A seven-to-ten-year mine life at the production rates contemplated would provide a long-duration asset capable of supporting sustained cash flow generation.
The next major ASX story will hit our subscribers first
Gold Bar Complex: Reading the Nevada Guidance Cut Correctly
Not all components of McEwen's 2026 operational update are positive. The Gold Bar Complex in Nevada has seen its production guidance reduced from 39,000 to 43,000 GEOs to 30,000 to 33,000 GEOs, accompanied by elevated AISC guidance of $2,900 to $3,200 per ounce.
| Metric | Previous Guidance | Revised Guidance |
|---|---|---|
| Gold Bar Output | 39,000–43,000 GEOs | 30,000–33,000 GEOs |
| All-In Sustaining Cost | Not specified | $2,900–$3,200/oz |
The cause is a heap leach operational shortfall. Heap leach processing involves stacking crushed ore on lined pads and applying a cyanide solution that percolates through the ore, dissolving gold and carrying it to a recovery facility. The system is highly sensitive to ore placement rates because the gold-bearing solution only flows through ore that has actually been placed on the pad. When ore placement volumes fall below plan, recovery volumes in subsequent periods decline proportionally.
Furthermore, the fixed cost base of the operation is then spread over fewer ounces, driving AISC higher. This is a well-understood operational vulnerability in heap leach mining. Unlike agitated leach or carbon-in-pulp processing, where throughput can be adjusted relatively quickly, heap leach systems have a significant lag between ore placement and gold recovery, making it difficult to compensate for a first-half shortfall by accelerating second-half activity.
Despite the near-term setback, Gold Bar retains a longer-term growth pathway targeting 90,000 to 110,000 GEOs by 2030, anchored by three expansion projects: Windfall, Lookout Mountain, and Trinity Ridge.
Q2 2026 Financial Results: Earnings Growth Validates Operational Leverage
McEwen's Q2 2026 financial results provide important context for assessing whether operational activity is translating into shareholder value. The company reported net income of $9.6 million, or $0.16 per share, compared with net income of $3.0 million, or $0.06 per share, in the same quarter of 2025. That represents more than a threefold improvement in net income on a year-over-year basis.
This earnings trajectory reflects the operational leverage that gold producers carry in a rising price environment. When gold prices increase, revenue per ounce rises while a significant portion of the cost base remains fixed or semi-fixed, producing a disproportionate improvement in margins. The continued exploration activity across McEwen's jurisdictions signals management's focus on expanding the resource base underpinning future mine plans.
Portfolio Architecture: Four Countries, Five Production Streams
McEwen's multi-jurisdiction structure distributes risk across Canada (Ontario and Manitoba), the United States (Nevada), Argentina, and Mexico. Each jurisdiction presents a distinct combination of royalty obligations, tax regimes, operating cost structures, and community and regulatory considerations.
The 49% attributable interest in the San José mine in Santa Cruz, Argentina, provides access to meaningful production of 60,000 to 70,000 GEOs per year without full operational control, which limits both upside flexibility and downside exposure to single-asset events. Argentina's operating environment carries its own currency and fiscal complexity, making the partial rather than full ownership structure a relevant risk management consideration.
The El Gallo mine in Mexico, forecast to contribute approximately 20,000 GEOs from the second half of 2027, will add a fifth production stream and reduce concentration in any single country. Its contribution will be fully reflected in 2028 consolidated guidance, adding another layer to McEwen's medium-term production growth story. For investors assessing whether the company represents a compelling opportunity, reviewing undervalued gold mining stocks with similar growth profiles may provide useful comparative context.
Consolidated Production Growth Trajectory
| Year | Consolidated Target (GEOs) | Key Growth Driver |
|---|---|---|
| 2026 | 109,000–120,000 | Fox Complex upgrade, San José contribution |
| 2027 | TBD | El Gallo production commencement (H2) |
| 2029 | ~200,000+ (estimated) | Fox Complex 100K + Gold Bar growth |
| 2030 | ~200,000–230,000 (estimated) | Full Gold Bar expansion to 90,000–110,000 |
Note: 2029 and 2030 figures are company-stated targets and involve forward-looking assumptions that may differ materially from actual outcomes. Investors should review McEwen Mining's regulatory filings and risk disclosures before drawing investment conclusions.
Frequently Asked Questions: McEwen Fox Complex Guidance Upgrade
What is the Fox Complex and where is it located?
The Fox Complex is a gold mining and processing operation situated near Timmins in northern Ontario, Canada. It functions as a centralised milling hub for several satellite gold deposits within the same geological corridor, including the Black Fox mine, the Stock Mine, and the Grey Fox project.
Why did McEwen raise Fox Complex production guidance for 2026?
The upward revision from 16,000 to 19,000 GEOs to 20,000 to 23,000 GEOs reflects stronger-than-anticipated first-half 2026 production of 12,785 GEOs. That actual result provided management with sufficient operational confidence to lift the full-year target at the midpoint by approximately 25%.
Did the cost guidance change alongside the production upgrade?
No. AISC guidance for the Fox Complex remains unchanged at $2,650 to $2,850 per GEO. A volume upgrade without a cost increase is a positive signal for per-ounce margin expansion at the complex level.
What is McEwen's long-term production target for the Fox Complex?
McEwen is targeting approximately 100,000 GEOs per year from the Fox Complex by 2029, driven by the phased development of the Stock Mine and Grey Fox project using the existing central milling facility. Investors interested in interpreting drill results from the ongoing exploration programmes at these deposits will find that such data often provides early signals of future resource growth.
Why was Gold Bar Complex guidance reduced for 2026?
Lower-than-planned ore placement volumes on the Nevada heap leach pad directly reduced recoverable gold output in the period, resulting in a production cut from 39,000 to 43,000 GEOs down to 30,000 to 33,000 GEOs, alongside higher AISC of $2,900 to $3,200 per ounce.
What is the Tartan Mine project?
Tartan is a development-stage gold project in Manitoba, Canada. McEwen is evaluating a scaled-up development scenario with milling capacity of 1,000 to 1,500 tonnes per day, up from the original 500 to 1,000 tonnes per day concept. At the larger scale, annual production could reach 40,000 to 65,000 GEOs over a seven-to-ten-year mine life.
Key Takeaways
-
Fox Complex guidance raised by ~25% at the midpoint, from 16,000 to 19,000 GEOs to 20,000 to 23,000 GEOs for full-year 2026, anchored by H1 2026 actual output of 12,785 GEOs.
-
AISC unchanged at $2,650 to $2,850 per GEO, preserving margin quality alongside volume growth.
-
100,000 GEO Fox Complex target by 2029 underpinned by phased Stock Mine and Grey Fox development using shared central milling infrastructure in the Abitibi Greenstone Belt.
-
Gold Bar Complex guidance reduced due to heap leach ore placement shortfall, with AISC rising to $2,900 to $3,200 per ounce, though a longer-term growth pathway to 90,000 to 110,000 GEOs by 2030 remains intact.
-
Tartan Mine expansion review signals potential for a materially larger Manitoba operation producing up to 65,000 GEOs annually over a seven-to-ten-year mine life.
-
Q2 2026 net income of $9.6 million represents more than triple the prior year comparable result of $3.0 million.
-
Consolidated 2026 group guidance stands at 109,000 to 120,000 GEOs across all operating jurisdictions.
This article contains forward-looking production targets and financial projections based on company guidance. Actual results may differ materially. This content is intended for informational purposes only and does not constitute financial or investment advice. Readers should conduct independent research and consult qualified advisors before making investment decisions.
Want to Identify the Next Major ASX Gold Discovery Before the Market Does?
Discovery Alert's proprietary Discovery IQ model delivers real-time alerts the moment significant mineral discoveries are announced on the ASX, translating complex geological and production data into actionable investment insights for both short-term traders and long-term investors — explore historic discovery returns on Discovery Alert's dedicated discoveries page and begin your 14-day free trial to position yourself ahead of the market.