
June 12, 2026
The Invisible Architecture Beneath Every Barrel: How Geopolitics Shapes Middle East Crude Flows
Few forces in the global economy operate with the quiet, structural permanence of Middle East crude exports. Long after headlines fade, the physical reality of tanker routes, pipeline throughput, and refinery feedstock contracts continues to shape energy prices worldwide. Yet in 2026, the architecture that has governed these flows for decades is under greater stress than at any point since the first Gulf War. Understanding why requires looking not just at current events, but at the underlying mechanisms that make this region simultaneously indispensable and acutely vulnerable.
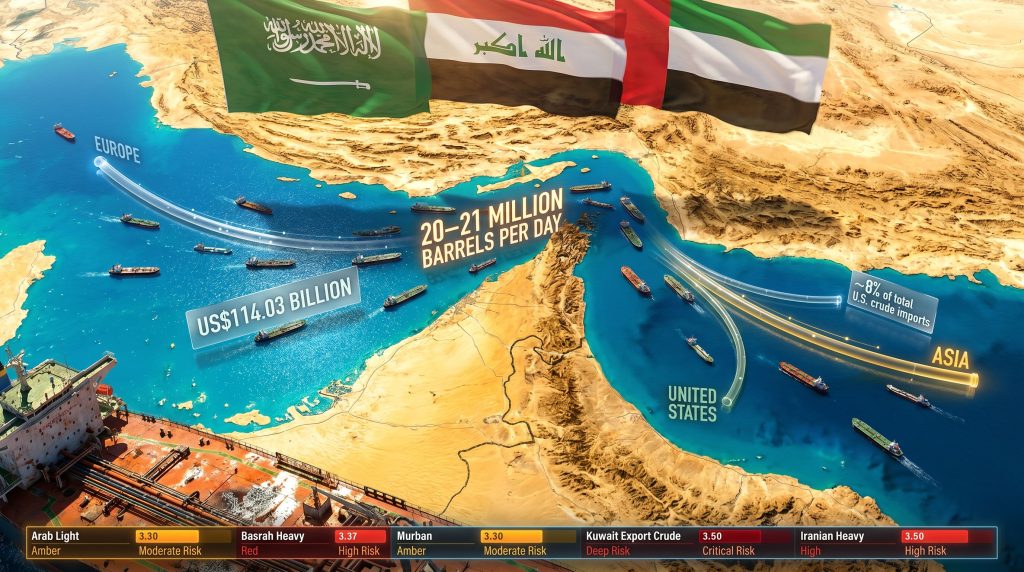
The Middle East accounts for approximately 30 to 33 percent of global crude oil production, and its three dominant exporters, Saudi Arabia, Iraq, and the UAE, collectively represent the world's largest crude export bloc. Regional mineral fuels and oils are estimated to carry an export value of around US$114 billion in 2025, a figure that reflects not just volume but the extraordinary concentration of energy leverage residing within a relatively compact geography. When that geography becomes politically volatile, the entire global crude pricing architecture begins to shift.
When big ASX news breaks, our subscribers know first
Current Export Volumes and Where the Crude Is Actually Going
A Destination-by-Destination Breakdown
Middle East crude exports in 2025 and 2026 continue to flow predominantly eastward, with Asia absorbing the largest share by a significant margin. China, India, Japan, and South Korea collectively represent the gravitational centre of Middle Eastern export strategy. However, the composition of that Asian demand is more complicated than simple volume figures suggest.
| Destination Region | Approximate Import Volume | Key Market Dynamics |
|---|---|---|
| Asia (China, India, Japan, South Korea) | Largest share of ME crude flows | Competing directly with discounted Russian supply |
| Europe | ~400 kb/d increase vs. 2021 levels | Partially replacing sanctioned Russian barrels post-2022 |
| United States | Supplementary to domestic and Western Hemisphere supply | |
| Other regions | Smaller but growing flows | Expanding refinery demand in Southeast Asia and Africa |
Europe's structural shift is worth examining closely. The displacement of Russian crude following the 2022 sanctions regime created a persistent supply gap in European refinery feedstocks that Middle Eastern producers, particularly Saudi Arabia and Iraq, have moved to partially fill. According to data on Middle East crude exports, European imports of Middle East crude have risen by approximately 400,000 barrels per day compared to 2021 levels, a trend that now appears durable rather than transitional.
The Russian Discount Problem and Asian Market Share Erosion
The competitive dynamics in Asia represent perhaps the most strategically complex challenge facing Gulf exporters. Since 2022, heavily discounted Russian Urals crude has captured meaningful market share in India, with Indian refiners demonstrating a consistent willingness to prioritise margin over supply-chain predictability. Furthermore, the sanctions impact on Russian oil has inadvertently redirected significant volumes toward Asian markets, intensifying this competition for Gulf producers.
Saudi Aramco has responded through adjustments to its official selling prices (OSPs), the monthly pricing mechanism that sets the differential between Saudi crude grades and benchmark prices for specific delivery regions. The OSP adjustment tool is more nuanced than it appears on the surface. Rather than simply cutting prices, Aramco uses OSP differentials to signal where it wants barrels to flow and to defend long-term customer relationships without triggering price wars.
However, there is a limit to how far OSP concessions can go before they undermine the fiscal arithmetic of the Saudi state budget. The breakeven oil price for Saudi Arabia's national budget has been estimated by the IMF at between $70 and $80 per barrel in recent years, creating a floor below which aggressive discounting becomes fiscally self-defeating. For a deeper breakdown of how these LPG official selling prices and benchmark mechanisms interact across the region, the dynamics extend well beyond crude alone.
China's response to the new competitive environment has been a dual-sourcing strategy, deliberately maintaining procurement relationships with both Middle Eastern and Russian suppliers to preserve optionality and prevent dependence on any single origin. For Gulf exporters, this means that retaining Chinese market share requires competing not just on price but on grade quality, supply reliability, and the breadth of downstream services offered alongside physical crude.
The Strait of Hormuz: Why 21 Million Barrels a Day Hinge on One Narrow Channel
The Physics of a Chokepoint
Approximately 20 to 21 million barrels per day of crude oil, condensates, and refined petroleum products transit the Strait of Hormuz, representing close to 20 percent of the world's total daily oil supply moving through a channel barely 33 kilometres wide at its narrowest navigable point. The strait sits between Iran to the north and Oman to the south, and its strategic geography has made it the single most consequential maritime chokepoint in the global energy system.
What makes Hormuz uniquely dangerous from a supply security perspective is the near-total absence of scalable bypass alternatives for most producers. The two significant pipeline alternatives are:
- Saudi Arabia's East-West Pipeline (Petroline): Capacity of approximately 5 million b/d, though actual throughput and operational utilisation remain well below that theoretical ceiling, and it does not bypass the requirement for tanker loading on the Red Sea end.
- UAE's Abu Dhabi Crude Oil Pipeline (ADCOP): Operational since 2012, with a capacity of approximately 1.5 million b/d, it connects Abu Dhabi production fields directly to the port of Fujairah on the Gulf of Oman, providing genuine Hormuz bypass capability for a portion of UAE output.
Iraq and Kuwait, however, have no viable overland export alternatives whatsoever. Every barrel from Basrah, every tanker loading at Mina Al-Ahmadi, transits the strait. This creates a deeply asymmetric vulnerability structure within the Gulf producer group.
What a Disruption Would Actually Mean for Global Prices
Scenario Risk Note: A sustained closure or partial interdiction of the Strait of Hormuz would represent a supply shock of a magnitude without modern precedent, potentially removing a larger volume of crude from accessible markets than any single disruption event in history, including the 1973 Arab oil embargo or the 1990 Gulf War supply shock.
Historical precedents from past Hormuz tension episodes, including the tanker wars of the 1980s and the 2019 drone and mine attacks on Gulf shipping, demonstrate that even threatened disruption, rather than actual closure, is sufficient to trigger significant crude price movements. The mechanism is not simply physical scarcity; it operates through the insurance and freight markets, where war risk premiums on tanker voyages through the Gulf can rise sharply within hours of an escalatory event.
When war risk insurance surcharges increase substantially, the economic cost of transiting the Strait effectively rises for all buyers, functioning as an invisible tariff on every barrel. Shipping companies facing elevated risk assessments may choose to reroute Very Large Crude Carriers (VLCCs) around the Cape of Good Hope, adding approximately 15 to 20 additional days to voyage times for cargoes originally destined for Europe. The freight economics of Cape rerouting versus Hormuz transit become the market's real-time barometer of perceived conflict intensity.
Israel-Lebanon Tensions and the Narrowing Window for a US-Iran Nuclear Deal
Why Levant Conflict Complicates Iranian Sanctions Relief
The diplomatic pathway to a renewed US-Iran nuclear agreement has always been narrow, but active hostilities involving Israel and Lebanon have compressed that window further by consuming political bandwidth, hardening negotiating positions on all sides, and creating domestic political constraints within the United States that make any agreement carrying perceived regional costs significantly harder to ratify in practice.
Iran's crude export capacity under current sanctions conditions is estimated at approximately 1.5 to 1.8 million barrels per day, with meaningful volumes flowing to China through a combination of ship-to-ship transfers, flag-of-convenience arrangements, and pricing structures that make direct traceability difficult. A successful nuclear agreement could, in principle, restore Iranian exports toward pre-sanctions levels approaching 2.5 million b/d or higher, introducing a substantial new volume of supply into an already competitive Asian market. The IEA's analysis of Middle East energy markets provides further context on how such a scenario would reverberate across global supply chains.
Three Scenarios and Their Market Implications
Scenario 1: Diplomatic Breakthrough
A US-Iran agreement is reached, Iranian crude re-enters global markets at scale within 6 to 12 months of implementation, Brent and Dubai crude benchmarks face downward pressure, and intra-regional competition among Gulf exporters intensifies as Iran reclaims market share in China and potentially India.
Scenario 2: Prolonged Stalemate
No deal is reached but active hostilities do not expand materially. The current export structure and geopolitical risk premium in crude prices remain broadly stable. Asian buyers maintain dual-sourcing strategies. War risk insurance premiums on Gulf shipping stay elevated but do not spike further.
Scenario 3: Escalation
Regional conflict expands, Hormuz disruption risk rises materially, Brent crude breaks through key technical resistance levels, and International Energy Agency (IEA) member states begin coordinated strategic petroleum reserve (SPR) releases as a demand-side buffer measure.
Downstream Effects: Jet Fuel, Diesel, LPG, and the Freight Market as a Leading Indicator
Product Market Disruptions Already Visible
The Iran conflict's influence has not been confined to crude benchmarks. Refined product markets have registered its impact with particular acuity. Global jet fuel prices rose sharply in the March to June 2026 period, driven by a combination of supply route uncertainty, elevated insurance costs, and the diversion of regional refinery capacity. Gulf Coast diesel markets in the United States also experienced disruption, as the reorientation of Middle Eastern product flows created temporary supply gaps that were only partially offset by Atlantic Basin sources.
In the European biofuels market, an unusual decoupling occurred as ARA (Amsterdam-Rotterdam-Antwerp) biofuel prices diverged from the broader fossil complex precisely when jet fuel and gasoil prices surged. This divergence reflected the market's simultaneous pricing of fossil supply disruption risk and the structural limits on biofuel's capacity to substitute for petroleum-based jet fuel in the short term.
LPG markets across Asia experienced import premium increases as supply route disruptions affected the normal flow of Middle Eastern propane and butane cargoes, adding a further dimension to the region's energy cost inflation during this period.
The Tanker Market as a Forward-Looking Indicator
One underappreciated analytical tool for monitoring the real-time severity of Hormuz risk is the VLCC and Suezmax utilisation rate. When actual crude flow disruption occurs or is credibly threatened, spot freight rates for these vessel classes rise sharply as charterers compete for available tonnage outside the risk zone. The spread between war risk insurance premiums for Gulf routes versus non-Gulf benchmarks provides a continuously updated market signal of how professional risk assessors are pricing the probability of an incident.
An important long-term structural question that risk consultants have raised is whether the Strait of Hormuz freight market will revert to its pre-conflict baseline once active hostilities ease, or whether the conflict will have permanently recalibrated perceived baseline risk upward. The historical precedent from the 1980s tanker wars suggests that markets do eventually normalise, but the process can take years rather than months, and the new normal often embeds a residual premium that did not exist before the conflict began.
Grade-Level Exposure: Not All Middle East Crude Is Equally at Risk
Which Grades Face the Highest Disruption Risk
| Crude Grade | Origin | Primary Destination | Hormuz Dependency | Risk Level |
|---|---|---|---|---|
| Arab Light | Saudi Arabia | Asia, Europe | High (partial bypass via Petroline) | Moderate to High |
| Basrah Heavy/Light | Iraq | Asia, Europe | Full | High |
| Murban | UAE | Asia | Partial (ADCOP bypass available) | Moderate |
| Kuwait Export Crude | Kuwait | Asia | Full | High |
| Iranian Heavy/Light | Iran | China, indirect routes | Full | Very High |
During periods of geopolitical stress, crude grade differentials tend to behave counterintuitively. Rather than widening as one might expect, quality premiums for lighter, sweeter grades sometimes compress as supply uncertainty dominates all other pricing signals and buyers prioritise availability over optimisation. Asian refiners with flexible crude slates, capable of processing a wider range of gravity and sulphur specifications, hold a structural advantage in these environments because they can pivot more quickly to alternative origins without incurring major processing penalties.
The next major ASX story will hit our subscribers first
Pricing Architecture: Dubai Crude, Brent, and the OPEC+ Dimension
How Middle East Export Volumes Drive Global Benchmarks
For the majority of Middle East crude exports flowing to Asia, the relevant pricing reference is not Brent but the Dubai/Oman crude complex, a sour medium crude benchmark that more accurately reflects the quality and supply characteristics of Gulf production. The Exchange of Futures for Swaps (EFS) spread, which measures the differential between Brent futures and Dubai swaps, functions as a real-time indicator of relative demand intensity between the Atlantic Basin and Asian markets.
When the EFS narrows or inverts, it typically signals that Asian demand for Middle Eastern grades is strengthening relative to European demand for lighter Atlantic crudes, often prompting Saudi Aramco and other Gulf sellers to adjust OSPs to capture the premium. Tracking the EFS spread is therefore not merely an academic exercise; it directly informs the monthly pricing decisions that affect billions of dollars in contract value. Consequently, the crude oil price analysis for 2025 provides essential context for understanding how these benchmark movements translate into broader market signals.
OPEC+ production policy adds another layer of complexity. Saudi Arabia's role as the group's primary swing producer means that its export volume decisions involve a continuous balancing act between defending market share, maintaining price levels sufficient to fund domestic fiscal commitments, and managing the internal politics of a producer coalition with divergent national interests. In addition, the influence of OPEC on global oil markets in 2025 highlights how individual member states periodically produce above their allocated quotas when revenue pressure intensifies, creating quiet tension between collective discipline and individual maximisation that markets monitor closely.
The Long View: Can Middle East Crude Exports Maintain Global Dominance Through 2030?
Several structural forces will shape the trajectory of Middle East crude exports over the next five years. On the supply side, ADNOC's stated target of reaching 5 million barrels per day of production capacity and Saudi Aramco's sustained investment in maintaining its own capacity ceiling represent significant commitments to relevance in a potentially transitioning demand environment.
On the demand side, the key variable is the pace of energy transition across Asia. If major Asian importers begin to meaningfully reduce crude import growth before the end of the decade, the competitive dynamics among Middle East producers will intensify further, accelerating the downstream integration strategies that Saudi Aramco, ADNOC, and QatarEnergy have already begun pursuing. Competing supply growth from US shale, Brazilian pre-salt deepwater, and Guyana's rapidly expanding offshore production adds further pressure.
Furthermore, the trade war's impact on oil markets in 2025 has introduced an additional layer of demand-side uncertainty, as tariff regimes affecting major Asian economies have begun to alter the pace of industrial activity and, consequently, crude import growth projections. The geopolitical risk premium currently embedded in Middle East crude prices is, in the most direct sense, a reflection of unresolved uncertainty. Whether that premium proves temporary or becomes a permanent feature of how markets price Gulf supply will depend heavily on diplomatic outcomes that remain, as of mid-2026, genuinely difficult to forecast with confidence. What is clear is that the structural importance of Middle East crude exports to global energy markets is not diminishing, and the consequences of disruption remain as consequential as ever.
This article contains forward-looking analysis, scenario projections, and market commentary based on publicly available data and industry reporting current as of mid-2026. It does not constitute investment advice. Energy market conditions can change rapidly, and readers should conduct independent due diligence before making any financial or commercial decisions based on the information presented here.
Want To Stay Ahead of the Next Major Resource Discovery?
While geopolitical forces continue to reshape global energy flows, Discovery Alert's proprietary Discovery IQ model scans ASX announcements in real time, instantly identifying significant mineral discoveries and translating complex data into actionable investment insights — explore historic discovery returns on the Discovery Alert discoveries page to understand what early positioning can mean, then begin your 14-day free trial to secure a market-leading edge.