
June 12, 2026
When Freight Markets Whisper, Commodity Traders Should Listen
Dry bulk shipping rates rarely make headlines outside specialist circles, yet the signals embedded in daily index movements carry information that commodity traders, procurement desks, and industrial analysts treat as genuinely actionable intelligence. The Baltic Dry Index slips as Capesize shipping rates weaken, and the mechanics of bulk freight pricing operate upstream of physical commodity markets, meaning that rate shifts often precede visible changes in trade volumes, inventory levels, and ultimately, input costs across the aluminium, steel, and energy supply chains.
Understanding what a sustained directional move in the Baltic Dry Index actually means, and more specifically what it tells us when the deterioration originates almost entirely within the Capesize segment, requires more than a surface reading of the daily numbers.
When big ASX news breaks, our subscribers know first
What Is the Baltic Dry Index and Why Does It Matter to Global Trade?
Understanding the BDI as a Leading Economic Indicator
The Baltic Dry Index functions as a forward-looking barometer for global commodity demand, tracking freight costs across dry bulk shipping routes before physical goods reach their destinations. Unlike equity markets, which price expectations about future corporate earnings, the BDI reflects real-time supply and demand dynamics in raw material transportation. This distinction makes it a closely watched proxy for industrial activity, particularly in sectors dependent on the continuous movement of high-volume commodities.
The index is calculated daily by the Baltic Exchange in London, which aggregates rate data across multiple vessel classes and trade lanes. Because vessel bookings must be arranged weeks in advance of actual cargo loading, movements in the BDI can serve as an early warning system for shifts in industrial demand well before those shifts appear in official trade statistics or commodity price benchmarks.
How the BDI Is Constructed: The Three-Segment Weighting Framework
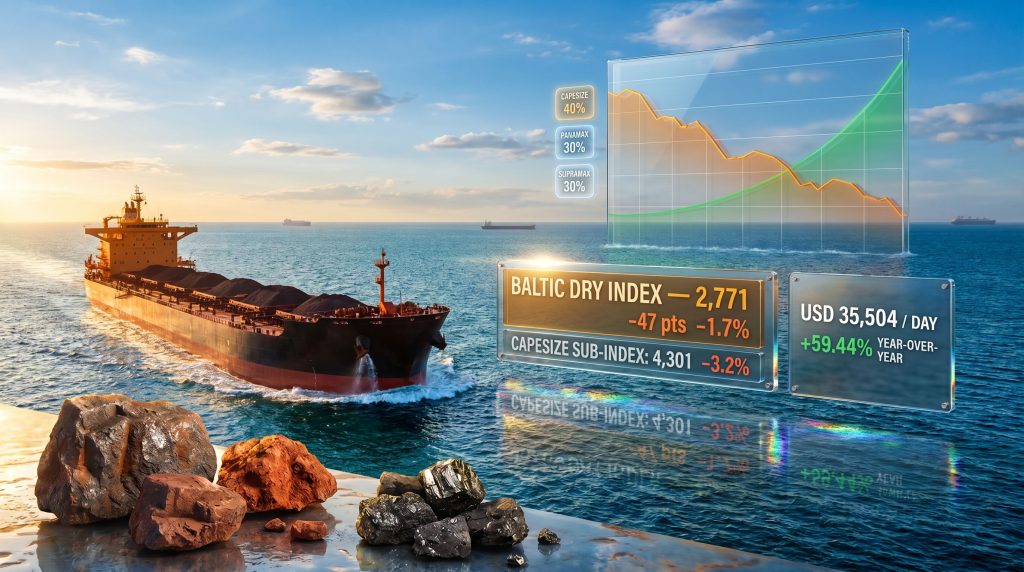
Key Insight: The Baltic Dry Index is not a single-vessel measure. It is a composite benchmark weighted across three vessel categories, each reflecting fundamentally different cargo volumes, trade routes, and commodity exposures.
| Vessel Segment | Index Weighting | Primary Cargo Types | Typical Trade Routes |
|---|---|---|---|
| Capesize | 40% | Iron ore, coal, bauxite | Brazil–China, Australia–Asia |
| Panamax | 30% | Grain, coal, minor bulks | US Gulf–Asia, Black Sea routes |
| Supramax | 30% | Fertilisers, steel, grain | Intra-Asia, Atlantic basin |
Because Capesize vessels carry the largest individual cargo volumes and account for 40% of the composite index, weakness in this segment produces an amplified effect on the headline BDI reading that is disproportionate to what Panamax or Supramax movements would generate at equivalent percentage declines.
Capesize vessels are purpose-built for high-volume, long-haul bulk trades. Their draft and beam dimensions exceed the lock dimensions of both the Panama and Suez Canals under loaded conditions, requiring navigation around either the Cape of Good Hope or Cape Horn. This geographic constraint concentrates their utility on a small number of very high-volume trade corridors, making their rate dynamics distinctly different from the more versatile smaller vessel classes.
What Triggered the Latest BDI Decline? Breaking Down the June 2026 Session
The Headline Numbers: A Snapshot of the June 10, 2026 Market Session
Market Snapshot, June 10, 2026: The Baltic Dry Index fell 47 points (-1.7%) to settle at 2,771 points, as Capesize segment weakness dragged the composite benchmark lower for the ninth consecutive session.
The broader index decline was almost entirely attributable to softening in the Capesize sub-index, which registered the sharpest single-session move among all vessel classes. The session extended what had become a sustained directional move that carries more analytical weight than routine daily volatility.
Capesize Rate Deterioration: The Core Driver
The numbers from the Capesize segment during this session were notably concentrated in their severity:
- The Capesize sub-index fell 140 points (-3.2%) to reach 4,301 points
- Average daily earnings for Capesize operators declined by USD 1,267, settling at USD 35,504 per day
- The percentage decline in the Capesize sub-index was nearly double the percentage decline in the headline composite, illustrating how concentrated the selling pressure was within the large-vessel segment
The divergence between Capesize weakness and broader index performance is itself a meaningful data point. When the headline index falls primarily because of one vessel class, it suggests the underlying demand pressure is cargo-specific or route-specific rather than a broad-based deterioration across all bulk commodity movements.
Contextualising the Decline Against Longer-Term Performance
Despite the nine-session losing streak, the BDI remained approximately 59.44% higher on a year-over-year basis as of June 10, 2026. That context transforms the analytical interpretation considerably. The pullback appears to represent a correction within a broader freight market recovery cycle rather than a structural breakdown in demand fundamentals.
The June 10 close also represented a fresh low since May 1, 2026, confirming the index had given back a meaningful portion of gains accumulated during the preceding weeks. For freight market participants, that level becomes a reference point for assessing whether the correction has run its course or whether further rate softness is likely.
Why Do Capesize Rates Drive Outsized BDI Volatility?
The Structural Role of Capesize Vessels in Global Commodity Supply Chains
Capesize vessels, typically ranging from 100,000 to 180,000 deadweight tonnes and above, are the primary workhorses of the iron ore and metallurgical coal trades, two of the world's highest-volume seaborne commodity flows. Their cargo base is deliberately narrow by design, with operators optimising vessel specifications around the loading and discharge infrastructure at major iron ore terminals in Western Australia, Brazil's Carajas region, and South Africa's Richards Bay.
The primary commodities transported by Capesize ships include:
- Iron ore sourced predominantly from Australia and Brazil, destined for Chinese and East Asian steel mills, with iron ore demand prospects playing a central role in Capesize rate cycles
- Thermal and coking coal exported from Australia, Indonesia, and South Africa to power generation and steel production markets across Asia
- Bauxite ore increasingly shipped from Guinea and Australia to alumina refineries across China and Southeast Asia, a trade flow that has grown substantially over the past decade
Why Capesize Demand Is Highly Concentrated and Cyclical
Capesize freight demand is heavily correlated with Chinese steel production cycles, port congestion at major loading terminals, and seasonal cargo scheduling by the world's largest mining companies. BHP, Rio Tinto, Vale, and Fortescue collectively control a large share of iron ore loading infrastructure, meaning their scheduling decisions and quarterly shipment programmes have an outsized influence on available Capesize tonnage across specific routes.
Unlike Panamax or Supramax vessels, which serve a more diversified cargo base and can substitute across multiple commodity types, Capesize operators have limited cargo substitution options. Furthermore, a slowdown in Chinese steel mill procurement, planned maintenance at key iron ore loading ports, or a seasonal lull in coal shipments can rapidly translate into rate softness across the Capesize fleet because excess vessels have few alternative employment options at comparable earnings levels.
Analytical Note: When Capesize rates soften without a corresponding deterioration in Panamax or Supramax rates, it often signals cargo-specific or route-specific demand cooling rather than a broad economic slowdown. This divergence pattern is one of the more useful diagnostic tools available to freight market analysts.
The Hidden Influence of Vessel Positioning and Ballast Days
One factor that receives less attention in mainstream commentary is the role of ballast voyages in Capesize rate dynamics. Because Capesize vessels operate on a small number of discrete trade routes, the time spent repositioning in ballast between discharge and the next load port represents genuine idle cost for owners. When the freight market softens, the concentration of ballast tonnage in specific geographic areas can create temporary rate pockets that exaggerate the apparent severity of a correction.
This means that a nine-session decline in the Capesize index does not necessarily imply nine consecutive sessions of deteriorating cargo demand. Part of the rate movement can reflect vessel positioning dynamics that self-correct once the fleet rebalances across loading regions.
What Does a Nine-Session BDI Decline Signal for Commodity Markets?
Reading the Sustained Directional Move: Correction or Trend Reversal?
A single-session BDI decline carries limited analytical weight. However, nine consecutive sessions of decline warrant closer examination of the underlying demand dynamics. Analysts examining multi-session BDI pullbacks typically focus on three diagnostic questions:
- Are Capesize fixture volumes declining, meaning fewer vessels are being booked on forward contracts, or are rates falling due to a temporary vessel oversupply on specific routes while actual cargo demand remains intact?
- Is the weakness concentrated on a single trade lane, such as the Brazil to China route, or is it broad-based across multiple corridors including Australia to Asia and Guinea to China?
- Are Panamax and Supramax indices diverging from Capesize performance, which would suggest cargo-specific rather than systemic weakness?
The answers to these questions determine whether a sustained BDI decline represents a temporary correction or the early stages of a more significant demand shift. Consequently, the China steel and iron ore market dynamic remains one of the most critical variables in this assessment.
Implications for Iron Ore, Coal, and Bauxite Trade Flows
Each of the three primary Capesize commodities carries distinct demand drivers that can generate rate softness independently:
- Iron ore: Softer Capesize rates can reflect reduced spot procurement by Chinese steel mills, potentially signalling near-term inventory drawdowns or production cuts at mill level. Chinese steel output decisions, which are sensitive to both domestic construction demand and export market conditions, are the single largest variable in iron ore shipping demand. In addition, the broader global iron ore trade impact of shifting trade policies can compound these dynamics.
- Thermal coal: Seasonal demand shifts, particularly during the Northern Hemisphere summer when natural gas and renewable generation can partially offset coal-fired power demand, can reduce coal shipment volumes on Capesize routes. This seasonal pattern is well-established and does not necessarily carry bearish longer-term implications.
- Bauxite: As a growing component of Capesize cargo demand, particularly on Guinea to China routes, any softening in alumina refinery procurement schedules can contribute to rate weakness. Guinea's emergence as the world's largest bauxite exporter has materially changed the geographic profile of Capesize demand, adding an Atlantic dimension that was less significant a decade ago.
The Year-Over-Year Context: Why the Pullback Doesn't Erase the Broader Recovery
| Metric | Value |
|---|---|
| BDI Level (June 10, 2026) | 2,771 points |
| BDI Session Decline | -47 points (-1.7%) |
| Capesize Sub-Index (June 10, 2026) | 4,301 points |
| Capesize Session Decline | -140 points (-3.2%) |
| Average Capesize Daily Earnings | USD 35,504 per day |
| Capesize Earnings Change (Session) | -USD 1,267 per day |
| Year-Over-Year BDI Performance | +59.44% |
| Consecutive Sessions of Decline | 9 sessions |
| Recent Low Since | May 1, 2026 |
At USD 35,504 per day, average Capesize earnings remain well above the cash breakeven levels that would signal genuine fleet financial stress for most modern vessel operators. Industry estimates typically place Capesize cash breakeven costs in the range of USD 8,000 to USD 14,000 per day depending on vessel age, debt structure, and fuel consumption profile. The current earnings level, even after a nine-session correction, implies operators remain profitable and have limited incentive to remove tonnage from the market.
How Do Freight Rate Movements Affect the Aluminium and Bauxite Supply Chain?
The Bauxite-to-Aluminium Logistics Chain and Capesize Dependency
The aluminium industry's dependence on Capesize shipping is structural and deep-rooted. Bauxite, the primary raw material in aluminium production, is one of the highest-volume dry bulk commodities transported aboard large bulk carriers. Approximately four to five tonnes of bauxite are required to produce one tonne of alumina, and roughly two tonnes of alumina are required to produce one tonne of primary aluminium.
That ratio means bauxite shipping volumes are enormous relative to the final metal output, concentrating freight cost sensitivity at the very base of the production chain. Furthermore, global bauxite production patterns directly shape which Capesize trade lanes carry the greatest volume and consequently face the most rate volatility.
Guinea, which has risen to become the world's largest bauxite exporter, ships the overwhelming majority of its output to Chinese alumina refineries via Capesize vessels on long-haul Atlantic-to-Pacific routes. This trade lane has grown dramatically in scale over the past decade, reshaping global Capesize demand patterns in ways that were not fully anticipated when Guinea's Boke region first began large-scale exports. Australia remains a significant bauxite exporter as well, with Capesize vessels servicing routes to refineries across Southeast Asia and China from ports including Weipa and Nhulunbuy.
What Freight Rate Softness Means for Bauxite Import Costs
When Capesize rates decline, the landed cost of bauxite at Chinese alumina refineries typically decreases, providing a marginal input cost benefit to alumina producers. The freight component in delivered bauxite pricing varies depending on the origin, but for long-haul Atlantic routes from Guinea, freight can represent a meaningful share of total landed cost given the distance involved.
Conversely, sustained Capesize rate weakness can also signal reduced procurement activity by refineries, pointing to alumina production adjustments or inventory management decisions upstream of the smelting stage. For aluminium producers, freight cost movements feed directly into the cost-of-production curve, influencing operating margins at smelters dependent on imported alumina. This creates a layered signalling dynamic where the same rate movement can simultaneously represent an input cost opportunity and a demand warning.
Freight as a Price Signal: What Traders and Procurement Teams Monitor
Shipping rate trends are increasingly integrated into commodity procurement strategies. Trading desks use BDI movements as a leading indicator for spot alumina and bauxite price negotiations, particularly when rate changes are sustained over multiple sessions rather than confined to single-day volatility. In this context, developments in bauxite and alumina markets are increasingly scrutinised alongside freight data to build a more complete picture of delivered cost dynamics.
Forward freight agreements, or FFAs, allow sophisticated market participants to hedge or speculate on future freight rate levels, creating a derivatives market that itself feeds information back into physical rate expectations. The existence of this market means that nine-session declines in the BDI are not simply passive observations but are actively traded positions with real capital at stake on both sides.
The next major ASX story will hit our subscribers first
Frequently Asked Questions: Baltic Dry Index and Capesize Freight Markets
What Is the Baltic Dry Index?
The Baltic Dry Index is a daily composite benchmark published by the Baltic Exchange in London that measures the cost of transporting dry bulk commodities, including iron ore, coal, grain, and bauxite, across major global shipping routes. It is weighted across Capesize (40%), Panamax (30%), and Supramax (30%) vessel segments.
Why Did the BDI Fall on June 10, 2026?
The BDI declined 47 points (-1.7%) to 2,771 points, driven primarily by a 3.2% drop in the Capesize sub-index to 4,301 points. Average daily earnings for Capesize vessels fell by USD 1,267 to USD 35,504 per day, reflecting softening demand for large bulk carriers on key commodity trade routes. Real-time commodity data platforms tracked the move closely as part of the broader freight market correction narrative.
Does a Falling BDI Mean the Global Economy Is Slowing Down?
Not necessarily. While the BDI is often referenced as a macroeconomic indicator, short-term declines can reflect vessel supply imbalances, seasonal cargo patterns, or route-specific demand cooling rather than broad economic deterioration. The June 2026 pullback occurred against a backdrop where the BDI remained approximately 59% above its year-ago level, which argues against a structural demand breakdown interpretation.
How Does the BDI Affect Bauxite and Aluminium Prices?
Capesize freight rates directly influence the landed cost of bauxite at alumina refineries. Lower freight rates reduce input costs for alumina producers, while sustained weakness may also signal reduced procurement activity, both of which can influence spot alumina pricing and aluminium production economics downstream.
What Is the Significance of Nine Consecutive Sessions of BDI Decline?
A nine-session losing streak indicates sustained directional pressure rather than random daily fluctuation. It typically prompts analysts to examine whether the weakness reflects structural demand softening, a vessel supply glut on specific routes, or a temporary correction following an extended period of elevated rates. The answer has materially different implications for freight market participants. However, as recent shipping market analysis has noted, the distinction between a positioning-driven pullback and genuine demand deterioration is rarely straightforward.
Key Takeaways: What the BDI Slip Tells Us About Dry Bulk Market Conditions
- The 1.7% decline in the BDI to 2,771 points on June 10, 2026, was driven almost entirely by Capesize segment weakness, with the sub-index falling 3.2% to 4,301 points
- Average Capesize daily earnings of USD 35,504 remain well above vessel breakeven levels, suggesting the market is correcting from recent highs rather than entering financially stressed territory
- The nine-session consecutive decline warrants monitoring but must be contextualised against a year-over-year BDI gain of nearly 60%, indicating the broader freight market recovery remains structurally intact
- For aluminium and bauxite supply chain participants, softer Capesize rates represent a potential short-term procurement opportunity in delivered raw material costs, while simultaneously serving as a signal to monitor upstream demand dynamics at Chinese alumina refineries
- Guinea's growing role as the world's largest bauxite exporter has added a significant Atlantic-to-Pacific Capesize trade dimension that now materially influences how freight rate movements intersect with aluminium production economics globally
- The BDI's Capesize weighting of 40% of the composite means that any sustained recovery in iron ore and bauxite shipment volumes will be the critical variable in determining whether the current pullback extends or reverses in the weeks ahead
This article contains forward-looking observations and market analysis for informational purposes only. Freight rate movements are subject to rapid change and should not be interpreted as financial or investment advice. Past rate performance is not indicative of future outcomes.
Want to Stay Ahead of the Next Major Mineral Discovery on the ASX?
While freight markets signal shifts in iron ore, bauxite, and coal demand, the real investment opportunity often lies in identifying the companies making significant new mineral discoveries before the broader market reacts. Discovery Alert's proprietary Discovery IQ model delivers real-time alerts on significant ASX mineral discoveries — transforming complex mineral data into clear, actionable insights for both short-term traders and long-term investors. Explore how historic discoveries have generated substantial returns and begin your 14-day free trial at Discovery Alert to position yourself ahead of the market.