
June 30, 2026
Middle East uncertainty impact on trading markets has become a critical factor that professional portfolio managers must navigate with sophisticated frameworks that account for complex transmission mechanisms across global financial markets. The interconnected nature of modern financial systems means that geopolitical disruptions originating from this strategically important region can create cascading effects through energy markets, currency systems, and international supply chains within hours of initial events. Furthermore, the evolving nature of market infrastructure, algorithmic trading systems, and cross-border capital flows has fundamentally altered how regional instability propagates through global investment markets.
What Are the Primary Transmission Channels of Middle East Geopolitical Risk?
Energy Supply Chain Vulnerabilities
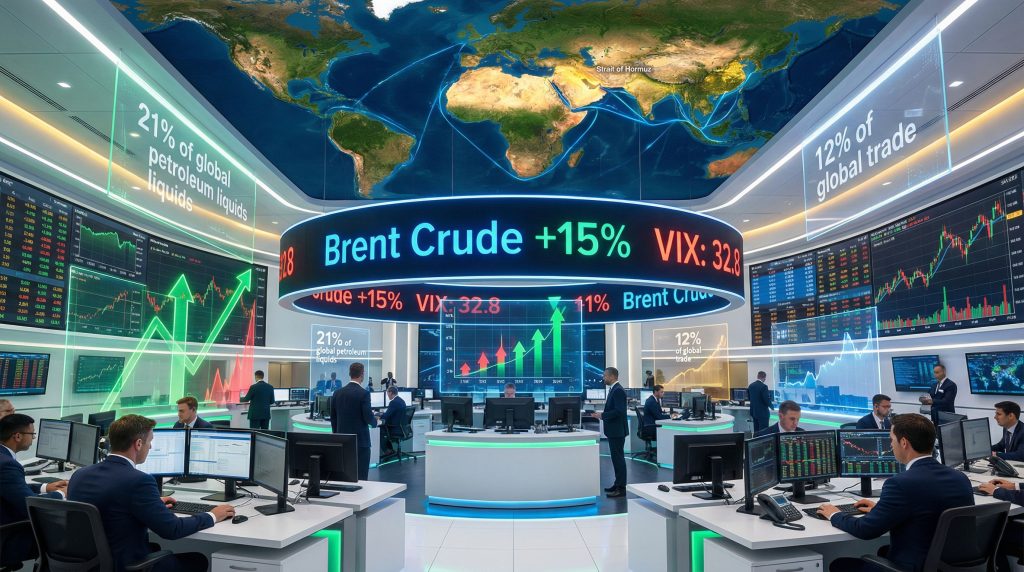
Critical maritime chokepoints represent the most immediate transmission channel for regional instability. The Strait of Hormuz processes approximately 21% of global petroleum liquids according to U.S. Energy Information Administration data, making it a critical infrastructure point for global energy security. When tensions escalate, this concentration creates immediate price discovery effects across energy futures markets.
Key Chokepoint Analysis:
• Strait of Hormuz controls one-third of all seaborne traded oil
• Red Sea shipping lanes affect 12% of global trade volumes
• Natural gas pipeline networks span multiple conflict-sensitive territories
• Strategic petroleum reserves serve as buffer mechanisms during disruptions
Recent market data demonstrates these vulnerabilities in practical terms. Red Sea disruptions have forced vessel diversions around the Cape of Good Hope, adding 10-14 days to transit times and increasing fuel costs by approximately 20-30%. These route modifications create immediate cost pressures that propagate through supply chains.
The current trading environment reflects these concerns with Brent crude maintaining levels above $100 per barrel due to ongoing supply disruption fears. This pricing represents elevated risk premiums compared to pre-crisis baseline levels. Additionally, understanding the broader implications of US economy tariffs and inflation helps traders comprehend how regional instability combines with domestic policy pressures.
Strategic petroleum reserve mechanisms provide temporary buffer capacity during acute disruption phases. The U.S. Strategic Petroleum Reserve contains approximately 365 million barrels, with drawdown announcements typically providing 2-5% price relief within 24-48 hours of official communication.
Financial Market Contagion Mechanisms
Currency markets serve as primary transmission channels through safe-haven demand patterns and petrodollar recycling mechanisms. Current market conditions demonstrate this dynamic with the U.S. dollar maintaining elevated levels while precious metals experience mixed performance, reflecting complex risk-off flow patterns.
Safe-Haven Flow Analysis:
• USD strengthening occurs through interest rate differential expectations
• Swiss Franc and Japanese Yen exhibit appreciation during acute uncertainty phases
• Emerging market currencies weaken based on oil import dependency ratios
• Precious metals face headwinds from opportunity cost increases
The complexity of current market transmission is evident in recent Federal Reserve policy expectations. Markets now assign approximately 40-50% probability of a Fed rate hike by September, driven by oil-driven inflation concerns. This expectation creates currency volatility through interest rate differential mechanisms.
Credit spread transmission represents another critical contagion channel. Emerging market credit default swap spreads typically widen 75-150 basis points during acute geopolitical crises. Corporate bond markets experience similar effects, particularly for companies with significant regional exposure.
Moreover, investors seeking protection against inflationary pressures often turn to gold as an inflation hedge during periods of heightened uncertainty.
Supply Chain Disruption Multipliers
Manufacturing sector exposure extends beyond direct energy costs through complex supply chain interdependencies. Just-in-time inventory models create amplification effects when input cost volatility exceeds normal parameters. Historical analysis demonstrates that 3-6 months of unexpected input cost inflation forces inventory rebuilding.
Current copper price movements illustrate these multiplier effects. Despite recovering from recent four-month lows around $5.2463, copper has maintained range-bound trading near $5.5000, reflecting demand-side contagion from reduced manufacturing activity expectations.
Manufacturing Impact Mechanisms:
• Input cost pass-through lags span 45-90 days for most industries
• Corporate margin compression occurs during adjustment periods
• Inventory rebuilding creates demand volatility cycles
• Alternative sourcing arrangements require 6-12 month establishment periods
Air freight capacity constraints represent often-overlooked transmission channels. Regional hub airports handle approximately 15-20% of global air cargo capacity. Disruptions force cargo rerouting through less efficient alternatives, increasing per-unit transportation costs by 30-50% during acute phases.
When big ASX news breaks, our subscribers know first
Which Asset Classes Experience the Greatest Volatility During Middle East Crises?
Energy Sector Performance Dynamics
Historical analysis reveals distinct patterns in energy sector responses, with performance magnitude correlating directly to supply disruption scope and duration. The relationship between crude oil price movements and energy equity performance demonstrates clear leverage effects.
Historical Energy Market Response Patterns:
| Crisis Event | Oil Price Impact | Duration | Energy Equity Response |
|---|---|---|---|
| 1973 Oil Embargo | +300% increase | 6 months | +180% major oils |
| 1979 Iranian Revolution | +150% increase | 12 months | Mixed performance |
| 1990 Gulf War | +100% spike | 3 months | +65% integrated oils |
| 2019 Saudi Attacks | +15% temporary | 1-3 weeks | +12% sector average |
The 1973 Oil Embargo represents the most severe supply disruption in modern energy market history. Brent crude prices surged from approximately $3 per barrel to $12 per barrel over six months. This extreme supply shock created corresponding energy equity gains of 180% for major integrated oil companies.
Recent events demonstrate improved market efficiency and supply chain resilience. The 2019 facility attacks temporarily removed 5.7 million barrels per day but generated only 15% crude price increases and 12% energy sector equity gains.
Energy Stock Beta Relationships:
• Integrated energy companies exhibit 0.6-0.8 beta to crude oil prices
• Pure upstream producers show higher 1.0-1.3 beta ratios
• Midstream and downstream operations demonstrate 0.3-0.5 beta due to margin stability
• Earnings accretion averages 2-4% per $10 Brent crude increase
Consequently, tracking Saudi Arabia exploration impact provides valuable insights into supply-side dynamics affecting global energy markets.
Currency Market Safe-Haven Flows
Currency market responses demonstrate complex safe-haven flow patterns that extend beyond traditional flight-to-quality dynamics. The current environment illustrates this complexity with the U.S. dollar maintaining strength while precious metals experience weekly declines.
Current Currency Market Dynamics:
• USD strength reflects Federal Reserve policy tightening expectations
• AUD weakness at $0.6872 demonstrates commodity currency vulnerability
• Weekly declines in precious metals despite 2% daily rebounds indicate opportunity cost concerns
• Emerging market currencies face dual pressure from energy costs and capital outflows
The Australian dollar's decline to two-month lows illustrates currency transmission mechanisms. Australia's economy faces dual exposure through higher oil import costs and reduced demand for commodity exports as global growth expectations moderate.
Swiss Franc and Japanese Yen performance typically shows 3-8% appreciation against major currencies within 2-4 weeks of initial events. However, current conditions suggest Federal Reserve policy response expectations are overriding traditional safe-haven flows.
Safe-Haven Flow Hierarchy:
• U.S. Treasury securities receive primary safe-haven flows
• USD cash positions benefit from policy tightening expectations
• Precious metals face headwinds from opportunity cost increases
• Low-yielding currencies provide portfolio diversification benefits
Equity Sector Rotation Patterns
Equity market responses demonstrate predictable sector rotation patterns reflecting both direct operational impacts and investor risk preference adjustments. The current environment shows the MSCI Asia-Pacific index declining 0.7% and positioning for a fourth consecutive weekly drop.
Technology sector weakness has driven the Nasdaq 100 into correction territory, declining nearly 11% from recent peaks. This underperformance reflects higher discount rates applied to future earnings during stagflationary scenarios.
Sector Performance Patterns:
• Defense contractors typically outperform by 8-15% during escalation phases
• Airlines and transportation underperform by 5-12% due to fuel cost exposure
• Regional banks face 3-7% underperformance through energy lending exposure
• Technology sectors experience 2-5% multiple compression during uncertainty periods
European equity markets demonstrate particular sensitivity through energy cost transmission. The DAX 40 continues pressure toward March lows at 21,864, with support levels between 22,350-22,370 representing technical resistance points.
Financial sector rotation reflects complex dynamics during geopolitical uncertainty. While rising interest rate expectations typically benefit bank net interest margins, energy sector lending exposure creates offsetting pressures. Understanding how tariffs' impact on markets adds another layer to these complex dynamics.
How Do Traders Adapt Their Strategies During Middle East Uncertainty?
Risk Management Framework Adjustments
Professional traders implement systematic risk management modifications during elevated uncertainty periods, recognising that normal market relationships become unreliable during stress periods. These adjustments extend beyond simple position sizing to encompass correlation structure changes and liquidity considerations.
Volatility-Based Position Sizing Modifications:
• Leverage ratios reduce by 30-50% during uncertainty spikes
• Dynamic stop-loss levels adjust based on VIX readings above 25-30
• Portfolio diversification emphasises uncorrelated asset classes
• Cash reserve increases to 15-20% for opportunistic positioning
The current environment with global yields moving higher reflects trader recognition of stagflationary dynamics. When markets assign 40-50% probability of Federal Reserve rate hikes by September, professional traders adjust duration exposure accordingly.
Dynamic hedging strategies become essential as correlation structures shift toward unity during stress episodes. Traditional portfolio diversification benefits diminish when asset classes move in lockstep, requiring active hedge ratio adjustments.
Advanced Risk Management Techniques:
• Correlation monitoring systems track real-time relationship changes
• Tail risk hedging through options strategies increases to 3-5% of portfolio
• Sector-neutral positioning reduces directional exposure during uncertainty
• Currency hedging ratios increase for international equity positions
Sector Rotation and Hedging Strategies
Tactical sector allocation becomes crucial as traditional sector relationships experience temporary disruptions. The current market demonstrates these dynamics with energy sectors maintaining relative strength despite broader market weakness.
Pairs Trading Strategies:
• Long energy/short consumer discretionary pairs capture margin transfer effects
• Long defense contractors/short airlines exploit operational impact differences
• Long utilities/short technology reflects defensive rotation preferences
• Long commodities/short long-duration bonds hedges inflation expectations
Precious metals allocation strategies require nuanced approaches during current market conditions. While these metals provide traditional inflation hedging benefits, opportunity cost considerations from rising real yields create headwinds. Professional traders often implement 5-8% exposure through futures or mining equities.
Currency hedging strategies become particularly important for international equity positions. The Australian dollar's decline to $0.6872 demonstrates how commodity currency exposure can amplify portfolio volatility during geopolitical stress periods.
Technical Analysis Adaptations
Technical analysis frameworks require modification as volatility regimes shift and traditional support/resistance levels become less reliable. Price action patterns exhibit higher frequency oscillations and larger daily ranges that necessitate analysis technique adjustments.
Technical Analysis Modifications:
• Price channel analysis expands to accommodate 150-200% of normal volatility
• Momentum indicators require recalibration for faster market movements
• Support and resistance levels adjust for gap trading scenarios
• Volume analysis emphasis increases during news-driven trading sessions
Current DAX 40 technical analysis illustrates these adaptation requirements. With the index attempting to hold above March lows at 21,864, traders must account for potential gap openings and extended daily ranges.
Copper's range-bound trading near $5.5000 despite recovering from four-month lows at $5.2463 demonstrates how technical consolidation patterns develop during uncertainty periods. Traders monitor $5.5935 as key resistance.
What Economic Indicators Signal Escalating Middle East Impact?
Leading Economic Indicators
Economic indicators provide early warning signals for escalating Middle East uncertainty impact on trading through measurement of supply chain stress, consumer behaviour changes, and business investment modifications. These metrics often precede financial market reactions by several weeks.
Critical Monitoring Dashboard:
• Baltic Dry Index movements indicating shipping route disruption
• Copper-to-gold ratio reflecting growth versus safety preferences
• High-frequency GDP nowcasting incorporating energy price impacts
• Consumer confidence surveys in major oil-importing economies
The Baltic Dry Index serves as a particularly sensitive indicator during uncertainty periods. Dry bulk shipping costs typically increase 20-40% during acute supply route disruptions as vessel rerouting extends journey times. These increases often precede broader supply chain cost inflation by 4-8 weeks.
Consumer confidence measurements in oil-importing nations provide crucial insight into demand-side transmission effects. When gasoline prices increase due to crude oil elevation, consumer discretionary spending typically declines within 60-90 days.
High-Frequency Economic Tracking:
• Weekly petroleum inventory changes signal supply chain adaptation
• Monthly purchasing manager indices capture business sentiment shifts
• Quarterly corporate earnings guidance modifications reflect operational impacts
• Real-time credit card spending data indicates consumer behaviour changes
Financial Market Stress Indicators
Financial market stress indicators provide real-time measurement of uncertainty transmission through credit markets, funding costs, and cross-border capital flows. These metrics often signal escalation phases before they become apparent in equity markets.
Stress Indicator Framework:
• Credit default swap spreads for regional sovereign debt
• Cross-currency basis swap costs indicating funding market stress
• Term structure of volatility across multiple asset classes
• Corporate bond issuance calendar modifications and pricing changes
Emerging market credit default swap spreads typically widen 75-150 basis points during acute episodes, reflecting increased sovereign risk perceptions. These widening patterns often precede equity market declines by 1-3 weeks.
Cross-currency basis swap costs provide insight into international funding market stress levels. During previous regional attacks, USD/EUR and USD/JPY basis swaps widened to 50+ basis points, indicating reduced liquidity in currency hedging markets.
Corporate Credit Market Signals:
• Investment grade credit spreads widen 25-75 basis points during uncertainty phases
• High yield credit markets experience 100-300 basis point spread expansion
• Corporate bond issuance calendars typically reduce by 30-50% during acute phases
• Bank lending standards tighten particularly for energy sector exposure
Central Bank Policy Response Signals
Central bank communication patterns and policy response mechanisms provide crucial signals about escalating impacts. Policy maker reactions often determine whether geopolitical events create temporary market disruption or sustained economic impacts.
Current Federal Reserve policy expectations demonstrate this dynamic with markets pricing 40-50% probability of rate hikes by September due to oil-driven inflation concerns. This expectation reflects central banker communication emphasising inflation targeting priorities.
Central Bank Response Indicators:
• Emergency meeting frequency among major central banking systems
• Strategic petroleum reserve coordination between importing nations
• Forward guidance modifications regarding inflation targeting priorities
• Currency swap line activation between central banks during funding stress
International cooperation mechanisms often signal perceived crisis severity. When central banks activate existing currency swap lines, it indicates recognition of potential systemic risks requiring coordinated policy response.
Strategic petroleum reserve policy modifications provide insight into government assessment of supply disruption duration and severity. Coordinated releases among major importing nations typically occur when officials expect extended supply chain disruption lasting 3-6 months or longer.
Which Trading Instruments Offer the Best Middle East Exposure?
Direct Commodity Exposure Options
Direct commodity exposure through futures contracts provides the most immediate mechanism for trading uncertainty impacts, though instrument selection requires careful consideration of contract specifications and liquidity characteristics.
Primary Futures Contract Analysis:
• WTI and Brent crude oil futures offer direct energy price exposure
• Natural gas contracts capture European supply disruption scenarios
• Precious metals futures provide traditional safe-haven positioning
• Agricultural commodity futures reflect fertiliser supply chain impacts
Brent crude futures currently trading above $100 per barrel represent the most direct exposure, with contract specifications providing 1,000 barrel position sizes. Daily margin requirements typically range 5-10% of contract value during normal volatility periods.
Natural gas futures provide European-specific exposure through pipeline supply concerns. Dutch Title Transfer Facility (TTF) natural gas futures capture European supply vulnerability more effectively than U.S. Henry Hub contracts.
Precious Metals Positioning Strategies:
• Futures contracts offer 100 troy ounce position sizing flexibility
• Silver futures provide higher volatility alternative with 5,000 ounce contracts
• Platinum and palladium exposure through industrial demand linkages
• Mining equity exposure through ETFs for leveraged positioning
Agricultural commodity exposure often provides overlooked positioning opportunities. Fertiliser supply chains create secondary impacts on wheat, corn, and soybean production costs that manifest 3-6 months after initial geopolitical events.
Equity ETF and Index Strategies
Exchange-traded funds provide diversified exposure through sector-specific and geographic targeting strategies. These instruments offer reduced single-stock risk while maintaining thematic positioning aligned with uncertainty transmission mechanisms.
Regional and Thematic ETF Options:
• Regional ETFs for direct geographic exposure
• Energy sector ETFs capturing oil and gas company performance
• Defence and aerospace ETFs positioned for conflict beneficiary effects
• Inverse ETFs providing hedge instruments for broader market exposure
Energy sector ETFs demonstrate mixed performance during current uncertainty, reflecting complex dynamics between supply concerns and demand weakening fears. The Energy Select Sector SPDR Fund and similar instruments provide diversified exposure to integrated oil companies.
Defence contractor ETFs offer positioning for extended uncertainty scenarios where increased military spending creates sectoral outperformance. These instruments typically contain aerospace manufacturers with 2-4 year contract cycles.
Geographic Diversification Strategies:
• Developed market ETFs with energy self-sufficiency characteristics
• Emerging market inverse positioning for oil import dependency exposure
• Asian equity ETFs with selective country exposure modifications
• European utility ETFs capturing energy transition acceleration benefits
Currency and Fixed Income Instruments
Currency markets provide sophisticated instruments for positioning through both direct currency pair trading and fixed income strategies that capture interest rate differential changes during stress periods.
Currency Pair Strategies:
• USD/CAD and USD/NOK pairs for petrocurrency correlation exposure
• AUD/USD positioning for commodity currency vulnerability trading
• EUR/USD reflecting European energy import sensitivity
• Safe-haven currency pairs (USD/JPY, USD/CHF) for defensive positioning
Current AUD/USD weakness at $0.6872 illustrates currency pair effectiveness for uncertainty positioning. Australian dollar exposure to both energy import costs and reduced commodity export demand creates amplified sensitivity during geopolitical stress periods.
Fixed income strategies require careful duration and credit quality considerations. Treasury futures provide safe-haven exposure while maintaining liquidity advantages over physical bond positions.
Fixed Income Positioning Options:
• U.S. Treasury futures for safe-haven duration exposure
• Emerging market bond ETFs for risk-off positioning strategies
• Inflation-protected securities for energy price pass-through hedging
• Corporate bond sector allocation modifications based on energy exposure
Emerging market bond funds typically experience 2-4% of assets under management in redemptions within 5-10 trading days of major uncertainty events, creating short-term price dislocations.
How Long Do Middle East Uncertainty Effects Typically Last?
Historical Duration Analysis
Regional uncertainty effects demonstrate predictable duration patterns across multiple market cycles, with impact phases progressing through distinct stages characterised by different volatility levels and recovery mechanisms.
Uncertainty Impact Timeline Framework:
• Acute phase (0-30 days): Maximum volatility and price dislocations across asset classes
• Adaptation phase (1-6 months): Market adjustment to new risk premium levels
• Normalisation phase (6-18 months): Return to fundamental pricing relationships
• Structural assessment (18+ months): Permanent supply chain and policy modifications
The acute phase represents peak trading opportunity periods with daily volatility often reaching 150-300% of normal levels. Professional traders typically generate 60-80% of uncertainty-related profits during this initial 30-day window.
Historical analysis reveals that energy price normalisation typically leads broader market recovery patterns. Recent attacks demonstrated this sequence with crude oil prices returning to pre-event levels within 3-4 weeks, followed by equity market normalisation over 6-8 weeks.
Recovery Sequence Patterns:
• Energy futures markets stabilise first as supply certainty returns
• Currency markets normalise as central bank policy expectations adjust
• Equity sectors recover based on fundamental operational impact assessment
• Credit markets require longest normalisation due to risk assessment lag
Market Recovery Patterns
Market recovery follows identifiable patterns that enable professional traders to anticipate sector rotation timing and position for normalisation phases before they become apparent to broader market participants.
Shipping route alternatives typically establish within 3-6 months of initial disruption. Current Red Sea disruption shows vessel rerouting adding 10-14 days to journey times, but shipping companies typically optimise new routes within 60-90 days.
Consumer Confidence Restoration Timeline:
• Gasoline price stability leads consumer sentiment recovery by 2-4 weeks
• Discretionary spending patterns normalise within 60-120 days of energy price stabilisation
• Business investment confidence returns 3-6 months after supply chain clarity
• International tourist flows resume 6-12 months after acute uncertainty resolution
Investment capital flows demonstrate predictable return patterns with portfolio managers typically reducing geopolitical risk premiums 12-18 months after event resolution. During this normalisation phase, previously underweight regional exposure often experiences rebalancing flows.
Currency market normalisation follows Federal Reserve and European Central Bank policy guidance closely. Current market pricing reflects ongoing uncertainty about policy response duration, but historical precedent suggests central bank communication provides clarity within 90-180 days.
Long-Term Structural Changes
Extended uncertainty periods create permanent structural changes in supply chain arrangements, energy infrastructure development, and government policy frameworks that generate long-term investment themes.
Permanent Infrastructure Modifications:
• Accelerated renewable energy investment programs during supply disruption periods
• Strategic reserve capacity increases by oil-importing nations
• Alternative shipping route infrastructure development
• Regional supply chain localisation initiatives reducing dependency
Energy transition acceleration represents one of the most significant long-term structural impacts. European renewable energy investment typically increases 25-40% during extended supply disruption periods, creating permanent demand shifts.
Government strategic reserve policy modifications often persist long after immediate uncertainty resolution. Strategic reserve capacity discussions reflect ongoing policy reassessment that could result in permanent capacity increases.
International alliance formation patterns triggered by uncertainty create lasting geopolitical relationships that influence trade flows for 5-10+ years beyond initial events. Additionally, accessing comprehensive gold price forecast insights helps traders understand how precious metals respond to these long-term structural changes.
The next major ASX story will hit our subscribers first
What Are the Key Risk Factors Traders Should Monitor?
Escalation Trigger Events
Professional traders monitor specific escalation trigger events that historically correlate with sustained market impact rather than temporary volatility spikes. These triggers often provide 24-72 hours advance warning of significant price movements.
Critical Military and Diplomatic Monitoring Framework:
• Military asset positioning changes in Persian Gulf region waters
• Diplomatic communication breakdown indicators between major powers
• Civilian infrastructure targeting that expands conflict operational scope
• Regional ally involvement announcements broadening conflict participation
Current monitoring focuses on recent deadline extensions for potential action, which provide temporary de-escalation but maintain underlying uncertainty. This type of deadline management often creates trading opportunities through volatility compression followed by potential expansion.
Intelligence regarding troop deployment requires careful analysis as these often represent negotiation positioning rather than immediate escalation indicators. Professional traders typically monitor multiple confirmation sources before adjusting position sizing.
Economic Warfare Escalation Signals:
• Sanctions regime expansion targeting energy infrastructure
• International banking system payment restrictions
• Sovereign wealth fund asset freezing announcements
• Trade route blockade implementation or threats
Economic Spillover Thresholds
Specific economic thresholds provide quantitative triggers for escalating impact, enabling systematic trading strategy adjustments based on measurable criteria rather than subjective risk assessment.
Oil Price Threshold Analysis:
• $100+ Brent crude triggers strategic petroleum reserve release discussions
• $120+ sustained levels historically prompt coordinated emergency meetings
• $150+ pricing creates recession probability increases above 60% in major economies
• $200+ crisis levels trigger fundamental economic policy reassessment globally
Current Brent crude trading above $100 per barrel represents the first threshold activation, with market participants monitoring for sustained price elevation. Historical precedent suggests releases provide $5-15 per barrel temporary relief lasting 4-12 weeks.
Shipping insurance rate monitoring provides early indicators of route abandonment risks. When insurance premiums for Persian Gulf tanker voyages increase above 300% of baseline levels, commercial operators typically begin route diversification.
Consumer Economic Impact Thresholds:
• Gasoline price increases above $0.50 per gallon (30 days) trigger consumer spending shifts
• Heating oil cost elevation exceeding 25% affects regional consumer confidence
• Natural gas pricing above $8/MMBtu prompts industrial energy switching behaviours
• Electricity rate increases over 15% create business operational cost reassessment
Policy Response Catalysts
Government and central bank policy responses often determine whether uncertainty creates temporary market disruption or sustained economic impacts. Monitoring policy response catalysts enables professional traders to anticipate regime changes.
Central Bank Emergency Response Indicators:
• Unscheduled Federal Open Market Committee meeting announcements
• European Central Bank emergency session communications
• Bank of Japan intervention threshold discussions for currency stability
• People's Bank of China reserve requirement ratio emergency modifications
Current Federal Reserve policy expectations with 40-50% probability of September rate hikes demonstrate how geopolitical uncertainty intersects with domestic monetary policy objectives. These probability assessments change rapidly based on inflation data releases.
International cooperation mechanisms provide insight into perceived crisis severity. When finance ministers schedule emergency consultations or central banks activate existing currency swap lines, it indicates official sector recognition of potential systemic risks.
Government Energy Policy Catalysts:
• Strategic petroleum reserve drawdown authorisation announcements
• Emergency energy subsidy program implementations for consumers
• Renewable energy project acceleration through emergency funding
• International energy supply diversification agreement negotiations
Strategic alliance formation announcements often signal long-term geopolitical relationship changes that affect trade flows for years beyond immediate uncertainty resolution. These alliance modifications create secondary investment opportunities.
How Should Portfolio Managers Position for Extended Middle East Uncertainty?
Strategic Asset Allocation Adjustments
Portfolio managers must implement systematic allocation modifications that account for correlation structure changes, volatility regime shifts, and sector rotation patterns during extended uncertainty periods. These adjustments require balancing defensive positioning with opportunistic exposure.
Defensive Portfolio Construction Framework:
• Energy sector allocation increases to 8-12% from typical 4-6% baseline weightings
• Precious metals exposure raised to 5-8% for tail risk protection
• Cash reserve maintenance at 15-20% for opportunistic deployment capabilities
• International diversification emphasis on energy self-sufficient economies
Current market conditions with elevated energy prices and currency volatility require dynamic allocation adjustments. Portfolio managers typically reduce growth equity exposure by 10-20% while increasing defensive sector weightings including utilities, consumer staples, and healthcare.
Technology sector allocation requires particular attention during uncertainty periods as elevated discount rates compress growth stock valuations. The Nasdaq 100's 11% decline from recent peaks illustrates this dynamic, suggesting reduced technology allocation until uncertainty resolution.
Alternative Investment Integration:
• Commodity exposure through futures and ETFs increases to 8-15% of portfolio
• Real estate investment trust allocation focuses on energy infrastructure
• Private equity commitments emphasise energy transition and defence technologies
• Hedge fund allocation targets volatility arbitrage and event-driven strategies
Real estate investment considerations shift toward energy infrastructure and storage facilities that benefit from supply chain diversification. Master limited partnerships in pipeline and storage infrastructure often provide attractive yields during uncertainty periods.
Risk Parity and Volatility Management
Risk parity frameworks require significant modification during Middle East uncertainty impact on trading scenarios as asset class correlations converge toward unity during stress periods. Traditional diversification benefits diminish, requiring alternative risk management approaches.
Dynamic Risk Parity Adjustments:
• Volatility targeting mechanisms reduce leverage during VIX spikes above 30
• Correlation monitoring systems trigger rebalancing when cross-asset correlations exceed 0.7
• Tactical overlays hedge tail risk through options strategies
• Geographic diversification emphasises regions with energy security
Current elevated volatility requires systematic leverage reduction in risk parity strategies. When 60-day realised volatility across major asset classes exceeds 200% of historical averages, professional managers typically reduce portfolio leverage by 30-50%.
Options overlay strategies become essential during uncertainty periods for tail risk protection. Put spread structures on broad market indices typically cost 1-3% annually but provide significant downside protection during acute uncertainty phases.
Alternative Beta Sources:
• Infrastructure debt provides stable returns uncorrelated with equity markets
• Catastrophe bonds offer diversification benefits during geopolitical uncertainty
• Private credit allocation increases focus on energy sector opportunities
• Currency overlay strategies capture safe-haven flow premiums
According to external market analysis from Reuters, equity markets continue facing pressure from regional uncertainty, whilst Investopedia suggests that some investors believe maintaining disciplined positioning rather than reactive adjustments proves more effective during geopolitical uncertainty.
Long-Term Thematic Positioning
Extended uncertainty periods create structural investment themes that persist beyond immediate crisis resolution. Portfolio managers must identify these themes early to capture long-term alpha generation opportunities.
Energy Transition Acceleration Themes:
• European renewable energy infrastructure receives increased investment flows
• Battery storage technology development accelerates through government support
• Nuclear power renaissance driven by energy security considerations
• Carbon capture and storage technology gains policy support
European energy transition investment typically increases 25-40% during extended supply disruption periods. This acceleration creates permanent demand shifts favouring renewable energy equipment manufacturers, battery technology companies, and smart grid infrastructure providers.
Defense technology represents another persistent theme during uncertainty periods. Aerospace and defense contractors benefit from increased government spending that often continues 3-5 years beyond initial uncertainty triggers as nations reassess security infrastructure requirements.
Supply Chain Resilience Investment Themes:
• Regional manufacturing capacity development reduces import dependencies
• Strategic mineral mining operations gain government support and funding
• Transportation infrastructure alternatives receive accelerated development
• Technology solutions for supply chain visibility and management
Furthermore, portfolio managers recognising these structural shifts position accordingly for multi-year investment cycles that extend well beyond immediate uncertainty resolution, creating sustainable alpha generation opportunities aligned with permanent economic relationship changes.
Looking to Capitalise on Market Uncertainty?
Discovery Alert's proprietary Discovery IQ model provides immediate notifications on significant ASX mineral discoveries, helping investors identify opportunities that often emerge during periods of global uncertainty when traditional markets face headwinds. Understanding why historic discoveries can generate substantial returns enables sophisticated investors to position portfolios for potential outperformance during challenging market conditions. Begin your 14-day free trial today to gain access to real-time discovery alerts powered by advanced AI technology that scans daily ASX announcements instantly.