June 22, 2026
When a Single Waterway Rewrites the Rules of Global Energy
Every commodity market carries within it a hidden architecture of vulnerabilities, invisible during calm periods and devastating when exposed. For decades, energy analysts have flagged the Strait of Hormuz as the single most consequential chokepoint in the global fuel trade. What was once theoretical risk crystallised into market reality from early March 2026, when the Mideast crisis disrupts global LNG markets dynamic shifted from a geopolitical warning to a lived supply emergency affecting hundreds of millions of energy consumers across Asia and Europe.
Understanding why this disruption carries such structural weight requires looking beyond the immediate price charts and into the physical geography, infrastructure dependencies, and market mechanics that govern how liquefied natural gas moves around the planet.
When big ASX news breaks, our subscribers know first
The Geography of Vulnerability: Why Hormuz Is Irreplaceable
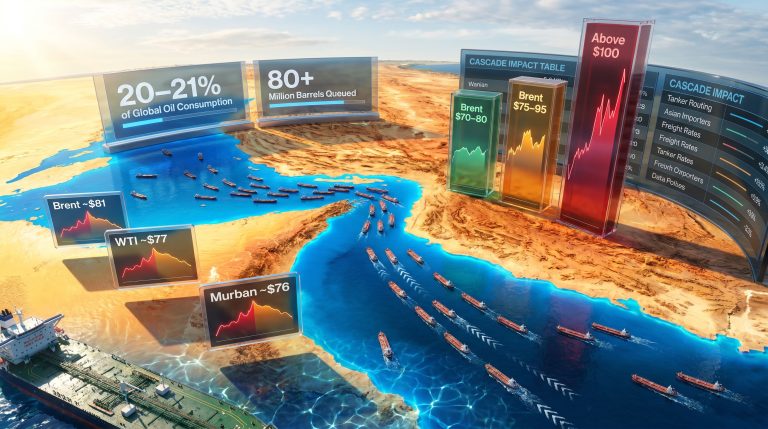
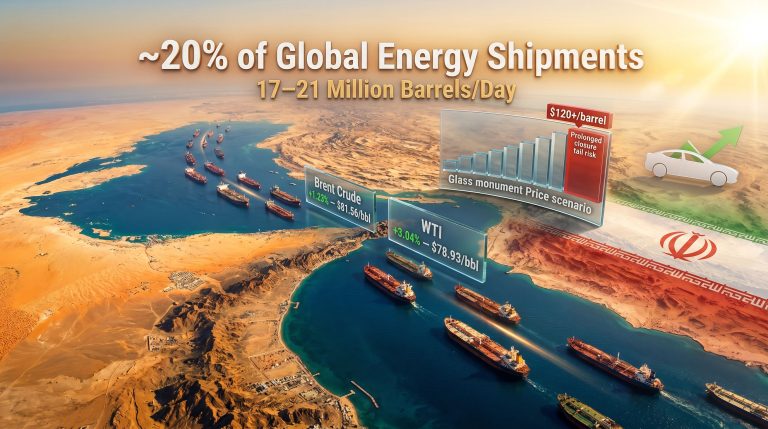
The Strait of Hormuz is a narrow maritime corridor connecting the Persian Gulf to the Gulf of Oman, stretching just 33 kilometres at its narrowest navigable point. Through this passage flows roughly one-fifth of all globally traded LNG under normal operating conditions, sourced primarily from Qatar, the United Arab Emirates, and Oman.
Qatar alone holds the distinction of being among the world's largest LNG exporters, with liquefaction capacity exceeding 77 million tonnes per annum (mtpa) before the crisis. The UAE contributes approximately 9.6 mtpa, and Oman adds a further 10.6 mtpa to the regional total. This concentration means that around 35 to 40 percent of the world's total LNG liquefaction capacity sits within a single geographic basin with a single maritime exit.
What makes this disruption categorically different from historical precedent is the nature of LNG shipping itself. Unlike crude oil or refined products, which can be rerouted via pipeline or alternative tanker routes with relative flexibility, LNG requires highly specialised cryogenic vessels that must maintain cargo at approximately minus 162 degrees Celsius throughout transit.
Rerouting around the Cape of Good Hope adds roughly 20 to 30 days to a typical voyage from Qatari export terminals to Asian receiving ports, a logistical reality that renders alternative routing economically marginal at best and operationally untenable at scale.
Insurance markets compounded the problem further. As naval activity intensified in the Persian Gulf, underwriters began reassigning risk classifications to vessels transiting Hormuz, pushing war-risk insurance premiums to levels that made commercial voyages economically unviable for many operators. Elevated insurance costs alone can effectively close a corridor to commercial shipping, without requiring any physical damage to halt cargo flows.
How the Market Was Positioned Before the Shock
The timing of the disruption carried a particular sting because the global LNG market had, for the first time in years, been showing signs of genuine rebalancing. Between October 2025 and February 2026, global LNG trade expanded by 12 percent year-on-year, driven primarily by the commissioning of additional North American liquefaction capacity. For a broader view of the LNG supply outlook heading into this period, pre-crisis projections had been cautiously optimistic.
Benchmark prices in both European and Asian markets fell by approximately 25 percent over that five-month window, offering importing nations a period of relative relief after the structural tightness that had characterised markets since 2021.
Winter demand events complicated the picture. Major cold weather systems swept across North America, Europe, and East Asia during late 2025 and early 2026, driving sharp consumption spikes that tested infrastructure and reinforced the critical importance of supply flexibility. Despite these demand surges, the expanded liquefaction base proved sufficient to prevent a price crisis.
The pre-crisis consensus among energy agencies was that global LNG markets would transition from structural tightness to a broadly balanced state by late 2026 or early 2027, underpinned by an anticipated wave of capacity additions across North America and parts of Africa. That projection became obsolete in a matter of weeks.
The Supply Shock in Numbers
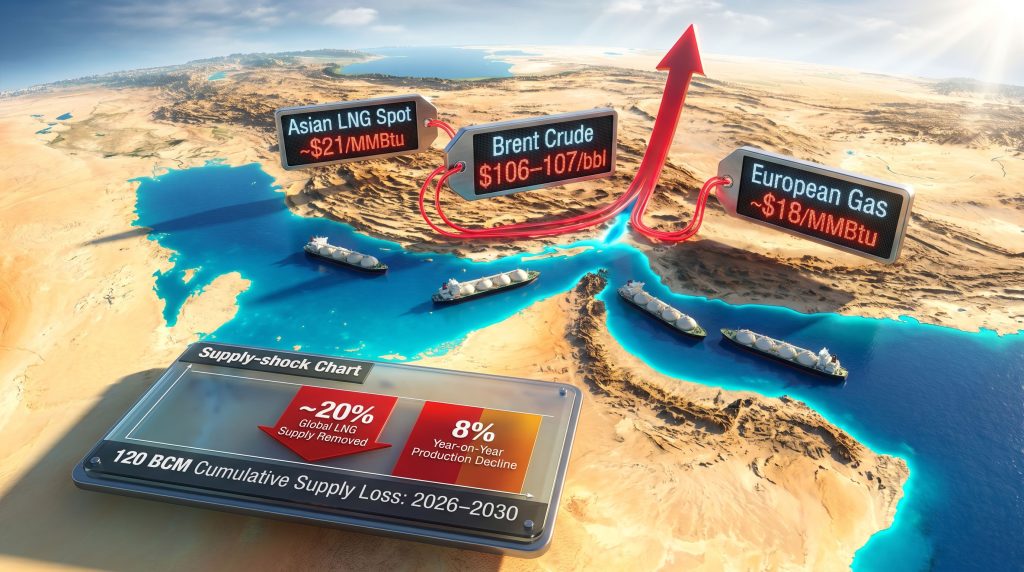
The scale of what happened from March 2026 onward is genuinely without modern precedent in gas market history. The IEA's quarterly gas market report confirmed that the Hormuz disruption removed close to 20 percent of global LNG supply from the market. Global LNG production contracted by 8 percent year-on-year, with the collapse in Qatari and UAE export volumes only partially offset by incremental increases from Australia, the United States Gulf Coast, and West African producers.
As supply chain disruptions compounded through the logistics network, LNG delivery volumes deteriorated further into April 2026, with the decline becoming more pronounced as the weeks progressed.
The price response was immediate and severe.
| Market | Pre-Crisis Avg (Oct 2025–Feb 2026) | Crisis Peak (March 2026) | Approximate Change |
|---|---|---|---|
| Asian LNG Spot | ~$13–14/MMBtu | ~$21/MMBtu | +~50% |
| European Gas Benchmark | ~$13–14/MMBtu | ~$18/MMBtu | +~30% |
| Brent Crude Oil | ~$80–85/bbl | $106–107/bbl | +~25–30% |
Asian spot LNG prices approached $21 per MMBtu during March 2026, while European benchmarks averaged approximately $18 per MMBtu across the same period. Furthermore, Brent and WTI futures surpassed $106 to $107 per barrel amid stalled diplomatic negotiations and continued naval activity in the Persian Gulf. These were the highest price levels recorded since January 2023, reversing months of market easing in a matter of weeks.
"The removal of approximately one-fifth of global LNG supply within weeks constitutes one of the most severe short-duration supply shocks in the history of the international gas market, surpassing in structural severity the demand disruptions observed during the COVID-19 contraction of 2020. Unlike 2020, where supply infrastructure remained intact and production could resume rapidly as demand recovered, the 2026 disruption involves both outright export losses and physical infrastructure damage that fundamentally complicates recovery." (IEA, Gas Market Report Q2 2026)
How Importing Regions Are Responding
The demand response across key importing regions has been rapid, though its adequacy varies significantly by geography and energy system structure.
Europe: Renewables as a Structural Buffer
European natural gas demand fell by approximately 4 percent year-on-year in March 2026, according to IEA data. A meaningful portion of this decline reflects stronger renewable electricity generation, particularly wind and solar output across Northern and Central Europe, which reduced the call on gas-fired power generation during the worst weeks of the price spike.
The critical caveat is that renewable substitution has hard limits. During periods of low wind and solar output, also known in grid management as Dunkelflaute conditions, gas-fired generation remains indispensable for system balancing. Europe's ability to absorb supply shocks through renewable substitution is therefore probabilistic rather than guaranteed, creating residual vulnerability during adverse weather periods.
Asia: Fuel Switching Under Pressure
The picture across Asia is considerably more complex. Major importers including Japan and South Korea have implemented fuel-switching programmes, ramping coal and oil-fired generation capacity and accelerating nuclear restart approvals where politically feasible. Demand-side management policies have been activated across several markets, involving industrial curtailment agreements and commercial building energy restrictions.
The structural vulnerability of East and Southeast Asian economies to Hormuz-dependent LNG supply is acute. Countries such as Japan, South Korea, and several Southeast Asian nations have limited domestic gas production and no meaningful pipeline import alternatives, making spot LNG the marginal source of supply that balances their energy systems.
| Region | Primary Response Mechanism | Structural Vulnerability | Short-Term Demand Impact |
|---|---|---|---|
| Europe | Renewables substitution + policy measures | Moderate (diversified supply base) | ~4% demand decline (March 2026) |
| Northeast Asia (Japan, South Korea) | Fuel switching + demand curtailment | High (heavily import-dependent) | Significant curtailment |
| South and Southeast Asia | Demand-side management | Very High (limited alternatives) | Acute affordability pressure |
| North America | Net LNG exporter | Low (supply beneficiary) | Minimal direct impact |
The Medium-Term Damage: Infrastructure and Capacity Delay
Beyond the immediate supply shock, the 2026 crisis has imposed a more durable structural cost on global LNG markets through damage to liquefaction infrastructure within Qatar.
Why Liquefaction Train Damage Is Different
LNG liquefaction trains are among the most capital-intensive and engineering-complex pieces of industrial infrastructure in existence. A modern liquefaction train involves hundreds of kilometres of cryogenic piping, massive heat-exchange units, multi-stage compression systems, and highly specialised metallurgical components.
The procurement timelines for critical equipment alone can extend to 18 to 24 months, even before construction and commissioning are factored in. Damage to a liquefaction train does not carry the same recovery timeline as, for example, a damaged oil production well or a pipeline leak. The IEA has assessed that new capacity delivery from affected Qatari infrastructure will be delayed by a minimum of two years.
This is not merely a short-term production loss. It is a deferral of the global LNG expansion wave that was expected to bring structural relief to tight markets through 2027 and 2028.
The 120 BCM Supply Gap
The cumulative impact of outright production losses combined with delayed capacity additions is projected by the IEA to reach approximately 120 billion cubic metres of missing LNG supply between 2026 and 2030. To contextualise this figure: 120 BCM is roughly equivalent to the combined annual natural gas consumption of Germany and France, based on Eurostat consumption data.
The timeline breakdown matters enormously:
- 2026: Outright production losses dominate, driven by the direct Hormuz disruption.
- 2027: Partial production recovery possible if shipping normalises, but the delayed expansion wave leaves markets structurally undersupplied.
- 2028–2030: Compounding effect of deferred capacity additions creates a persistent supply gap even as non-Gulf projects come online.
New liquefaction projects in North America, East Africa, and other regions are expected to partially offset these losses over the medium term, however the timing mismatch between the supply gap and new capacity delivery means markets are expected to remain structurally tight through at least 2026 and 2027, per IEA analysis.
The next major ASX story will hit our subscribers first
What the Crisis Reveals About Energy Security Architecture
The Concentration Risk Problem
The 2026 disruption has exposed, with painful clarity, the systemic vulnerability embedded in concentrating a third to two-fifths of global LNG liquefaction capacity within a single geographic corridor. This is not a new observation. Energy security analysts have flagged Persian Gulf concentration risk for years, and the broader geopolitical supply risks in global commodities have been well documented. What the crisis has demonstrated is that awareness of a risk and structural mitigation of that risk are two entirely different things.
Historical parallels offer sobering context. The 1973 Arab oil embargo removed approximately 7 percent of global oil supply and triggered the first modern energy security crisis. The 2021 to 2022 European natural gas crisis, driven by the progressive loss of Russian pipeline supply, took multiple years to fully resolve. In both cases, the structural lessons were partially absorbed but not fully integrated into supply architecture.
Contract Structure as a Risk Management Tool
One of the less-discussed dimensions of the crisis is the divergence in outcomes between importers holding diversified long-term supply contracts and those relying heavily on spot market procurement. Long-term supply agreements, typically structured with fixed or oil-linked price formulas and multi-year delivery commitments, have provided measurable insulation against spot price spikes for contract holders.
Buyers with diversified portfolios spanning North American, Australian, and African supply sources have been able to maintain throughput even as Hormuz-dependent spot volumes evaporated. This dynamic reinforces a principle well understood in theory but inconsistently applied in practice: supply diversification is not merely a commercial preference but an energy security imperative.
The Investment Imperative
The IEA's Q2 2026 gas market report places considerable emphasis on the need for sustained investment across the full LNG value chain as a prerequisite for supply security. The Mideast crisis disrupts global LNG markets calculus in ways that extend beyond immediate pricing, influencing long-term capital allocation decisions for years to come. Furthermore, energy transition pressures add another layer of complexity, as importing nations must simultaneously invest in supply security and decarbonisation infrastructure.
Whether accelerated final investment decisions (FIDs) materialise in the near term will depend on the depth and duration of the disruption and the risk appetite of both project developers and financing institutions.
Three Scenarios for LNG Market Recovery
Scenario 1: Rapid Resolution
If the Strait of Hormuz reopens to commercial LNG shipping within the next several months, markets could begin rebalancing through the second half of 2026. Asian spot prices would likely retreat from their March peaks toward the $14 to $16 per MMBtu range as supply normalises. However, even under this optimistic scenario, the residual supply gap from Qatari infrastructure damage persists.
Scenario 2: Prolonged Disruption Through 2026 to 2027
A sustained disruption would compound the investment uncertainty already rippling through the LNG sector. Extended high prices create dual pressures: accelerating the case for alternative supply investment while simultaneously increasing the risk of demand destruction and permanent fuel switching in price-sensitive markets. The oil price impact of a prolonged disruption could similarly cascade across interconnected energy commodity markets. South and Southeast Asian economies face the most acute stress under this scenario.
Scenario 3: Structural Realignment of Global LNG Trade
A multi-year disruption carries the potential to permanently redirect LNG trade flows and supplier relationships. US Gulf Coast, East African, and Australian supply routes could transition from supplementary sources to primary strategic suppliers for Asian importers. This scenario represents the most significant structural shift in global LNG market architecture since the expansion of US LNG exports began reshaping Atlantic and Pacific Basin flows after 2016.
According to analysis from oilprice.com, structural gas demand destruction poses a longer-term threat to LNG market fundamentals, meaning that even a recovery in supply may not fully restore pre-crisis demand levels across all importing markets.
Key Takeaways
- The Strait of Hormuz disruption has removed close to 20 percent of global LNG supply from the market since early March 2026
- Global LNG production contracted 8 percent year-on-year, with Qatar and UAE export losses only partially offset by other producing regions
- Asian spot LNG reached approximately $21/MMBtu and European gas benchmarks approximately $18/MMBtu in March 2026, multi-year highs not seen since January 2023
- Brent crude surpassed $106 to $107 per barrel amid stalled diplomatic resolution and continued naval activity in the Gulf
- Damage to Qatari liquefaction infrastructure will delay the global LNG expansion wave by a minimum of two years
- Cumulative LNG supply loss is projected at approximately 120 BCM between 2026 and 2030, equivalent to the combined annual gas consumption of Germany and France
- Markets are expected to remain structurally tight through at least 2026 and 2027, despite new non-Gulf capacity additions
- Importers with diversified long-term contract portfolios have demonstrated measurably greater resilience to the spot price shock
- The crisis has intensified the strategic case for supply diversification, long-term contracting, and accelerated LNG investment outside the Middle East
Disclaimer: This article contains forward-looking projections based on IEA assessments and energy market analysis as of April 2026. Scenario projections involve significant uncertainty and should not be construed as investment advice. Energy market conditions are subject to rapid change based on geopolitical developments, weather patterns, and policy decisions. Readers are encouraged to consult the IEA's quarterly gas market reports at iea.org and related energy policy analysis for the most current assessments.
Want to Know Which ASX Energy and Resources Discoveries Could Benefit From the LNG Supply Crisis?
Discovery Alert's proprietary Discovery IQ model delivers real-time alerts on significant ASX mineral discoveries, instantly identifying actionable opportunities across energy and resources sectors being reshaped by global supply disruptions — explore historic discoveries and their market returns to understand the scale of what early positioning can achieve, then begin your 14-day free trial at Discovery Alert to secure your market-leading advantage.