June 6, 2026
How Mining Fundamentals Shape Silver's Investment Landscape
The global precious metals sector operates through interconnected networks of supply constraints, technological demands, and monetary policy influences that create distinct investment opportunities. Understanding these underlying forces becomes essential when evaluating potential silver price forecast 2026 strategies through evolving market cycles.
Silver's unique position as both an industrial commodity and monetary metal creates pricing dynamics that differ significantly from traditional investment assets. The metal's superior electrical conductivity properties make it indispensable across expanding technological sectors, while its historical role as a store of value provides portfolio diversification benefits during periods of currency debasement.
When big ASX news breaks, our subscribers know first
Industrial Demand Transformation Driving Market Dynamics
Green Energy Sector Consumption Patterns
Solar photovoltaic cell manufacturing represents approximately 16% of global silver demand, with this percentage expanding annually as renewable energy installations accelerate worldwide. Each solar panel requires between 15-20 grams of silver for optimal electrical conductivity, making the metal irreplaceable in current technological configurations.
The International Energy Agency projects 85% growth in global solar capacity through 2026, directly translating to increased silver consumption requirements. This structural demand growth occurs independently of speculative trading activities, creating a fundamental floor for industrial consumption. Furthermore, this expansion aligns with the broader critical minerals energy transition taking place globally.
Key Industrial Applications:
• Solar panel manufacturing: 16% of annual demand
• Electronics and semiconductors: 22% of consumption
• Electric vehicle components: 25-50 grams per vehicle
• Medical applications: 8% of industrial usage
• 5G infrastructure development: Growing 12% annually
Electric Vehicle Integration Accelerating Demand
Electric vehicles require substantially more silver than traditional internal combustion engines, with each EV containing approximately 25-50 grams compared to 15-28 grams in conventional vehicles. As electric vehicle sales approach 30% of global automotive production by 2026, this represents significant incremental demand pressure.
The automotive sector's transition creates a compound effect where both vehicle electrification and charging infrastructure development drive silver consumption simultaneously. This dual demand source provides structural support independent of precious metals investment flows.
Global Supply Chain Constraints Creating Structural Deficits
Mine Production Challenges and Declining Ore Grades
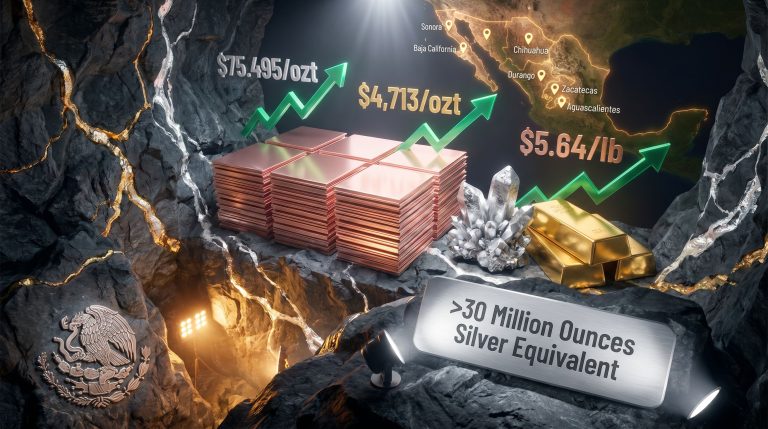
Six consecutive years of global supply deficits (2020-2025) have established a fundamental imbalance between production capacity and consumption requirements. Major producing facilities face declining ore grades, requiring increased processing volumes to maintain output levels. This situation contributes to the ongoing silver market squeeze affecting global markets.
Global Production Analysis:
| Region | Annual Production (Million Oz) | % of Global Supply | 5-Year Trend |
|---|---|---|---|
| Mexico | 189.5 | 23.2% | Declining -3% |
| Peru | 131.2 | 16.1% | Stable |
| China | 116.8 | 14.3% | Increasing +2% |
| Chile | 45.3 | 5.5% | Declining -5% |
| Australia | 42.1 | 5.2% | Stable |
Development Timeline Extensions for New Projects
Environmental regulations and permitting processes have extended development timelines for new mining projects to 8-12 years on average, compared to 5-7 years historically. This extended lead time creates structural supply constraints that cannot respond quickly to price signals. Additionally, the broader mining industry evolution continues to shape these timelines.
Geological Factors Affecting Supply:
Primary silver mines represent approximately 30% of global production, with the remaining 70% coming as byproduct from copper, lead, and zinc operations. This byproduct nature means silver supply often depends on demand for other metals rather than responding directly to silver price movements.
Ore grade quality has declined consistently across major producing regions, with average grades falling from 150-200 grams per tonne in the 1990s to 80-120 grams per tonne currently. Lower grades require exponentially more energy and processing to extract equivalent silver quantities.
Federal Reserve Policy Impact on Precious Metals Valuations
Real Interest Rate Calculations and Asset Allocation
Central bank monetary policies significantly influence silver's investment appeal through real interest rate dynamics. When nominal rates fall below inflation expectations, non-yielding assets like silver become more attractive relative to bonds and cash equivalents. However, the broader US economy outlook continues to influence these dynamics significantly.
Policy Scenario Analysis:
Hawkish Scenario (Rates Above 4.5%):
- Dollar strength reduces foreign demand
- Higher opportunity cost for non-yielding assets
- Potential price correction toward $60-65 range
Dovish Scenario (Rate Cuts Begin H2 2026):
- Dollar weakness enhances foreign purchasing power
- Lower opportunity cost supports precious metals
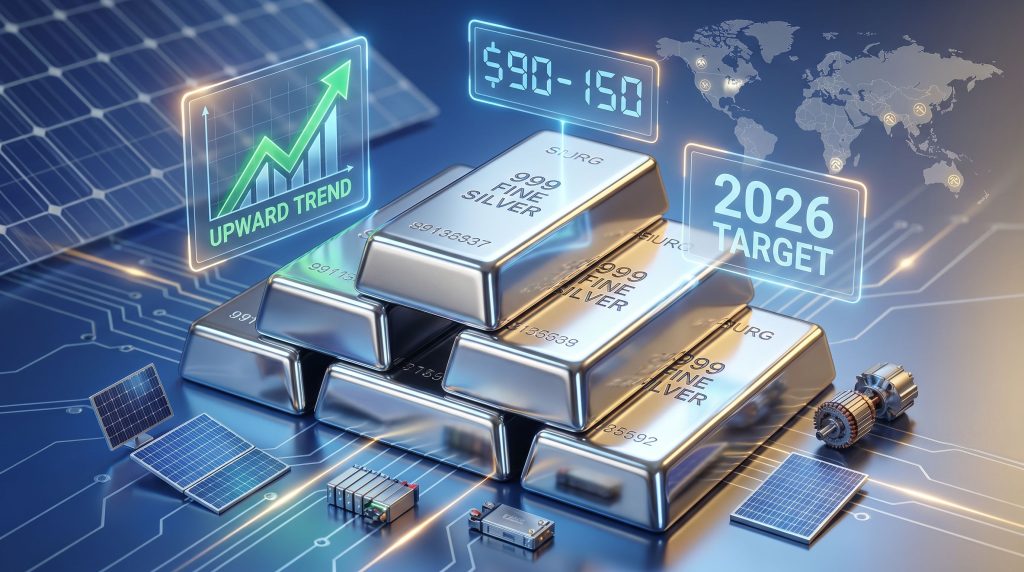
- Potential price advancement toward $90-105 range
Dollar Strength Correlation Patterns
Silver exhibits inverse correlation with dollar strength approximately 70% of the time during trending markets. This relationship becomes particularly pronounced during periods of monetary policy uncertainty when currency debasement concerns drive safe-haven demand.
The DXY dollar index movements of 5% or greater typically correspond to silver price movements of 15-25% in the opposite direction, demonstrating the metal's sensitivity to currency fluctuations.
Institutional Forecasting Framework and Price Projections
Major Bank Silver Price Forecast 2026 Analysis
Comprehensive Institutional Targets:
| Institution | 2026 Average Target | Year-End Target | Methodology Focus |
|---|---|---|---|
| J.P. Morgan | $81/oz | $85/oz | Supply-demand modeling |
| Commerzbank | $85/oz | $90/oz | Industrial demand growth |
| UBS | $75/oz | $80/oz | Macro policy analysis |
| Bank of America | $70/oz | $135/oz (bull case) | Scenario modeling |
| TD Securities | $44/oz | $65/oz (bear case) | Dollar strength focus |
For additional insight into silver market predictions, analysts suggest significant volatility ahead as market conditions continue to evolve.
LBMA Survey Consensus and Range Analysis
The London Bullion Market Association analyst survey for 2026 shows an average forecast of $79.57/oz with responses ranging from $42 to $165. This wide distribution reflects the metal's inherent volatility and diverse analytical approaches across institutions.
Probability-Weighted Scenarios:
• Bull Case ($90-135): 35% probability – Fed easing, supply shortages
• Base Case ($70-85): 45% probability – Moderate growth, stable policies
• Bear Case ($55-70): 20% probability – Dollar strength, demand softening
Speculative Positioning and Market Psychology Factors
Gold-to-Silver Ratio Historical Context
The gold-silver ratio analysis currently shows the ratio trading near 59-61:1, compared to the extreme reading of 105:1 reached in April 2025. This compression from historically undervalued levels removes one of the most compelling technical arguments for silver accumulation.
Ratio Interpretation Framework:
• Below 50:1 – Silver historically overvalued relative to gold
• 50-70:1 – Normal trading range reflecting industrial premium
• Above 80:1 – Silver undervalued, potential reversion opportunity
• Above 100:1 – Extreme undervaluation, high probability reversal
Speculative Unwind Risk Assessment
Silver's 147% rally in 2025 attracted significant speculative positioning, with managed money positions reaching near-record levels according to CFTC data. The subsequent correction from $121 to mid-$70s demonstrated how quickly speculative froth can unwind. Furthermore, market analysts emphasise the importance of understanding long-term trends amid short-term volatility.
Position Concentration Analysis:
Large speculative positions create potential for rapid price movements in either direction. Current positioning levels suggest vulnerability to macro-driven liquidation events, particularly if dollar strength persists or industrial demand disappoints.
The next major ASX story will hit our subscribers first
Technical Substitution and Demand Evolution
Solar Panel Thrifting Technology Advances
Manufacturers continue developing methods to reduce silver content per solar panel through improved efficiency designs. Current thrifting rates of 2-3% annually could offset installation growth if technological advances accelerate beyond current projections.
Technological Risk Factors:
| Risk Factor | Impact Magnitude | Timeline | Price Effect |
|---|---|---|---|
| Accelerated thrifting | Medium | 2-3 years | -$4-8/oz |
| Copper substitute development | High | 5+ years | -$15-25/oz |
| Recycling efficiency gains | Low-Medium | 3-5 years | -$2-5/oz |
Alternative Material Development Research
Research into copper nanowire and graphene applications for electrical conductivity continues, though commercial viability remains 5-10 years away at minimum. These developments represent long-term structural risks rather than immediate demand threats.
Current substitute materials cannot match silver's unique combination of electrical conductivity, thermal properties, and corrosion resistance across all applications simultaneously.
Investment Vehicle Selection and Portfolio Integration
Physical Silver Holdings Considerations
Premium Structure Analysis:
- Silver coins: 4-8% premium over spot price
- Silver bars (100 oz): 2-4% premium over spot price
- Silver bars (1000 oz): 1-2% premium over spot price
Storage costs typically range 0.5-1.5% annually depending on allocation size and security level. Insurance requirements add another 0.1-0.3% annually for comprehensive coverage.
Liquidity Considerations:
Physical silver markets maintain high liquidity for standard products, though selling premiums can vary significantly during volatile periods. LBMA-accredited products generally maintain better liquidity than non-standard formats.
Silver Mining Equity Exposure Analysis
Primary Silver Producers Comparison:
| Company | Production Focus | 2026 Outlook | Risk Profile |
|---|---|---|---|
| First Majestic Silver | 80% silver | Expanding capacity | High leverage to prices |
| Hecla Mining | 60% silver, 40% gold | Stable production | Moderate diversification |
| Pan American Silver | Multi-metal portfolio | Geographic diversity | Lower single-metal risk |
Mining equities typically exhibit 2-3x the volatility of underlying silver prices, providing amplified exposure to price movements while introducing operational and management risks.
Operational Risk Factors:
- Environmental compliance costs
- Labor disputes and wage inflation
- Permitting delays and regulatory changes
- Capital allocation efficiency
- Geopolitical risks in mining jurisdictions
Risk Management and Position Sizing Frameworks
Volatility Expectations and Correlation Analysis
Silver's 30-day realised volatility averages approximately 35-45% annually, compared to 15-20% for gold and 18-25% for major equity indices. This elevated volatility requires careful position sizing relative to overall portfolio risk tolerance.
Correlation Breakdown by Market Conditions:
• Normal markets: Silver correlates 0.6-0.8 with gold
• Stress periods: Correlation drops to 0.3-0.5, more industrial commodity-like
• Inflation periods: Correlation with TIPS and real assets increases
• Dollar strength: Inverse correlation strengthens to -0.7 or higher
Allocation Strategy Frameworks
Conservative Approach (2-5% allocation):
Focus on physical holdings or established ETFs for portfolio diversification. Emphasis on long-term inflation protection rather than tactical trading opportunities.
Moderate Approach (5-8% allocation):
Combination of physical holdings (60-70%) and mining equity exposure (30-40%). Periodic rebalancing based on gold-silver ratio signals and valuation metrics.
Aggressive Approach (8-15% allocation):
Higher mining equity concentration with potential options strategies for enhanced returns. Requires active monitoring and risk management protocols.
Scenario Planning for Multiple Economic Outcomes
Inflationary Persistence Scenario
Key Characteristics:
- Fed maintains restrictive policy longer than expected
- Real yields remain elevated
- Dollar strength continues
- Industrial demand softening in response to higher rates
Silver Impact: Potential correction toward $55-65 range as high real yields reduce appeal of non-yielding assets despite inflation concerns.
Stagflation Resurgence Scenario
Key Characteristics:
- Economic growth slowing while inflation remains elevated
- Fed policy effectiveness questioned
- Currency debasement concerns intensify
- Flight to real assets accelerates
Silver Impact: Potential advance toward $120-150 range as both monetary and industrial factors align positively.
Economic Recession Scenario
Key Characteristics:
- Sharp industrial demand decline
- Deflationary forces emerge
- Central bank easing accelerates
- Dollar weakness from policy response
Silver Impact: Initial decline to $45-55 range from industrial demand destruction, followed by recovery to $75-90 range as monetary policy response takes effect.
Advanced Technical Analysis and Price Level Framework
Support and Resistance Architecture
Critical Technical Levels:
Primary Support Zones:
- $72-75: Previous consolidation area from 2025 rally
- $68-70: 200-day moving average convergence zone
- $62-65: Major Fibonacci retracement (61.8% from $121 high)
- $55-58: Long-term trend line support
Resistance Targets:
- $88-92: Initial breakout resistance level
- $105-110: Psychological resistance and previous consolidation
- $121-125: All-time high region and major technical barrier
- $135-150: Extension targets based on measured moves
Volume and Momentum Analysis
Trading volume patterns suggest institutional accumulation occurs predominantly in the $65-80 range, with speculative activity increasing above $85. This distribution provides insight into price levels where long-term holders typically establish positions.
Momentum Indicators:
- RSI readings above 70 historically preceded short-term corrections
- MACD convergence patterns often signal trend continuation
- Volume-weighted average price (VWAP) serves as dynamic support/resistance
Regulatory Environment and Policy Implications
Environmental Regulation Impact on Mining
Increasingly stringent environmental regulations add 15-25% to development costs for new mining projects while extending permitting timelines. These regulatory pressures create structural supply constraints that support long-term price floors.
Regulatory Risk Assessment:
- Water usage restrictions in mining regions
- Carbon emission targets affecting energy-intensive operations
- Biodiversity protection requirements limiting exploration areas
- Community consultation requirements extending project timelines
Central Bank Digital Currency (CBDC) Considerations
The development of central bank digital currencies could potentially affect precious metals demand patterns if they provide more convenient alternatives to physical monetary assets. However, privacy concerns and technological dependencies may maintain demand for tangible wealth preservation vehicles.
CBDC Impact Analysis:
Current research suggests limited impact on precious metals demand given different use cases and risk profiles. Physical silver maintains unique properties (privacy, no counterparty risk, technological independence) that digital currencies cannot replicate.
Conclusion: Navigating Silver's Evolution from Undervalued to Fairly Valued
Silver's transformation from an obviously undervalued asset in 2025 to current levels near historical ratio norms fundamentally alters the investment proposition. The structural arguments supporting long-term demand remain intact: persistent supply deficits, expanding industrial applications, and monetary debasement protection.
However, the risk-reward calculation requires updated analysis given changed valuation metrics. At current gold-silver ratios near 60:1, the metal no longer offers the compelling asymmetric opportunity that existed when ratios exceeded 100:1. Consequently, silver price forecast 2026 projections must account for these evolved market conditions.
Strategic Investment Considerations:
• Position sizing becomes critical given elevated volatility expectations and reduced margin of safety
• Dollar-cost averaging approaches may prove more effective than attempting to time market entries
• Diversified exposure strategies combining physical holdings with mining equity can optimise risk-adjusted returns
• Regular portfolio rebalancing helps capture volatility while maintaining target allocations
Forward-Looking Assessment:
The most prudent approach involves understanding both upside potential toward $90-135 targets and downside risks toward $55-70 correction levels. Rather than betting exclusively on single scenarios, successful silver investment in 2026-2027 requires balancing structural optimism with tactical flexibility.
Silver's role as both industrial commodity and monetary asset creates unique portfolio diversification benefits, but optimal allocation depends on individual risk tolerance, investment horizon, and broader portfolio construction. The metal's supply-demand fundamentals support long-term investment themes while requiring careful attention to shorter-term positioning and risk management protocols.
This analysis is for informational purposes only and does not constitute investment advice. Precious metals investing involves significant risks, including the possible loss of principal. Consult qualified financial professionals before making investment decisions.
Looking for Silver Investment Opportunities on the ASX?
Discovery Alert provides instant notifications on significant ASX mineral discoveries, powered by its proprietary Discovery IQ model, helping investors identify potential opportunities in silver and precious metals companies before they capture broader market attention. Explore how major mineral discoveries can generate substantial returns by visiting Discovery Alert's dedicated discoveries page and begin your 14-day free trial today to position yourself ahead of the market.