
August 8, 2026
The Invisible Force Driving Asset Prices: Understanding Momentum Across Markets and Metal Commodities
Every experienced market participant eventually arrives at the same uncomfortable observation: prices rarely move in random walks. Instead, they tend to travel in directions, sustaining trends longer than fundamental analysis alone would predict. This phenomenon, known as momentum, sits at the intersection of behavioural finance, macro economics, and technical analysis. In 2026, understanding momentum in both markets and metal commodities has become less of an academic exercise and more of a practical necessity for anyone allocating capital across equities, precious metals, and industrial resources.
When big ASX news breaks, our subscribers know first
What Momentum Actually Means as a Market Force
Momentum is not simply a synonym for a rising price. In its most precise financial definition, it describes the statistically documented tendency for assets exhibiting recent price strength or weakness to continue moving in that same direction over a defined forward period. This is not folklore. Peer-reviewed academic research, including the foundational work published by Jegadeesh and Titman in 1993, established momentum as a measurable, persistent market anomaly across global equity markets, challenging the efficient market hypothesis in a way that has never been fully resolved.
There are two distinct forms worth separating:
- Price momentum: The continuation of recent directional price movement, typically measured over windows ranging from one month to twelve months depending on the asset class.
- Fundamental momentum: Acceleration in the underlying drivers of value, such as earnings revisions, demand growth rates, or supply contraction velocity.
Both can coexist, reinforce each other, or diverge in ways that create either high-conviction opportunities or dangerous traps for undiscerning investors.
The table below illustrates how momentum characteristics differ meaningfully across the major asset classes most relevant to current market conditions:
| Asset Class | Typical Momentum Window | Key Drivers | Common Measurement Tools |
|---|---|---|---|
| Equities | 3 to 12 months | Earnings revisions, sentiment, capital flows | Relative strength, RSI, rate of change |
| Commodity Futures | 1 to 6 months | Supply-demand shifts, positioning cycles | MACD, moving averages, COT data |
| Precious Metals | 1 to 9 months | Macro risk, USD direction, real interest rates | RSI, Bollinger Bands, trend channels |
| Industrial Metals | 1 to 6 months | Manufacturing cycles, geopolitical risk | Rate of change, volume-price confirmation |
One insight that does not receive enough attention outside specialist circles is the role of skip-month returns in momentum measurement. Research has consistently shown that the most recent one-month return should often be excluded from momentum calculations because short-term mean reversion distorts the signal. Practitioners who ignore this tend to enter positions at precisely the wrong moment within a trend.
Why Metal Commodities Are at the Centre of the Momentum Conversation in 2026
Three Structural Forces Converging Simultaneously
The current environment for momentum in both markets and metal commodities is unusually complex because multiple structural forces are operating concurrently rather than sequentially. Furthermore, the interplay between these forces is creating pricing dynamics that conventional single-factor models are poorly equipped to capture.
First, geopolitical realignment is physically restructuring global supply chains for critical industrial inputs. This is not a temporary friction. Trade route restructuring, resource nationalism, and bilateral resource agreements between major economies are creating durable supply-side constraints that pricing models built in the pre-2020 era did not anticipate. The escalating commodity market tariffs are compounding these pressures in ways that are only beginning to be priced into forward curves.
Second, policy-driven demand is accelerating. Electrification mandates, defence procurement cycles, and large-scale infrastructure programs across multiple major economies all share one common input requirement: metals. The rising critical minerals demand tied to energy transition is not a rumour; it is already embedded in capital expenditure programmes that will take years to complete.
Third, supply-side inelasticity remains the most underappreciated structural feature of the metals market. The average timeline from initial exploration decision to first commercial production at a new copper mine now exceeds sixteen years, according to industry data. This means that even if capital flooded into exploration today, no relief would reach physical markets before the early 2040s.
Copper's 50% Surge and What It Signals
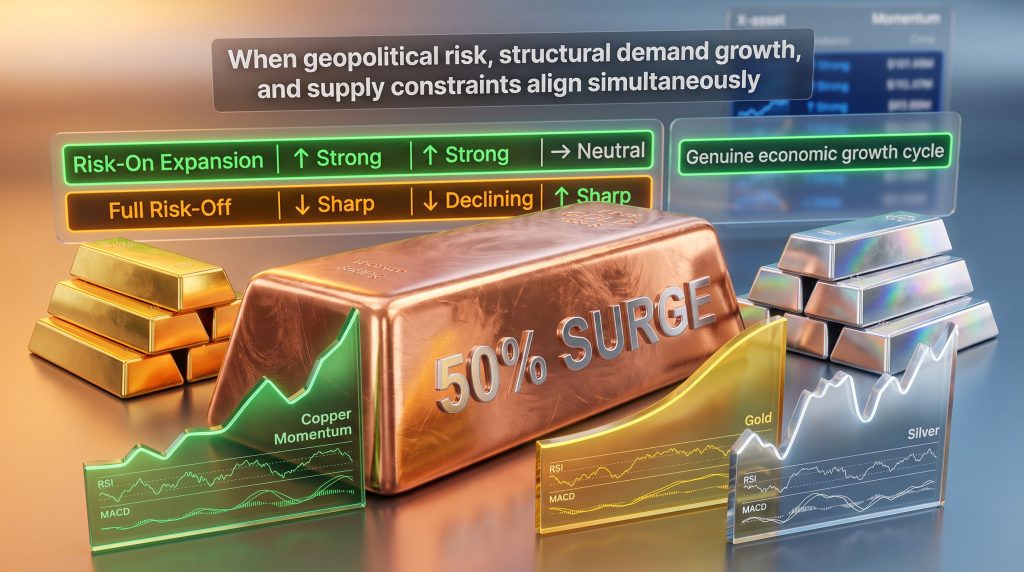
S&P Global's analysis attributes copper's extraordinary price appreciation to the simultaneous convergence of geopolitical supply disruption, policy-driven demand growth, and constrained mine output. According to S&P Global's Dan Yergin, these three forces operating together explain the scale of copper's move in a way that single-factor explanations cannot.
The ongoing copper supply crunch is not a short-term dislocation but a structural feature of the market for the foreseeable decade. Copper's role as a leading economic indicator is not metaphorical. A single onshore wind turbine requires approximately 3.6 tonnes of copper, and each electric vehicle contains roughly four times the copper content of a conventional internal combustion engine vehicle. Grid modernisation programmes are among the most copper-intensive infrastructure categories ever undertaken.
Key Insight: When geopolitical risk, structural demand growth, and supply-side inelasticity align within a single commodity simultaneously, the resulting momentum signals tend to be structurally durable rather than positioning-driven. Copper's 2026 environment reflects precisely this combination of conditions.
Gold, Silver, and the Layered Momentum Dynamic
Precious metals momentum in 2026 is operating within a distinct macro context that deserves separation from the industrial metals discussion. Gold's momentum is primarily driven by reserve diversification, real yield compression, and elevated policy uncertainty. The strength of central bank gold demand has been extraordinary, with central banks collectively purchasing over 1,000 tonnes of gold in both 2022 and 2023 according to World Gold Council data — a buying pace that has fundamentally altered the demand architecture for the metal.
Silver presents a more complex analytical challenge. Its dual identity as both an industrial metal and a monetary asset means its momentum profile layers two distinct sets of drivers that can reinforce or contradict each other depending on the macro environment. Consequently, the gold-silver ratio has become a closely watched indicator for investors attempting to identify which metal offers superior momentum-adjusted value at any given point in the cycle.
Industrial silver demand is furthermore being driven by photovoltaic panel manufacturing, where silver paste is a non-substitutable component in current solar cell architectures. This creates a demand floor beneath silver's price that gold does not share.
How Momentum Is Measured in Metal Commodity Markets
The Technical Toolkit for Commodity Trend Analysis
Measuring momentum in both markets and metal commodities requires a multi-indicator approach because no single tool captures the full picture:
- Relative Strength Index (RSI): Quantifies the speed and magnitude of recent price movements on a 0-to-100 scale. In commodity markets, readings above 70 signal potential overbought conditions, while readings below 30 indicate oversold territory. Importantly, in strong trending commodity markets, RSI can remain in overbought territory for extended periods without triggering a reversal.
- Moving Average Convergence Divergence (MACD): Tracks the relationship between two exponential moving averages, typically the 12-period and 26-period EMAs, to identify directional shifts and momentum strength changes before they become apparent in price alone.
- Rate of Change (ROC): Expresses the percentage price difference between the current period and a defined number of periods ago. Unlike RSI, ROC is unbounded, making it particularly useful for identifying the relative strength of momentum across different commodities.
- Commitment of Traders (COT) Reports: Published weekly by the CFTC, COT data reveals the positioning of commercial hedgers versus managed money participants. When speculative long positioning in copper futures reaches historical extremes, it is frequently a signal that price momentum is outrunning physical fundamentals.
The distinction between momentum confirmation and momentum divergence is critical and often overlooked:
- Confirmation: Price makes new highs while RSI, volume, and positioning data all confirm the move. This is a high-conviction continuation signal.
- Divergence: Price advances to new highs while RSI flattens or declines. Historically, this pattern precedes trend exhaustion in metals markets and warrants defensive positioning rather than momentum-chasing.
A practical nuance that many retail participants miss: divergence signals in commodity markets should never be acted upon in isolation. They require corroboration from fundamental supply-demand analysis and COT positioning data before they carry actionable weight.
Equity Market Momentum as an Investment Factor
The Academic Foundation and Current Application
The peer-reviewed documentation of equity momentum as a persistent market anomaly spans multiple decades and dozens of markets. The core finding is consistent: stocks exhibiting the strongest returns over the prior three to twelve months tend to continue outperforming over the subsequent one to twelve months, while the weakest performers continue to underperform. This is the empirical basis for systematic momentum strategies used by institutional quantitative funds globally.
What makes momentum particularly interesting in the current macro environment is its sensitivity to the rate cycle. Research from AQR Capital Management and others has documented that momentum strategies perform differently depending on whether real interest rates are rising or falling. In a rate-cutting cycle, momentum tends to extend because falling discount rates inflate valuations in a way that reinforces existing price trends.
Warning: Momentum strategies carry inherent reversal risk that is easy to underestimate during trend continuation phases. Rapid macro shocks, including sudden central bank policy pivots or geopolitical escalations, can trigger sharp momentum unwinds in crowded factor positions. The speed of reversal is often proportional to the degree of crowding.
The risk of momentum crowding deserves particular attention in 2026. When systematic trend-following funds, risk parity strategies, and discretionary momentum investors all hold overlapping long positions in the same assets, the exit dynamics during any reversal become compressed and disorderly.
Cross-Asset Momentum: Reading the Relationship Between Equities and Metals
When the Two Move Together and When They Diverge
The relationship between equity momentum and commodity momentum is one of the most information-rich signals available to macro investors. The table below outlines the primary cross-asset scenarios and their typical interpretations:
| Scenario | Equity Momentum | Copper Momentum | Gold Momentum | Interpretation |
|---|---|---|---|---|
| Risk-On Expansion | Strong upward | Strong upward | Neutral | Genuine economic growth cycle underway |
| Uncertainty Rally | Moderate upward | Flat | Strong upward | Policy or geopolitical risk premium building beneath the surface |
| Stagflation Signal | Weak or declining | Mixed | Strong upward | Inflation concern without growth support |
| Full Risk-Off | Sharp decline | Declining | Sharp upward | Flight to safety, recession being priced |
The current 2026 configuration warrants careful monitoring. Periods where both equities and industrial metals are advancing simultaneously have historically corresponded to mid-cycle economic expansion phases where genuine demand-side growth is the primary driver. However, the simultaneous strength in gold alongside both equities and copper is historically unusual and suggests that elevated systemic uncertainty is being priced beneath the surface-level market confidence.
This cross-asset momentum pattern carries a specific reading for sophisticated investors: the market is simultaneously pricing growth and uncertainty — an environment that tends to reward diversification across both risk assets and defensive stores of value rather than concentration in either.
The next major ASX story will hit our subscribers first
The Policy-Momentum Nexus: Jobs Data, Central Banks, and Metal Demand
How Macro Policy Inputs Sustain or Undermine Trend Persistence
The July 2026 jobs report functions as a real-time stress test for momentum across both equity and commodity markets. Strong employment data reinforces equity momentum by supporting corporate earnings expectations while simultaneously signalling the kind of robust industrial activity that sustains physical demand for copper, aluminium, and other base metals.
The Federal Reserve transmission mechanism works through the US dollar's inverse relationship with dollar-denominated commodity prices. When strong economic data delays rate cuts, a firming dollar creates headwinds for commodity momentum even when underlying physical demand remains robust. This creates a scenario where commodity momentum signals can temporarily diverge from physical fundamentals — a situation that disciplined investors use as an entry point rather than an exit signal.
The question of central bank independence has furthermore emerged as an invisible but significant momentum driver in 2026. Perceived threats to the operational independence of major central banks introduce a risk premium into long-duration assets and inflation-sensitive commodities alike. When market participants believe that monetary decisions may be influenced by political pressure rather than economic analysis, both precious metals and real assets tend to attract defensive allocation flows that amplify existing upward price momentum.
Mohamed El-Erian of Allianz has noted publicly that political interference in the Federal Reserve's decision-making framework creates unnecessary uncertainty for financial markets — a dynamic that has historically translated directly into gold price strength as investors seek assets outside the policy influence perimeter.
A Practical Framework for Interpreting Momentum Signals
Five Steps for Applying Momentum Analysis to Real Portfolio Decisions
Translating momentum analysis into actionable portfolio positioning requires a structured approach rather than a reactive one. The following five-step framework integrates technical signals with fundamental corroboration:
- Establish the primary trend direction using the 200-day moving average as a baseline filter for both equity indices and commodity futures. Assets trading below their 200-day MA should be treated with structural caution regardless of short-term momentum signals.
- Quantify trend strength using RSI and MACD across multiple timeframes. A momentum signal that appears on both the weekly and daily charts carries meaningfully higher conviction than one visible only on a single timeframe.
- Test for confirmation or divergence by comparing price action with volume data and COT positioning reports. New price highs accompanied by declining open interest in commodity futures often signal that speculative excess rather than physical demand is driving the move.
- Overlay the macro backdrop by assessing the current rate cycle position, USD trend trajectory, and leading economic indicators. Technical momentum signals that align with supportive fundamental conditions warrant higher confidence and larger position sizing.
- Calibrate exposure to signal quality rather than applying uniform position sizes. High-conviction momentum configurations — where price, indicators, and fundamentals are all aligned — warrant full-sized positions, while divergent or conflicting signals warrant reduced exposure and defined risk parameters.
Common mistakes that erode momentum strategy performance:
- Treating a single technical indicator as sufficient signal rather than requiring multi-factor confirmation
- Ignoring the time-horizon mismatch between short-term technical momentum and medium-term fundamental trends
- Conflating commodity price momentum with equity sector momentum, which can diverge significantly even within a shared macro environment
- Underestimating liquidity risk: momentum signals in thinly-traded commodity markets carry meaningfully higher reversal risk than those appearing in deep, liquid equity markets
Frequently Asked Questions About Momentum in Markets and Metal Commodities
What is the core difference between momentum in equities versus commodities?
Equity momentum is primarily driven by earnings revisions, investor sentiment, and capital allocation flows, typically measured over three-to-twelve-month windows. Commodity momentum is more directly tied to physical supply-demand dynamics, positioning cycles, and macro variables like the US dollar and real interest rates. Both share the principle of trend persistence, but the underlying drivers and reversal catalysts differ significantly.
Can copper price momentum reliably predict equity market direction?
Copper's strong historical correlation with global manufacturing activity means sustained upward copper price momentum has frequently preceded periods of equity market strength. However, the relationship is not deterministic. Financial market dynamics and central bank policy can drive equities independently of physical commodity trends for extended periods, particularly when monetary conditions are the dominant variable.
Why does a strong jobs report have different implications for precious metals versus base metals?
Strong employment data signals robust economic activity, supporting industrial metal demand expectations and reinforcing upward price momentum in copper and other base metals. For precious metals, however, the same data reduces safe-haven demand while the Fed is less likely to cut rates, which typically strengthens the US dollar and creates near-term headwinds for gold-denominated prices.
What is momentum crowding and why does it matter in 2026?
Momentum crowding occurs when multiple systematic strategies, trend-following funds, and discretionary investors all accumulate overlapping positions in the same assets simultaneously. The risk is asymmetric: while the crowded trade continues to perform, the strategy benefits from self-reinforcing inflows, but when a reversal trigger appears, the exit becomes disorderly and losses accelerate rapidly as all participants attempt to reduce exposure at the same time.
This article is intended for informational and educational purposes only and does not constitute financial advice. Commodity and equity markets carry significant risk of loss. Past momentum patterns are not a guarantee of future performance. Readers should conduct their own research and consult a qualified financial professional before making any investment decisions. All forward-looking statements and market projections involve inherent uncertainty.
Want to Identify the Next Major Mineral Discovery Before the Broader Market Does?
Discovery Alert's proprietary Discovery IQ model delivers real-time alerts on significant ASX mineral discoveries — instantly converting complex mineral data into actionable insights for traders and investors at every experience level. Explore historic examples of major discovery returns and begin your 14-day free trial today to position yourself ahead of the market.