
August 11, 2026
Defining the Problem: When Markets Price in a World That No Longer Exists
Financial markets are built on a simple premise: prices should reflect the underlying value of assets, adjusted for risk and time. When that mechanism breaks down across multiple asset classes simultaneously, the consequences tend to be both severe and far-reaching. Understanding why prices become structurally disconnected from reality requires more than observing individual market anomalies. It demands a framework capable of identifying the most mispriced markets in 56 years and distinguishing temporary cyclical distortions from deep, structurally embedded dislocations compounded over decades.
This distinction matters enormously. A cyclical overvaluation in equities, for instance, might self-correct over a normal earnings cycle as economic conditions shift. A structural mispricing, by contrast, is one that has been actively maintained by policy intervention, artificial demand creation, or behavioural feedback loops that prevent natural price discovery from functioning. The claim that current conditions represent the most mispriced markets in 56 years is not simply a provocative headline. It points specifically to the post-1971 fiat monetary era as the root cause, and argues that the accumulated distortions from over half a century of unconstrained credit expansion have reached a critical inflection point.
Alasdair Macleod, Strategic Advisor at VON GREYERZ and a market observer with more than five decades of professional experience, has articulated this thesis with particular force. His assessment spans sovereign bond markets, equity valuations, currency purchasing power, and the conspicuously depressed sentiment toward precious metals. Each of these dislocations, he argues, is interconnected, and understanding the web of relationships between them is essential for positioning intelligently in the period ahead.
When big ASX news breaks, our subscribers know first
The 1971 Origin Point: How Unconstrained Fiat Creation Built Today's Distortions
To understand why conditions are so extreme today, it is necessary to trace the architecture of modern monetary distortion back to its source. The 1971 gold standard end came on August 15, when US President Richard Nixon suspended the convertibility of the US dollar into gold, effectively dismantling the Bretton Woods system that had governed international monetary relations since 1944. This single policy decision severed the last external constraint on the creation of money and credit.
The consequences unfolded gradually at first, then accelerated dramatically. Governments and central banks that were previously limited by gold reserve requirements could now expand balance sheets without theoretical limit. Debt-to-GDP ratios climbed. Asset price inflation became a persistent feature of economic cycles. Furthermore, each successive financial crisis was met with an ever-larger policy response, creating what can be described as a ratchet effect: monetary stimulus was applied aggressively during downturns, but never fully withdrawn during recoveries.
The historical record of this compounding dynamic is stark:
| Historical Inflection Point | Year | Key Development | Contribution to Current Mispricing |
|---|---|---|---|
| Nixon Closes Gold Window | 1971 | Bretton Woods ends | Foundation for unconstrained fiat expansion |
| Plaza Accord | 1985 | G5 coordinated dollar devaluation | Confirmed FX intervention as policy tool |
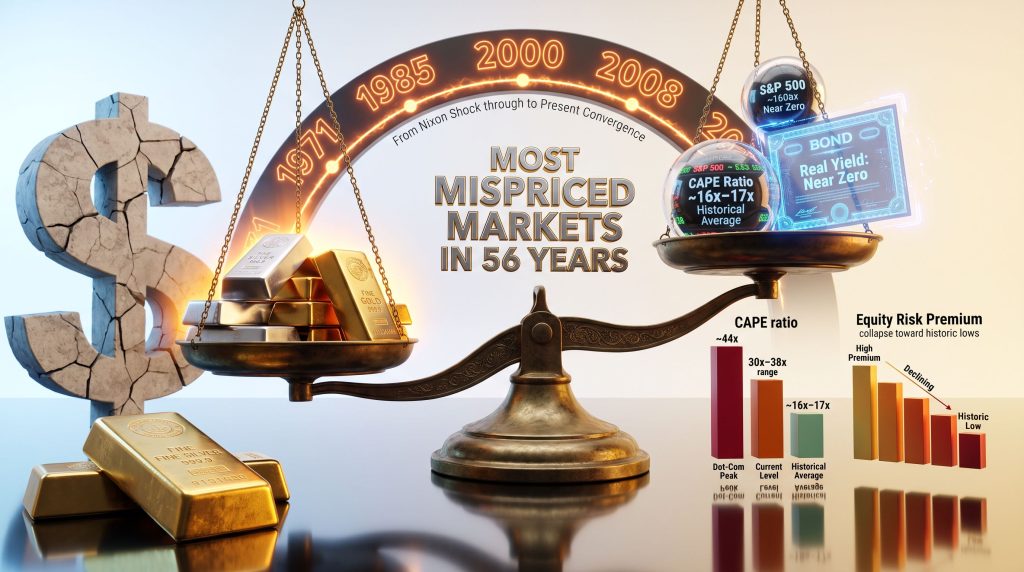
| Dot-Com Bubble Peak | 2000 | CAPE ratio reached approximately 44x | Equity valuation benchmark for extremes |
| Global Financial Crisis | 2008-2009 | QE programmes launched globally | Bond market distortion begins systematically |
| Post-COVID Monetary Expansion | 2020-2022 | Major central bank balance sheets reach record levels | Current mispricing amplified across all asset classes |
The 2026 environment, viewed through this historical lens, represents not an isolated anomaly but the culmination of 55 years of accumulated policy-driven distortion. Each crisis response added another layer. The current situation is, in this sense, the logical destination of the post-Bretton Woods monetary journey.
Why the Bond Market Sits at the Epicentre of Global Mispricing
If one asset class can be identified as the most fundamentally mispriced in the current environment, the case for sovereign bonds is compelling. The price of sovereign debt is, in essence, the price of money over time. When that price is systematically suppressed through central bank intervention, the distortion radiates outward to affect every other asset class in the financial system.
How Decades of Central Bank Intervention Suppressed Sovereign Debt Pricing
Quantitative easing programmes introduced after 2008 and dramatically expanded after 2020 involved central banks purchasing sovereign bonds directly, creating artificial demand that displaced private price discovery. Yield curve control policies, most visibly deployed by the Bank of Japan, went further still, explicitly capping yields at predetermined levels regardless of market conditions. The result was a prolonged period in which the yields on government bonds bore little relationship to the underlying fiscal positions of the issuing governments, the prevailing inflation rate, or the genuine supply-and-demand dynamics of the market.
The distortion this produced can be measured across several dimensions:
| Bond Market Indicator | Current Condition | Historical Norm | Implied Distortion |
|---|---|---|---|
| Real Yield on 10-Year US Treasury | Near zero or intermittently negative in real terms | +1.5% to +2.5% historically | Significant structural suppression |
| Long Bond Yield vs. Nominal GDP Growth | Frequently below GDP growth rate | Typically aligned or above | Structural underpricing of duration risk |
| Duration Risk Premium | Compressed | Elevated in pre-QE eras | Historically anomalous compression |
| Japan 10-Year JGB Yield (YCC period) | Policy-capped near zero | Market-implied fair value materially higher | Explicit price control |
The Compounding Risk: How Bond Mispricing Infects Every Other Asset
The reason bond market mispricing is so consequential is that sovereign bond yields function as the discount rate for virtually every other financial asset. Equity valuations, real estate prices, private equity returns, and corporate bond spreads all depend, to varying degrees, on the risk-free rate established by government bond yields. When that rate is artificially suppressed, the apparent justification for elevated prices in every other asset class becomes structurally fragile.
Furthermore, gold and bond volatility share an important relationship in this context. Any repricing of the bond market does not occur in isolation. A sustained move higher in sovereign yields forces a simultaneous reassessment of equity valuations, debt serviceability for leveraged borrowers, and the attractiveness of alternative stores of value. It is precisely this cascade risk that makes bond market mispricing the systemic fault line within the broader multi-asset dislocation thesis.
Is the S&P 500 the Most Expensive Equity Market in Modern History?
Equity market valuations provide some of the most historically robust evidence for the mispricing thesis. The cyclically adjusted price-to-earnings ratio, commonly referred to as the CAPE ratio and developed by economist Robert Shiller, smooths earnings over a ten-year period to remove cyclical distortions, providing a longer-term picture of valuation relative to economic fundamentals.
Based on 141 years of S&P 500 data, the CAPE ratio currently places US equity valuations within the most expensive 4% of all historical quarters ever recorded. The only period in modern financial history with a higher CAPE reading was the dot-com peak of 1999 to 2000, when the ratio approached 44x.
Dot-Com Era vs. Today: A Structural Comparison
| Valuation Metric | Dot-Com Peak (~2000) | Current Level (2026) | Historical Average |
|---|---|---|---|
| CAPE Ratio | ~44x | 30x-38x range | ~16x-17x |
| S&P 500 Earnings Yield | ~2.3% | Compressed | ~5.5%-6.5% |
| Equity Risk Premium | Near zero | Near historic lows | ~3%-4% |
| Price-to-Sales Ratio | Elevated | At or near record highs | Below 2x |
Academic research examining historical S&P 500 forward returns following CAPE ratios above 30x consistently shows that subsequent ten-year real returns compress to low single digits or negative territory. This pattern has held across every measured historical instance since 1881. The data does not predict the timing or mechanism of correction, but it does suggest that the probability distribution of outcomes from current valuation levels is heavily skewed to the downside over any meaningful investment horizon.
An additional structural concern is the relationship between the equity earnings yield and the yield on long-duration government bonds. When equity valuations are elevated while bond yields are suppressed, the equity risk premium, which is the additional return investors demand for owning equities over bonds, compresses to near zero. This condition, which currently exists in the US market, historically signals that equities are priced for perfection while offering insufficient compensation for the actual risk being assumed.
The US Dollar: A Reserve Currency Trading Above Fundamental Value
Currency mispricing is perhaps the most politically sensitive element of the current dislocation thesis, but it is also one of the most analytically well-supported. Purchasing power parity models, which estimate the exchange rate at which two currencies equalise the cost of an identical basket of goods, consistently show the US dollar trading at a substantial premium to its fair value against a broad basket of trading partners.
Several structural factors have maintained this overvaluation over time:
- Reserve currency demand: Global trade settlement in dollars, combined with the requirement for foreign central banks to hold dollar reserves, creates persistent artificial demand for the currency beyond what trade fundamentals would justify.
- Petrodollar recycling: Energy-exporting nations historically denominate oil contracts in dollars, compelling importing nations to maintain dollar holdings regardless of bilateral trade imbalances.
- Safe-haven flows: During periods of global financial stress, reflexive demand for dollar-denominated assets amplifies the currency's strength beyond purchasing power parity levels.
Historical precedent suggests that prolonged dollar overvaluation does not unwind gradually. The Plaza Accord of 1985 demonstrated that even coordinated G5 intervention was required to correct a dollar that had appreciated by roughly 50% in real terms over the preceding five years. The subsequent adjustment reduced the dollar's value by approximately 40% against major trading partners within two years. A similarly abrupt correction episode occurred in the early 2000s, when the dollar bear market that followed the dot-com bust erased a significant portion of the currency's prior gains over a multi-year period.
Protracted currency overvaluation has a documented historical tendency to resolve not through gradual adjustment but through sharp, policy-driven corrections or disorderly market repricing events.
The Dollar-Gold Feedback Loop
The relationship between dollar strength and gold prices is mechanically inverse over long periods. A structurally overvalued dollar suppresses the dollar-denominated price of gold, creating what amounts to an artificially depressed floor for precious metals prices during periods of dollar premium. Consequently, gold and the monetary system interact such that when the dollar premium contracts, the same quantity of gold commands a materially higher dollar price, even without any change in physical supply or demand fundamentals.
FX Interventions as a Leading Indicator of Systemic Stress
The decision by central banks to intervene directly in foreign exchange markets is not taken lightly. Currency intervention is costly, diplomatically sensitive, and typically ineffective unless deployed at precisely the right market juncture. The fact that both US and Japanese monetary authorities have engaged in documented FX market interventions in recent years — the Bank of Japan spending the equivalent of several hundred billion dollars defending the yen between 2022 and 2024 — signals that natural market pricing mechanisms have deteriorated to a point where authorities feel compelled to act.
The historical record of significant FX interventions preceding broader market regime changes is consistent:
- The 1985 Plaza Accord preceded a prolonged dollar bear market and a period of significant financial market restructuring across G7 economies.
- Japan's aggressive yen defence operations in the early 1990s coincided with the collapse of its asset price bubble, exposing the limitations of intervention as a substitute for fundamental adjustment.
- The coordinated G7 intervention to strengthen the yen following the 2011 Tohoku earthquake demonstrated that intervention can be effective when conditions align, but the relief proved temporary against underlying macro forces.
Macleod's observation that current FX interventions represent a signal that too few market participants are heeding is grounded in this historical pattern. Interventions of this scale and frequency are symptoms of a system under structural stress, not isolated technical market management exercises.
The next major ASX story will hit our subscribers first
Gold and Silver Sentiment: Maximum Pessimism in a Period of Record Money Creation
One of the most analytically striking features of the current environment is the juxtaposition of historically depressed Western investor sentiment toward gold and silver against the backdrop of record levels of fiat currency creation since 2020. By conventional contrarian analysis, this combination would represent a powerful setup for a structural repricing.
Sentiment indicators across multiple measurement frameworks, including Commitment of Traders positioning data, ETF flows, and retail investor survey data, have pointed to levels of pessimism toward precious metals that historically correspond to major cyclical lows rather than periods of continued weakness. The paradox is that gold and silver tend to attract the least interest precisely at the moments when the fundamental case for holding them is strongest.
Contrarian market analysis consistently identifies maximum pessimism as the precondition, not the obstacle, for the most powerful and sustained precious metals bull markets. The combination of depressed sentiment and expanding monetary aggregates has historically been the most reliable precursor to significant upward repricing in gold and silver.
The East-West Demand Divergence
A structural development that receives insufficient attention in Western financial media is the persistent and growing divergence between Western investor sentiment toward gold and the physical accumulation behaviour of Eastern buyers, particularly in China. While Western institutional investors have reduced gold ETF holdings and retail investors have shown little appetite for physical accumulation, central bank gold reserves held by the People's Bank of China have increased substantially, and Chinese consumer demand for physical gold jewellery, bars, and coins has remained robust.
This divergence matters for several reasons:
- Physical demand from Asian buyers does not flow through Western paper gold markets. It represents genuine transfer of metal ownership at current prices, regardless of sentiment readings in London or New York.
- Central bank gold accumulation by the People's Bank of China and other Asian central banks is a multi-year strategic programme, not a tactical trade. It is unlikely to be reversed by short-term price movements.
- The combination of Western selling and Eastern buying at current price levels creates a structural transfer of physical metal from West to East that has historically been difficult to reverse quickly when Western sentiment eventually turns positive.
Silver's Pronounced Mispricing Within the Precious Metals Complex
Silver occupies a unique analytical position because it functions simultaneously as a monetary metal and an industrial commodity. Its role in solar panel manufacturing, electric vehicle components, and electronic applications means that physical demand is structurally supported by energy transition trends that are largely independent of monetary factors.
The gold-to-silver ratio, which measures how many ounces of silver are required to purchase one ounce of gold, has historically ranged between approximately 15:1 and 80:1 across long market cycles. Extended periods above 80:1 have typically preceded silver's most powerful outperformance phases relative to gold. Current readings above these historically elevated thresholds suggest that silver's mispricing, relative to both gold and its own historical precedents, may be even more pronounced than the gold market's dislocation.
Hypothetical Scenarios: Mechanically Repricing Gold and Silver
Two analytical scenarios illustrate the potential magnitude of repricing in precious metals if structural dislocations resolve:
Scenario 1: Equity-Bond Correlation Breakdown
During periods of simultaneous equity and bond market stress, historical data shows that gold consistently functions as an effective diversifier. If the current artificial suppression of bond yields were to reverse abruptly, forcing both bond and equity prices lower simultaneously, the demand for non-correlated assets would accelerate sharply. Gold's performance during the 2008 to 2009 financial crisis, when it appreciated while equities and bonds both experienced significant volatility, provides a relevant historical template.
Scenario 2: Dollar Depreciation of 20%
A 20% decline in the dollar index from current elevated levels would, through the purely mechanical inverse relationship between dollar strength and gold's dollar-denominated price, provide a substantial uplift to precious metals valuations even without any change in the underlying supply and demand dynamics for physical metal. Silver, with its smaller market and greater price sensitivity, would likely experience even greater percentage gains under this scenario.
These scenarios are illustrative and speculative. They do not constitute investment advice or reliable predictions of future market outcomes. All investments carry risk, and past performance is not a guide to future results.
Frequently Asked Questions: The Most Mispriced Markets in 56 Years
What does it mean for a market to be mispriced?
A market is mispriced when the prevailing price of an asset diverges materially from its intrinsic or fundamental value for reasons that are not explained by genuine supply and demand dynamics. Mispricing can result from policy intervention, behavioural biases, information asymmetry, or structural market distortions. The key distinction from cyclical overvaluation is that structural mispricing tends to be more persistent and ultimately self-corrects through more disruptive mechanisms.
Why is the bond market considered the most fundamentally mispriced asset class?
Because sovereign bond yields function as the universal discount rate for all other financial assets, systematic suppression of those yields through quantitative easing and yield curve control programmes creates distortions that propagate across every other market. When bond yields are held below the natural rate of interest demanded by market participants, the entire pricing architecture of the global financial system rests on an artificially maintained foundation.
What is the CAPE ratio and why does it matter?
The cyclically adjusted price-to-earnings ratio divides the current price of an equity index by the average of the previous ten years of inflation-adjusted earnings. By smoothing out cyclical earnings fluctuations, it provides a more stable long-run valuation benchmark. Research by Robert Shiller and others has established that elevated CAPE ratios are among the most reliable predictors of compressed long-run forward returns, though they provide limited guidance on the timing of corrections.
Why are gold and silver sentiment readings at historically low levels?
Western institutional and retail investors have largely positioned precious metals as an inflation hedge rather than a monetary reserve asset. As inflation readings moderated from their 2022 peaks, interest in gold and silver declined among Western investors despite the ongoing expansion of monetary aggregates and sovereign debt levels. This sentiment dynamic is structurally disconnected from the fundamental monetary case for precious metals ownership.
What role does Chinese gold buying play in the global precious metals market?
Chinese central bank and consumer demand for physical gold represents a structural source of buying that is independent of Western paper market sentiment. The scale of Chinese accumulation means that significant quantities of physical metal are being transferred from Western vaults to Eastern ownership at current price levels, a dynamic that historically tightens physical supply over time and lays the foundation for future price appreciation when Western sentiment eventually reverses.
Key Takeaways: A Convergence of Historically Rare Dislocations
The multi-asset mispricing thesis described by Macleod and the analytical framework supporting it converge on several core conclusions:
- Sovereign bond markets have been structurally mispriced through active policy intervention for over a decade, creating a distorted foundation for every other asset class globally.
- US equity valuations, as measured by the CAPE ratio, sit within the most expensive historical percentile across 141 years of data, with forward return implications that are historically negative over long horizons.
- The US dollar's persistent overvaluation relative to purchasing power parity benchmarks has artificially suppressed precious metals prices and created conditions historically associated with eventual sharp currency corrections.
- Western investor sentiment toward gold and silver has reached levels of pessimism that historically precede, rather than confirm, major bull market phases in precious metals.
- The accumulation of physical gold by Chinese institutional and retail buyers, occurring simultaneously with Western disinterest, represents a structural demand dynamic with significant long-term price implications.
The current environment presents a historically unusual convergence: the most expensive sovereign bond and equity markets by multiple long-run valuation measures, a reserve currency trading above fundamental value, and precious metals sentiment at cyclical lows despite record monetary expansion. History suggests each of these conditions is self-correcting. The central analytical question is not whether repricing will occur, but through which mechanism and over what timeframe.
Whether through gradual normalisation, inflation-driven forced repricing, or a discrete shock event, the weight of historical evidence suggests that markets priced this far from fundamental value carry asymmetric risk. For investors seeking to understand and navigate the most mispriced markets in 56 years, the analytical framework provided by five decades of market observation offers a structured starting point for portfolio thinking in a period of genuine structural uncertainty.
This article is intended for informational and educational purposes only. Nothing contained herein constitutes financial advice, investment recommendations, or a solicitation to buy or sell any financial instrument. Readers should conduct their own independent research and consult qualified financial advisors before making any investment decisions. Past market behaviour is not a reliable indicator of future performance.
Want to Profit From the Next Major Mineral Discovery Before the Market Catches On?
While macro dislocations reshape the investment landscape, Discovery Alert's proprietary Discovery IQ model cuts through the noise by delivering real-time alerts on significant ASX mineral discoveries — instantly turning complex geological data into actionable opportunities for both short-term traders and long-term investors. Explore historic discoveries and the returns they generated, then begin your 14-day free trial at Discovery Alert to position yourself ahead of the broader market.