August 11, 2026
The Ratio That Leads the Commodity Herd: Understanding Silver's Relative Signal
Commodity cycles rarely announce themselves with clarity. They build quietly beneath the surface, often revealing themselves first through relative-value relationships rather than absolute price moves. Among the most reliable of these inter-market signals is the silver to gold ratio bullish dynamic, a deceptively simple calculation that carries outsized predictive weight across precious metals, critical minerals, and broader risk-asset markets. Understanding why this ratio moves, and what happens across asset classes when it turns, is increasingly important for investors navigating an environment defined by fiscal expansion, currency debasement pressure, and a structural shift toward hard assets.
When big ASX news breaks, our subscribers know first
What the Silver-to-Gold Ratio Actually Measures
Defining the Ratio as a Relative-Value Thermometer
The gold-silver ratio analysis is calculated by dividing the silver price by the gold price. When the result rises, silver is outperforming gold on a relative basis. When it falls, gold is leading. While the number itself is straightforward, the implications embedded in its direction are anything but simple.
Silver occupies a rare dual position in the commodity universe. It functions simultaneously as a monetary metal, storing value alongside gold during inflationary or currency-stress periods, and as an industrial metal with deep demand exposure to solar panels, electronics, electric vehicles, and medical applications. This duality makes silver far more sensitive to changes in global economic momentum than gold, which behaves more purely as a monetary and safe-haven asset.
The silver-to-gold ratio is not a price predictor in isolation. It is a relative-value signal that reflects shifting risk appetite, monetary conditions, and commodity cycle positioning. A falling ratio, where silver outperforms gold, is often treated as confirmation of a broadening precious metals bull market. A rising ratio, by contrast, tends to indicate a defensive, gold-dominated regime.
Why Direction Matters More Than the Level Alone
Most analysts fixate on the ratio's level, asking whether silver is cheap or expensive relative to gold. However, experienced macro practitioners argue that the direction of the ratio carries more actionable intelligence than the level itself. A ratio sitting at 80 but trending lower is a fundamentally different signal from a ratio at 80 that is grinding higher.
Direction reveals the market's underlying risk posture. A falling ratio from elevated levels signals that investors are rotating away from pure monetary protection and toward assets with industrial exposure, which historically occurs as economic momentum builds, fiscal stimulus flows through the system, and currency devaluation expectations rise.
The 70-80 Threshold: What Elevated Readings Have Historically Signalled
Most technical and macro analysts treat ratio readings above 70-80 as a zone where silver is historically undervalued relative to gold. The most extreme outlier on record was March 2020, when the ratio briefly spiked above 120 as acute liquidity panic crushed silver's industrial demand component. That extreme level was followed by one of silver's sharpest multi-month rallies in modern market history, compressing the ratio dramatically as the commodity cycle reasserted itself.
Readings above 90-100 represent structural distortions, typically associated with recession fears or financial market dislocations, not sustainable long-term equilibria. Mean reversion from these levels has historically been rapid and powerful once the directional catalyst appears. Furthermore, understanding silver versus gold performance across previous cycles provides important context for interpreting these extremes.
How a Bullish Silver-to-Gold Ratio Functions as a Leading Indicator
Silver's Bottoming Pattern as a Pre-Rally Signal for Commodities
One of the lesser-understood dynamics in commodity markets is the sequencing of recoveries. Precious metals, and particularly gold miners, tend to lead the broader commodity complex out of cyclical troughs. Gold advances first, often during periods of macro uncertainty when its safe-haven characteristics attract capital. Silver then follows, and as it begins outperforming gold on a relative basis, the ratio confirms that the rally is broadening beyond pure monetary demand into industrial and risk-appetite territory.
This sequencing was visible in 2025, when silver underperformed gold significantly before basing and then recovering. That base formation preceded a broader commodity and equity market recovery across multiple sectors. The same pattern is now visible in 2026 data, where silver has spent approximately six months underperforming gold, compressing speculative positioning and rebuilding structural demand foundations.
From Precious Metals to the Broader Commodity Complex
The transmission mechanism from silver outperformance to broader commodity strength operates through several interconnected channels:
- When silver strengthens relative to gold, it signals improving industrial demand expectations, which benefits base and specialty metals broadly
- The currency devaluation conditions that typically drive silver outperformance also reduce the real cost of commodity production inputs priced in local currencies, supporting producer margins and exploration activity
- Rising precious metals prices attract capital into the mining sector generally, lifting junior and mid-tier explorers across copper, uranium, nickel, lithium, rare earth elements (REEs), and platinum group metals (PGMs)
- Risk appetite returning to silver often represents a broader shift from defensive asset classes toward real assets, which historically cascades into commodity equity outperformance
Ratio Interpretation Framework:
| Ratio Level | Ratio Direction | Market Signal | Typical Implication |
|---|---|---|---|
| Above 80 | Rising | Gold dominance | Defensive regime; silver cheap but not yet moving |
| Above 80 | Falling | Silver breakout | Broad commodity rally likely; risk appetite returning |
| 60-80 | Falling | Silver outperformance | Mid-cycle commodity expansion; industrial demand rising |
| Below 60 | Falling | Silver momentum peak | Late-stage rally; rotation back toward gold may approach |
| Below 60 | Rising | Gold re-accumulation | Risk-off shift; commodity cycle potentially topping |
Critical Minerals in the Slipstream
A particularly important nuance for investors tracking the silver to gold ratio bullish signal is its relationship with critical mineral markets. Copper, uranium, nickel, REEs, lithium, and PGMs do not respond immediately to changes in precious metals, but historically they follow with a lag. When silver begins outperforming gold after an extended consolidation, commodity analysts treat this as an early signal to begin monitoring critical mineral producers and explorers for breakout setups.
Notably, crude oil is frequently excluded from this framework. Oil prices are more directly influenced by geopolitical disruptions and supply cartel decisions, which can overwhelm the monetary and fiscal transmission mechanisms that drive the ratio signal. The critical minerals and energy transition dynamic makes these assets a more reliable beneficiary of the ratio-driven commodity cycle than energy commodities themselves.
What Extended Silver Underperformance Actually Creates
Six Months of Correction as a Foundation, Not a Failure
Counter-intuitively, prolonged silver underperformance relative to gold is not a bearish development for silver over the medium term. It is a clearing mechanism. As Gary Tanashian, founder and editor of Notes from the Rabbit Hole (NFTRH), has argued in analysis published at Gold-Eagle.com, precious metals bulls who endure extended correction periods are effectively having risk ground out of their positions, which creates the conditions for asymmetric recovery potential.
The 2026 silver correction, which has persisted for approximately six months as of mid-August 2026, has:
- Eliminated most leveraged speculative long positions
- Reset sentiment indicators to pessimistic extremes
- Allowed moving averages to flatten, reducing the overhead supply resistance
- Created a technical base that future buyers face at lower structural cost
RSI Divergence as a Technical Precursor to Ratio Reversals
One technical signal that analysts monitor closely when watching for silver-to-gold ratio inflection points is the Relative Strength Index (RSI) applied to the ratio itself, not the individual metals. When the ratio is making new lows or holding at depressed levels while RSI is forming higher lows, this momentum divergence suggests that selling pressure is exhausting itself even if the price relationship has not yet reversed.
As of mid-2026, RSI applied to the silver-to-gold ratio is signalling that a rebound may arrive sooner rather than later, according to macro analysis published at Gold-Eagle.com. Gold stocks have begun breaking out broadly, and various critical mineral equities have started advancing, which historically represents the early-stage conditions that precede silver's outperformance of gold.
Extended periods of silver underperformance relative to gold historically function as pressure-release valves, compressing speculative excess and rebuilding structural demand foundations. When silver eventually re-engages to the upside, the catch-up move tends to be sharper and faster than the initial gold advance.
Fiscal Policy, Liquidity Cycles, and the Ratio's Macro Foundations
The Stimulus-to-Devaluation Transmission Chain
The most powerful macro driver of a silver to gold ratio bullish environment is fiscal expansion combined with monetary accommodation. The sequence that analysts track follows a recognisable chain reaction:
- Fiscal stimulus initiates through legislative spending, tax policy changes, or deregulated bank lending that expands credit into the real economy
- Inflation expectations rise as additional money competes for the same supply of goods and services
- Real interest rates decline or remain suppressed, reducing the opportunity cost of holding non-yielding assets like gold and silver
- The USD softens as purchasing power erosion becomes priced into currency markets
- Gold advances as the primary monetary hedge, attracting institutional capital first
- Silver outperforms gold as industrial demand recovers and risk appetite expands beyond monetary safe-haven positioning
- The broader commodity complex follows, with critical mineral producers and explorers among the later-stage but often highest-leverage beneficiaries
Current macro conditions, including deregulated bank lending expanding credit supply, large fiscal spending legislation in play, and the potential for Treasury market liquidity management by policymakers, closely resemble the conditions that have historically triggered this sequence. Currency devaluation is, as Tanashian has noted in his published analysis, the oldest macro tailwind for precious metals in existence.
Dollar Headwind Dynamics
A bullish silver-to-gold ratio carries an important secondary implication for USD holders:
- Silver's dual monetary and industrial role makes it particularly sensitive to currency depreciation relative to gold
- When the ratio turns bullish, it frequently coincides with measurable USD weakness across major currency pairs
- Fiscal expansion and credit growth reduce the relative scarcity of currency, which historically pressures purchasing power
- For international commodity producers, a weaker USD translates directly into higher effective commodity prices even without nominal price increases
The Gold-to-SPX Ratio: Reading Stocks Against Real Money
Why Equities Can Rise Nominally While Losing to Gold
One of the most misunderstood concepts in macro investing is the difference between nominal and real asset performance. The gold-to-stock relationship, which compares the gold price against the S&P 500 index (commonly tracked using GLD vs. SPY), provides a risk-adjusted view of whether equities are actually generating wealth or simply maintaining purchasing power in a devaluing currency environment.
Stocks can rise significantly in nominal terms during periods of fiscal stimulus while simultaneously delivering negative real returns when measured against gold. This is precisely the scenario that macro analysts are anticipating for the 2026-2027 window. Nominal equity markets may sustain bullish momentum into the mid-term election cycle, supported by liquidity and fiscal conditions. However, the Gold-to-SPX ratio may reassert structural dominance thereafter, reflecting a regime where gold increasingly outperforms equities on a real-return basis.
Scenario Framework by Time Horizon:
| Time Horizon | Equity Outlook | Gold Outlook | Silver-to-Gold Ratio | Macro Driver |
|---|---|---|---|---|
| Near-term (pre-election) | Bullish nominally | Consolidating, low-risk base | Elevated but potentially turning | Fiscal stimulus, deregulated credit |
| Medium-term (post-election) | Sustained but softening | Outperforming stocks in real terms | Turning bullish, ratio falling | Currency devaluation, inflation expectations |
| Longer-term (2027 horizon) | Nominally flat to rising, underperforming gold | Structurally dominant | Silver outperformance well established | USD erosion, commodity cycle maturity |
Stocks may not go bearish in nominal terms, but based on current macro trajectory analysis, they face significant risk of vastly underperforming gold on a relative basis through the 2027 horizon.
The next major ASX story will hit our subscribers first
Which Asset Classes Benefit Most When the Ratio Turns
A Sensitivity Ranking Across Asset Types
Not all assets respond equally when the silver-to-gold ratio turns bullish. Understanding the sensitivity hierarchy helps investors position with appropriate sizing and timing. According to historical ratio data available at Investopedia, these cycles have repeated across multiple decades with consistent patterns.
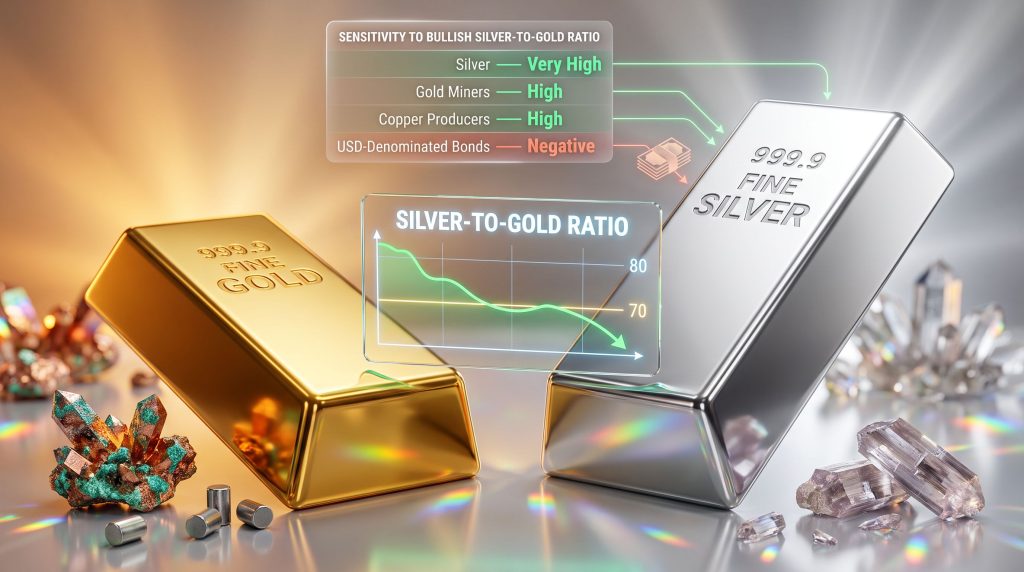
Beneficiary Asset Class Ranking by Sensitivity to a Bullish Silver-to-Gold Ratio:
| Asset Class | Sensitivity Level | Typical Lead/Lag | Key Driver |
|---|---|---|---|
| Silver (physical and ETFs) | Very High | Coincident | Direct ratio component |
| Silver miners and royalty companies | Very High | Slight lag | Operating leverage to silver price |
| Gold miners (mid and large cap) | High | Leading | Often break out before ratio turns |
| Copper producers | High | Slight lag | Industrial demand plus monetary tailwind |
| Uranium and REE explorers | Moderate to High | Variable | Critical mineral cycle correlation |
| Broad equity indices | Low to Moderate | Coincident (short-term) | Liquidity-driven, not ratio-driven |
| USD-denominated bonds | Negative | Coincident | Currency devaluation headwind |
Gold Miners as the Early Confirmation Signal
Gold mining equities typically lead both the gold price and the broader commodity sector at cycle turning points. Their leverage to the underlying metal price means they respond quickly to improving margin conditions, even before those conditions are fully reflected in commodity spot prices. As of mid-August 2026, gold stocks are reportedly breaking out broadly, which historically functions as an early-cycle confirmation that the precious metals complex is transitioning from correction to expansion phase.
Critical Minerals as the High-Leverage Late Entrants
Copper, uranium, nickel, lithium, REEs, and PGMs represent the furthest point along the commodity transmission chain from the silver-to-gold ratio signal, but they also frequently offer the highest leverage returns once the cycle fully engages. Furthermore, explorers and junior producers in these sectors often remain overlooked until the rally is well-established in precious metals, creating opportunities for investors who identify the sequence early. Understanding the broader gold and silver markets context helps investors frame these opportunities within a coherent macro picture.
A Practical Framework for Applying the Silver-to-Gold Ratio
Step-by-Step: Building a Ratio-Based Positioning Approach
- Establish the baseline level — Determine whether the current ratio sits above or below the historical 70-80 mean-reversion threshold to assess the degree of silver's relative undervaluation
- Assess the direction — Identify whether the ratio is trending higher toward gold dominance, or lower toward silver outperformance, using both price action and moving average relationships
- Confirm with RSI divergence — Look for momentum indicators showing exhaustion in the ratio's prevailing trend direction, particularly bullish divergence where the ratio makes lower lows while RSI forms higher lows
- Cross-reference with the Gold-to-SPX ratio — A simultaneously declining Gold-to-SPX ratio approaching a major support level combined with an elevated silver-to-gold ratio creates a high-conviction setup for precious metals outperformance
- Identify commodity transmission signals — Monitor critical mineral equities, particularly copper, uranium, and REE producers, for early breakout patterns that confirm the broader commodity cycle is engaging
- Size positions according to cycle phase — Early-cycle entries when the ratio is still elevated but RSI is turning carry more asymmetric upside; late-cycle entries when the ratio is compressing rapidly require tighter risk management discipline
Risk Warning: The silver-to-gold ratio is a relative indicator. Both metals can decline simultaneously during acute liquidity crises, as occurred in March 2020, temporarily distorting ratio-based signals. Ratio analysis should always be combined with absolute price trend confirmation before acting on positioning decisions.
Key Risks to the Bullish Silver-to-Gold Thesis
Four Scenarios That Could Derail the Signal
No ratio-based framework is infallible. Investors tracking the silver to gold ratio bullish signal as a commodity cycle indicator should remain alert to these four primary risk scenarios:
- Renewed USD strength — If geopolitical safe-haven demand or a hawkish monetary policy shift drives the dollar higher, the devaluation narrative that supports silver outperformance would be disrupted, potentially extending gold's relative dominance
- Industrial demand contraction — A sharp deterioration in manufacturing activity, particularly in China which accounts for a significant share of global silver industrial demand, could suppress silver's ability to outperform gold even in a monetary tailwind environment
- Geopolitical commodity shocks — Particularly in oil, large price dislocations driven by conflict or supply disruption can distort cross-asset correlations and temporarily overwhelm the ratio's predictive signal
- Broad equity market correction triggering commodity liquidation — If equity markets sell off sharply before the ratio has fully confirmed its directional reversal, forced margin selling could temporarily depress silver alongside other risk assets, resetting the signal
Frequently Asked Questions: Silver-to-Gold Ratio Bullish Signals
What does it mean when the silver-to-gold ratio turns bullish?
A bullish silver-to-gold ratio typically refers to a falling ratio, meaning silver is rising faster than gold or declining more slowly. This is widely interpreted as a signal that risk appetite is expanding, commodity cycles are broadening, and monetary conditions may be loosening. Historically, a falling ratio from elevated levels above 70-80 has preceded significant rallies across precious metals and related industrial commodities.
What ratio level is considered historically elevated?
Most technical and macro analysts treat readings above 70-80 as indicating silver is undervalued relative to gold on a historical basis. Readings exceeding 90-100, as seen in March 2020, are considered extreme outliers and have historically preceded sharp silver outperformance phases. For those wishing to monitor this in real time, live ratio tracking tools provide up-to-date charting of the silver-to-gold relationship.
Does a high silver-to-gold ratio always mean silver will rally?
Not necessarily. A high ratio signals relative undervaluation, but silver requires a directional catalyst such as improving industrial demand, USD weakness, or a broader commodity cycle expansion to actually close the gap. The ratio level sets the structural conditions while the direction of the ratio confirms the move is underway.
Can the ratio predict stock market performance?
Indirectly. A falling silver-to-gold ratio often coincides with broadening risk appetite, which can support equity markets in the short term. Over longer timeframes, however, a sustained bullish silver-to-gold ratio environment often correlates with gold outperforming equities on a real, inflation-adjusted basis, even if nominal stock prices continue rising.
How does the ratio relate to the US dollar?
The two share an inverse relationship across most macro regimes. A falling silver-to-gold ratio, reflecting silver outperformance, tends to coincide with USD weakness as both metals benefit from currency devaluation expectations. Fiscal expansion and monetary easing policies that erode real purchasing power are historically among the most powerful drivers of a bullish silver-to-gold ratio environment.
The 2026-2027 Macro Verdict: Where the Signals Point
Synthesising the Technical and Macro Picture
The current environment, as of mid-August 2026, presents a confluence of conditions that macro analysts have historically associated with the early stages of a silver-to-gold ratio reversal. Gold stocks are breaking out broadly. Critical mineral equities are beginning to advance. Fiscal and credit conditions are expanding. The RSI applied to the silver-to-gold ratio is showing early signs of momentum exhaustion on the bearish side.
Whether the full reversal occurs immediately or consolidates through the mid-term election period before asserting itself, the structural conditions appear aligned. The key insight from top-down macro analysis is that the asset classes least exposed to the ratio signal, particularly USD-denominated bonds and pure growth equities, face the most challenging relative return environment in this scenario, while hard assets, precious metals producers, and critical mineral companies sit in the most favourable structural position.
Why the Next Commodity Wave May Be Broader Than the Last
The critical mineral dimension of this cycle carries particular significance. The global energy transition, regardless of the pace of policy implementation in any given jurisdiction, represents a structural source of demand for copper, lithium, nickel, REEs, and PGMs that did not exist at the same scale in previous commodity cycles. When the silver-to-gold ratio turns bullish and the commodity transmission mechanism activates, these critical mineral markets stand to benefit not only from the cyclical monetary tailwind but also from durable structural demand growth. That combination of cyclical and structural demand drivers is what distinguishes the current setup from historical analogies and potentially amplifies the magnitude of the coming move.
Readers seeking additional macro perspectives on precious metals cycle analysis and the silver-to-gold ratio framework may find value in exploring commentary published at Gold-Eagle.com, which regularly features independent market analysis covering gold, silver, and broader commodity trends.
This article is intended for informational and educational purposes only and does not constitute financial advice. All investment decisions carry risk, including the potential loss of capital. Past performance of ratio-based indicators does not guarantee future results. Readers should conduct their own due diligence and consult a qualified financial adviser before making investment decisions.
Want to Catch the Next Major Mineral Discovery Before the Market Does?
When the silver-to-gold ratio turns bullish and the commodity transmission cycle activates, the highest-leverage opportunities often emerge in ASX-listed explorers and junior producers — and timing is everything. Discovery Alert's proprietary Discovery IQ model delivers real-time alerts on significant ASX mineral discoveries the moment they are announced, transforming complex geological data into actionable insights for both traders and long-term investors — start your 14-day free trial today, or explore historic discoveries and their returns to understand just how transformative early positioning in a major find can be.