July 25, 2026
The Quiet Superpower of European Energy: Why Norway Keeps Defying Expectations
In global energy markets, reliability is not glamorous. It does not generate the same headlines as a Middle Eastern supply shock, an OPEC+ emergency meeting, or a geopolitical flashpoint threatening tanker routes through contested straits. Yet reliability is arguably the most valuable attribute a major energy producer can possess, particularly in an era defined by structural uncertainty, oil price volatility, and the accelerating retreat of Russian hydrocarbons from European markets. Norway has quietly built a reputation as the most dependable large-scale energy supplier on the planet, and the production data coming out of the Norwegian Continental Shelf in 2026 is reinforcing that reputation month after month.
When big ASX news breaks, our subscribers know first
Norway Oil Output Beats Forecasts: The Numbers Behind the Trend
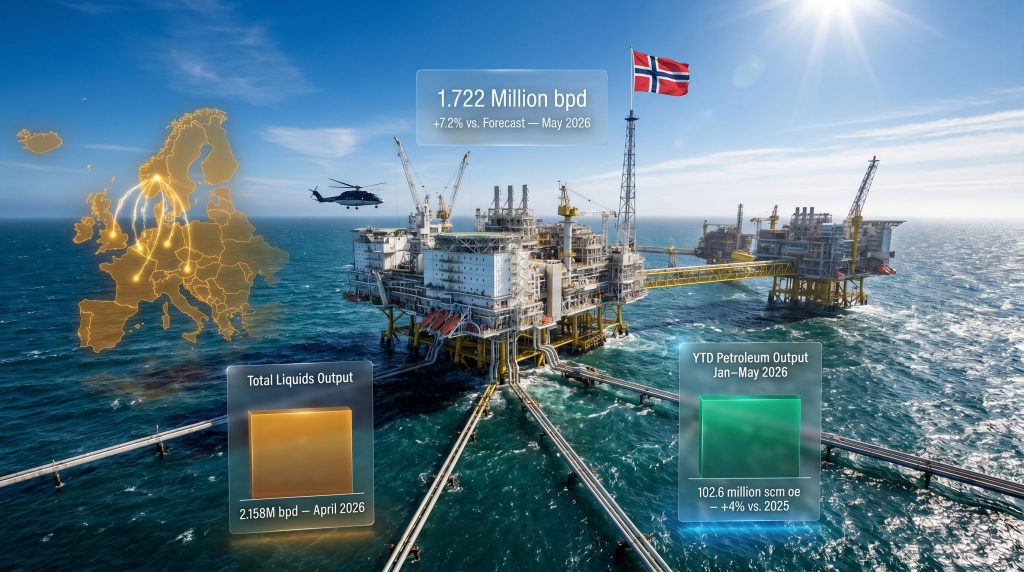
Preliminary figures published by the Norwegian Offshore Directorate confirm that Norway oil output beats forecasts for yet another consecutive reporting period. Crude oil production averaged 1.722 million barrels per day in May 2026, landing 7.2% above the official forecast despite representing a pullback from April's exceptionally elevated result of 1.952 million barrels per day.
Total liquids, encompassing crude alongside natural gas liquids and condensate, averaged 1.909 million barrels per day in May, compared with 2.170 million barrels per day the month prior. Total petroleum output came in 2.9% above official forecasts even after accounting for the month-on-month moderation.
The following table summarises the key production metrics across the two most recent reporting periods:
| Metric | April 2026 | May 2026 | Forecast Beat |
|---|---|---|---|
| Crude Oil Output (bpd) | 1.952 million | 1.722 million | +7.5% (Apr) / +7.2% (May) |
| Total Liquids Output (bpd) | 2.170 million | 1.909 million | +6.7% (Apr) / +2.9% (May) |
| Natural Gas Output (mcm/day) | 340 million | 303 million | Broadly in line (May) |
| YTD Petroleum Output (Jan–May 2026) | 102.6 million scm oe | +4% vs. Jan–May 2025 |
Source: Norwegian Offshore Directorate (SODIR) production figures, May 2026
The year-to-date picture is equally compelling. Total petroleum production across the first five months of 2026 reached 102.6 million standard cubic meters of oil equivalent, a figure that sits approximately 4% higher than the equivalent period in 2025. This trajectory places the Norwegian Continental Shelf on a path that could challenge multi-year production records if the second half of 2026 sustains anything close to the outperformance seen through H1.
Understanding Why Official Forecasts Keep Getting Beaten
A question worth examining carefully is why Norway's official forecasts are being missed to the upside so consistently. The Norwegian Offshore Directorate, known as SODIR, generates its monthly production forecasts using a field-by-field decline modelling methodology. Each producing field is assessed individually based on historical well performance, expected natural decline rates, planned maintenance schedules, and anticipated operational efficiency.
The challenge embedded in this approach is structural: conservative assumptions about well productivity and reservoir recovery rates tend to underestimate output during periods of strong operational execution. When fields perform above their modelled decline curves, as has been the case across several key Norwegian Continental Shelf assets in 2026, the aggregate gap between forecast and actual output widens systematically.
Key Insight: The consistent pattern of forecast underperformance by SODIR is not a modelling failure in the conventional sense. It reflects the deliberate use of conservative assumptions that prioritise downside protection over precision. In a mature basin where legacy fields are producing at rates above their predicted decline trajectories, conservative modelling creates a persistent upside bias in actual outcomes versus official projections.
This methodology distinction matters for energy market participants. When a producer consistently delivers above the official forecast, that gap carries genuine signal value. It suggests that the underlying reservoir performance and operational efficiency on the Norwegian Continental Shelf are running ahead of what even the regulatory authority expects.
The Oil vs. Gas Divergence: Reading What the Data Is Telling Markets
One of the more analytically interesting features of Norway's May 2026 production data is the divergence between crude oil and natural gas performance relative to official forecasts.
Crude oil delivered a 7.2% outperformance against SODIR's official forecast, continuing a pattern of meaningful and repeated positive surprises that has characterised 2026.
Natural gas output of 303 million cubic meters per day came in broadly aligned with official expectations, representing a decline from April's 340 million cubic meters per day without generating a significant forecast miss.
Several factors explain this divergence:
-
Gas production on the Norwegian Continental Shelf is subject to deliberate scheduling adjustments linked to European seasonal demand patterns. During spring and early summer, as heating demand falls and European gas markets ramp up storage refill campaigns, production scheduling tends to normalise rather than maximise output.
-
Crude oil production is driven more directly by continuous reservoir drainage, meaning short-term scheduling flexibility is lower and operational performance relative to the reservoir model is the primary variable.
-
The maintenance cycle on major gas infrastructure, including processing trains and pipeline export systems, introduces additional variability in gas volumes that does not affect crude in the same way.
The practical implication is that crude oil's persistent outperformance against forecasts is the more structurally meaningful signal, while gas performance aligned with forecasts indicates normal operational management rather than any underlying weakness.
Johan Sverdrup and Troll: The Twin Pillars of NCS Resilience
No analysis of Norwegian Continental Shelf performance is complete without examining the two fields that anchor the entire production system.
Johan Sverdrup: Europe's Largest Producing Oil Field
Johan Sverdrup holds the distinction of being the largest producing oil field in Europe, and its contribution to Norwegian crude volumes is decisive. Located in the North Sea approximately 160 kilometres west of Stavanger, the field reached its Phase 2 production capacity following major infrastructure additions that structurally lifted the NCS production ceiling.
What makes Johan Sverdrup particularly important from a reliability perspective is its combination of:
-
Very low breakeven cost, estimated to be among the lowest of any large-scale offshore oil field globally, providing production stability across a wide range of oil price environments
-
High recovery rate targets, enabled by advanced water injection technology and reservoir management techniques that sustain plateau production for longer than conventional field development models would predict
-
Extensive subsea infrastructure, which minimises unplanned downtime by reducing the frequency of surface intervention required for well management
Operated by Equinor, Johan Sverdrup is a direct contributor to Norway's pattern of above-forecast production, as its consistent performance offsets natural decline on smaller, older fields across the shelf.
Troll: The Continent's Gas Security Anchor
On the gas side, the Troll field occupies a position of extraordinary strategic importance. Troll supplies approximately one in every ten cubic meters of natural gas consumed across Europe, a figure that underscores just how consequential its operational performance is for continental energy balances.
The field's long-term plateau production profile, maintained through decades of careful reservoir management and phased development, provides European gas markets with a level of supply predictability that few other sources can match. Its pipeline connections into the European grid, including links to the United Kingdom, Germany, Belgium, and France, create multiple pathways for gas delivery that reduce systemic risk compared with liquefied natural gas supply chains that depend on tanker availability and regasification capacity.
How Norway Compares to Other Major Non-OPEC Producers
To understand the strategic value of Norway's production reliability, it is useful to benchmark the Norwegian Continental Shelf against peer producers in terms of output trajectory, forecast accuracy, and geopolitical risk profile.
| Producer | 2026 Output Trend | Forecast Accuracy | Geopolitical Risk | European Supply Role |
|---|---|---|---|---|
| Norway | Consistently above forecast | High | Very Low | Primary |
| United Kingdom (North Sea) | Declining | Moderate | Low | Secondary |
| United States | Growing (shale-driven) | Variable | Low to Medium | LNG exporter |
| Russia | Sanctioned and constrained | Low transparency | Very High | Significantly diminished |
| Algeria | Broadly stable | Moderate | Medium | Supplementary |
Several features of this comparison stand out. Norway is the only major European-adjacent producer simultaneously delivering above-forecast output, maintaining very low geopolitical risk, and serving as a primary rather than supplementary supplier to European markets. The United Kingdom's North Sea continues a structural decline trajectory that even significant investment has not reversed. Russia's supply role has contracted dramatically following sanctions imposed after 2022, and its production data lacks the transparency required for reliable market planning.
The next major ASX story will hit our subscribers first
What Norway's Output Means for European Energy Security
The broader context for Norway's production performance is Europe's ongoing effort to restructure its energy supply base following the withdrawal of Russian hydrocarbons from the market. That restructuring has elevated Norway from an important supplier to an indispensable one.
The pipeline network connecting Norwegian Continental Shelf fields to European terminals is extensive and operationally proven. Crude oil and natural gas flow through infrastructure linking offshore assets to receiving terminals in the United Kingdom, Germany, Belgium, and France, creating a degree of supply redundancy that pipeline-connected systems enjoy over LNG-dependent alternatives.
Strategic Context: Norway's reliability premium has become one of the most sought-after attributes in European energy procurement. In a market where geopolitical shocks, OPEC+ production decisions, and infrastructure disruptions regularly create supply uncertainty, consistent above-forecast delivery from a politically stable producer carries a value that goes beyond simple volume considerations.
Furthermore, global oil supply shocks linked to trade tensions and geopolitical disruptions have made the predictability of Norwegian output even more commercially and strategically significant for European energy buyers seeking reliable long-term contracts.
The OPEC+ dimension adds another layer of complexity. As the producer group manages its gradual production restoration process, non-OPEC suppliers that consistently deliver above expectations help moderate the degree to which OPEC+ decisions dominate global supply balances. Norway's role in this context is to provide a stabilising counterweight, reducing the market's exposure to coordinated supply management by the cartel.
H2 2026 Production Scenarios: Is a Record Year Within Reach?
With year-to-date production tracking 4% ahead of 2025 through May, the question for energy market participants is whether the second half of 2026 can sustain sufficient momentum to deliver a standout annual result.
The following scenario framework captures the range of plausible outcomes:
| Scenario | Core Assumption | H2 2026 Implication | Full-Year Outcome |
|---|---|---|---|
| Base Case | Seasonal normalisation, no major unplanned outages | Output broadly aligned with SODIR forecasts | Modest year-on-year growth |
| Upside Case | Continued field outperformance, minimal downtime | 5 to 8% above SODIR forecasts | Potential record-setting year |
| Downside Case | Significant unplanned maintenance or weather disruption | Output falls below SODIR forecasts | Flat or marginally negative year-on-year |
Several risk factors could shift outcomes toward the downside case:
-
Planned summer maintenance shutdowns on major NCS fields, which are a normal feature of the operating calendar but can concentrate production losses within specific months
-
Weather-related operational constraints in the Norwegian Sea, where autumn storm seasons can temporarily affect offshore operations
-
Skilled workforce availability, as the NCS competes with other offshore basins globally for experienced drilling and production personnel
-
New well completion timelines, which are subject to both technical and regulatory factors that can shift output timing across quarters
On the upside, development projects including Johan Castberg and the longer-dated Wisting prospect in the Barents Sea represent potential additions to the NCS production portfolio that institutional energy analysts increasingly factor into their long-term output models. These projects, combined with infrastructure-led exploration activity designed to extend the productive life of existing field clusters, support a view that the NCS production plateau has more longevity than simple decline-curve analysis would suggest.
The Investment and Market Signal Embedded in NCS Data
For energy market participants, the monthly Norwegian Offshore Directorate production figures serve a function that extends beyond simple supply accounting. Consecutive months of above-forecast output from one of the world's most technically sophisticated offshore producing basins carry information about reservoir performance, operational efficiency, and the credibility of field-level production models.
When Norway oil output beats forecasts repeatedly, it suggests that:
-
Reservoir recovery rates on key NCS fields are performing at or above model predictions, which has implications for long-term reserve estimates
-
Subsea and topside operational efficiency is running at high levels, reducing unplanned downtime to below the rates embedded in conservative forecast assumptions
-
The NCS production plateau may extend further into the 2030s than pessimistic decline models imply, a material consideration for European energy security planning over decadal timeframes
Norway's dual role as both a major fossil fuel producer and a leading investor in offshore wind technology adds a further dimension to the long-term picture. The country is simultaneously sustaining hydrocarbon output to fund Norway's sovereign wealth fund, the world's largest by assets under management, while investing in the clean energy infrastructure that will eventually reduce European dependence on those same hydrocarbons. This structural duality creates a uniquely stable long-term investment environment for NCS-adjacent assets.
Frequently Asked Questions About Norway's Oil Production
Why does Norway oil output beat forecasts so consistently?
Norway's pattern of above-forecast production reflects a combination of world-class reservoir engineering, conservative modelling assumptions by the Norwegian Offshore Directorate, and the stabilising effect of large anchor fields like Johan Sverdrup operating at or above design capacity. When the NOD generates forecasts using conservative well productivity assumptions, periods of strong operational execution naturally produce positive surprises against the official baseline.
What is Norway's current daily crude oil production rate?
According to offshore production data published by industry analysts, Norway produced an average of 1.722 million barrels of crude oil per day in May 2026. Including natural gas liquids and condensate, total liquids averaged 1.909 million barrels per day over the same period.
How important is Norway to European natural gas supply?
Norway is the single largest pipeline gas supplier to Europe. The Troll field alone accounts for approximately 10% of all natural gas consumed across the European continent, making it one of the most strategically consequential individual energy assets in the world. Norwegian gas reaches European markets through an extensive network of subsea pipelines that have no equivalent in terms of throughput reliability among alternative supply sources.
How does Norway's production compare to OPEC members?
Norway operates entirely outside the OPEC quota framework, meaning its production decisions are driven by commercial and technical factors rather than coordinated supply management agreements. In volume terms, Norway's crude output of approximately 1.7 million barrels per day places it above mid-tier OPEC producers such as Libya and Gabon, and at levels broadly comparable with Algeria and Nigeria, though with substantially greater production predictability than either of those producers typically delivers.
Disclaimer: This article is intended for informational and educational purposes only. It does not constitute financial or investment advice. Production forecasts, scenario projections, and market analysis involve inherent uncertainty, and actual outcomes may differ materially from those discussed. Readers should conduct their own due diligence before making any investment decisions. Production data referenced in this article is sourced from the Norwegian Offshore Directorate's preliminary May 2026 figures and is subject to revision.
Want to Stay Ahead of the Next Major Resource Discovery?
While Norway's consistent production outperformance highlights the value of reliability in energy markets, the real wealth-creation moments in resources often begin with a single significant discovery — and Discovery Alert's proprietary Discovery IQ model delivers real-time ASX mineral discovery alerts the moment they are announced, turning complex geological data into actionable investment insights. Explore historic examples of what major discoveries have returned and start your 14-day free trial at Discovery Alert to position yourself ahead of the broader market.