
May 15, 2026
The Hidden Architecture of an Oil Market Priced on Probability, Not Barrels
Energy markets have always responded to physical reality: how many barrels are produced, how many are in storage, how much demand exists this quarter. That framework dominated crude pricing for decades. However, something fundamentally different is happening in 2026. The variable traders are actually pricing is not supply volume. It is the probability that a single 33-kilometre-wide corridor between Iran and Oman remains open for business. When that probability shifts, oil moves. When it shifts back, oil moves again.
Inventory figures, drilling rig counts, and refinery utilisation rates have become secondary inputs. Understanding oil in the global economy has never been more important than now, as geopolitical chokepoints increasingly dictate pricing over physical supply fundamentals.
This psychological reframing of the crude market is essential context for understanding why oil eases on Iran ceasefire announcements rather than collapsing, why a 1.4% decline on May 13, 2026, followed a 3%-plus rally the day before, and why the Strait of Hormuz continues to hold global energy supply effectively hostage even when diplomatic language sounds promising.
When big ASX news breaks, our subscribers know first
Why the Strait of Hormuz Is Unlike Any Other Supply Variable
Most supply disruptions are gradual. A refinery goes offline. A pipeline springs a leak. An OPEC member undershoots its quota. These events create measurable, quantifiable deficits that markets absorb with relatively measured responses.
The Strait of Hormuz is categorically different because it is not a producer. It is a passage. The approximately one-fifth of all globally traded oil and liquefied natural gas that normally transits this narrow maritime corridor does not originate there. It passes through. That distinction matters enormously: when a producing region is disrupted, alternative producers can theoretically compensate. When a chokepoint is disrupted, there is no geographical substitute that can absorb equivalent volumes without severe cost and logistical penalties.
Since the conflict between the United States, Israel, and Iran escalated in late February 2026, Tehran's effective closure of the strait has produced a cumulative supply loss that Eurasia Group estimates has now exceeded 1 billion barrels. That is not a figure markets can quickly arbitrage away through spare capacity releases or inventory drawdowns. It represents a structural deficit that Eurasia Group believes will keep Brent crude prices above $80 per barrel for the remainder of 2026, regardless of how the diplomatic situation evolves. Furthermore, the complexities surrounding oil trade and geopolitics continue to shape how analysts interpret each new development from the region.
The Price Snapshot That Tells the Bigger Story
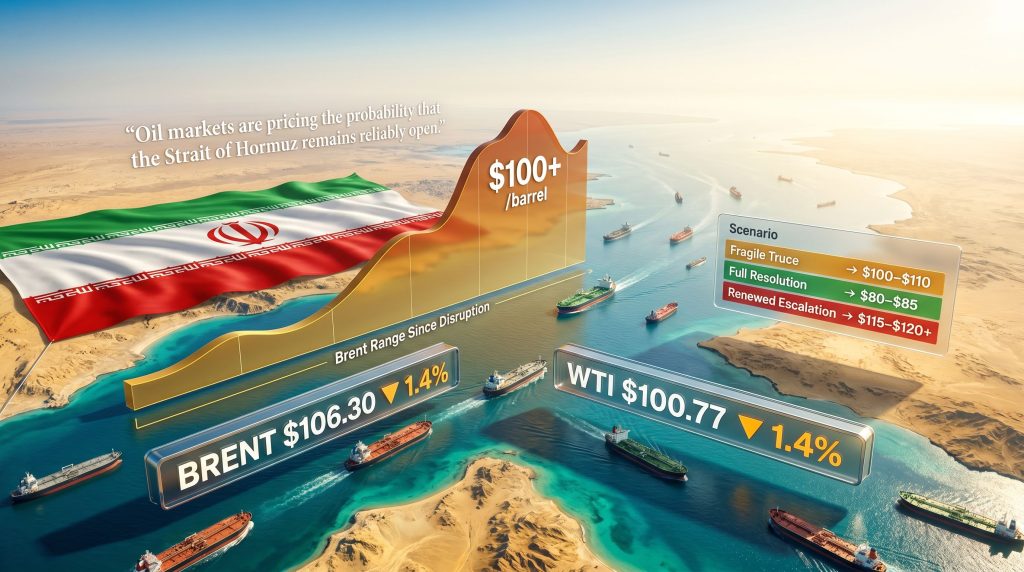
On May 13, 2026, at 09:30 Saudi time, the numbers told a story of controlled uncertainty rather than resolution:
| Benchmark | Price | Change |
|---|---|---|
| Brent Crude Futures | $106.30/barrel | Down $1.47 (1.4%) |
| WTI Crude Futures | $100.77/barrel | Down $1.41 (1.4%) |
Both benchmarks had hovered at or above the $100 per barrel mark since the US and Israel began military operations against Iran at the end of February. The May 13 pullback followed a 3%-plus rally on May 12 as ceasefire hopes faded and supply concerns reasserted themselves. The pattern is now well-established: prices climb when diplomatic prospects dim, and they ease modestly when negotiations appear to be moving forward. Neither direction is sustained, because neither direction is yet verified by physical reality.
The Ceasefire Credibility Gap: Why Diplomatic Headlines Move Markets Without Resolving Them
Understanding why oil eases on Iran ceasefire news without fully normalising requires appreciating a fundamental asymmetry in how markets process information. Diplomatic announcements are cheap to produce and expensive to verify. A statement from a foreign ministry carries very different evidentiary weight than confirmed vessel traffic data showing tankers moving freely through the Strait of Hormuz for consecutive weeks.
Markets in 2026 have experienced this cycle repeatedly since March. A diplomatic signal emerges. Algorithmic trading systems respond within seconds, pricing in the probability shift. Human traders assess credibility. Over hours or days, scepticism reasserts itself as verification fails to materialise. Prices partially reverse. The cycle restarts.
Priyanka Sachdeva, senior market analyst at Phillip Nova, characterised the market environment in terms that capture this dynamic precisely. According to Sachdeva, supply disruption concerns and Middle East uncertainty are keeping oil prices well-supported even as traders struggle to establish a clear direction. The market's sensitivity to every regional update is generating sharp, persistent swings, and any further escalation or direct threat to supply flows has the potential to quickly revive strong upside momentum across both Brent and WTI.
Market Psychology Note: What traders are actually pricing is not the ceasefire itself. They are pricing the probability distribution of Hormuz passage remaining open over the next three, six, and twelve months. A ceasefire announcement shifts that probability modestly upward. Verification would shift it substantially. Neither has occurred simultaneously.
Three Scenarios and Their Price Implications
| Scenario | Ceasefire Status | Hormuz Outcome | Brent Price Trajectory |
|---|---|---|---|
| Full diplomatic resolution | Durable, verified | Fully reopened | Gradual decline toward $80-$85 |
| Fragile truce (current state) | Unstable, contested | Partially constrained | Range-bound $100-$110 |
| Renewed escalation | Collapsed | Closed or heavily restricted | Spike above $115-$120+ |
The current market is priced squarely in the middle scenario. The 1.4% decline on May 13 is not evidence of de-escalation confidence. It is profit-taking after a short-term rally, combined with uncertainty about two simultaneous geopolitical variables: the ceasefire's durability and the Trump-Xi Beijing summit's implications for Iranian oil flows.
Trump, Xi, and the Iranian Oil Equation
China is the largest single buyer of Iranian crude, maintaining significant purchase volumes despite ongoing US sanctions pressure. This creates a three-way linkage between Washington's Iran policy, Beijing's energy import strategy, and global crude supply. Consequently, the Trump-Xi summit in Beijing on Thursday and Friday (May 15-16, 2026) represents a significant market variable in its own right.
President Trump stated publicly on May 13 that he does not anticipate needing China's assistance to bring the Iran conflict to a conclusion. This framing carries two simultaneous market signals. First, it implies a preference for bilateral US-Iran resolution, which could theoretically proceed faster without the complexity of triangulating Chinese interests. Second, it signals that Washington retains leverage over Beijing's Iranian oil purchases as a separate negotiating instrument, one that can be tightened or relaxed depending on Chinese cooperation on other trade dimensions.
Markets interpreted Trump's statement as reducing the near-term probability of a breakthrough, contributing to Wednesday's price softness. The summit remains a wildcard: previous US-China trade meetings have produced surprise commodity market movements through side agreements or informal frameworks that only became visible in trade data weeks later. In addition, the broader trade war impact on oil markets adds another layer of complexity to how summit outcomes translate into price movements.
What the Summit Could Change for Oil Supply
- A tougher US stance on Chinese purchases of sanctioned Iranian oil could reduce Iranian export volumes reaching global markets, tightening supply further
- A softer approach, perhaps in exchange for Chinese concessions on trade or technology, could provide partial supply relief without requiring Hormuz reopening
- Any coordinated framework on Iranian sanctions enforcement would represent a structural shift, not just a headline event
The US Economy Is Already Feeling the $100 Oil Effect
Sustained triple-digit oil prices are not merely an energy market phenomenon in 2026. They are feeding directly into the broader US economic picture through multiple transmission channels.
US consumer prices rose sharply for a second consecutive month in April 2026, producing the largest year-on-year inflation increase in nearly three years. The Federal Reserve is widely expected to hold interest rates steady in response, as cutting rates into an oil-driven inflationary environment carries significant credibility risk. Elevated borrowing costs then create their own drag: more expensive business credit reduces investment, tighter consumer financing suppresses discretionary spending, and the downstream effect on fuel demand begins accumulating with a typical lag of six to twelve months.
Capital Economics described the situation in terms that highlight the leading indicator problem facing policymakers. According to Capital Economics, the significant inflation increase across advanced economies has not yet caused real spending to actually contract, but the broad deterioration in consumer sentiment and falling hiring intentions is pointing toward worse conditions ahead.
American Petroleum Institute data showed US crude oil inventories falling for a fourth consecutive week, with distillate stocks also declining. Counterintuitively, consecutive inventory drawdowns at $100+ prices suggest demand has not yet meaningfully contracted. This is consistent with the six-to-twelve month demand destruction lag, meaning the full economic feedback from the current price environment is still building, not yet visible in consumption figures.
The Inflation-Rate-Demand Triangle
The interplay between these three forces creates a compounding challenge:
- High oil prices drive consumer inflation higher through fuel, freight, and manufacturing input costs
- Elevated inflation prevents the Federal Reserve from cutting interest rates, keeping borrowing costs high
- High borrowing costs suppress business investment and consumer credit, eventually reducing oil demand
- Reduced demand would normally ease prices, but the structural supply deficit from Hormuz disruption is absorbing that demand destruction effect
This cycle means price normalisation will take considerably longer than a straightforward ceasefire announcement would imply, even in the optimistic scenario.
Why Alternative Producers Cannot Simply Fill the Hormuz Gap
A common misconception is that OPEC spare capacity or US shale production could offset a Hormuz disruption if producers simply increased output. The reality, however, is far more constrained. OPEC's market influence is limited by physical headroom, regional instability, and timeline constraints that make rapid volume increases unrealistic.
| Producer | Key Constraint | Realistic Ramp Timeline |
|---|---|---|
| Saudi Arabia | Limited headroom above current output levels | 3-6 months |
| UAE | Partially affected by regional instability | 4-8 months |
| US Shale | Rig count constraints and financing cost pressures | 6-12 months |
| Russia | Operating under separate sanctions regime | Limited market access |
The cumulative 1-billion-barrel deficit that has already accumulated represents a supply hole that no combination of these producers can bridge within a 12-month window. This is the mathematical foundation of Eurasia Group's $80 price floor thesis for the remainder of 2026. Furthermore, the ongoing US shale drilling slowdown compounds the supply challenge, as financing pressures and rig constraints limit the sector's ability to respond quickly to elevated prices.
The Residual Friction Problem
Even after physical reopening, several layers of market friction would delay price normalisation:
- Marine insurance premiums remain elevated for extended periods after conflict zones reopen, as insurers price in residual risk of renewed disruption
- Mine-clearing operations require weeks of verified passage before vessel operators accept normalised transit risk
- Port congestion and backlogs built up during the closure period take additional weeks to clear
- Investor risk premiums embedded in forward curves persist until multiple months of uninterrupted passage demonstrate genuine stability
The next major ASX story will hit our subscribers first
What Energy Investors and Market Participants Should Actually Be Watching
Navigating this environment requires distinguishing between information that genuinely shifts the probability distribution and information that merely generates noise. The following indicators carry real signal value:
- Hormuz vessel passage rates: Daily tanker traffic through the strait as a direct, verifiable measure of whether supply is actually flowing. This leads all other indicators.
- Brent-WTI spread: Widening between the two benchmarks can signal regional disruptions affecting one market more acutely than the other, providing geographic supply disruption information.
- API and EIA inventory reports: Consecutive weekly drawdowns at current price levels indicate demand resilience; a reversal to builds would signal the early stages of demand destruction.
- Federal Reserve communications: Any shift in rate guidance in response to inflation data could alter the demand outlook significantly on a multi-month horizon.
- Trump-Xi summit communiques: Specific language around Iranian sanctions enforcement, not just general diplomatic tone, matters for the supply calculus.
Risk Framework: Investors with energy exposure should consider scenario-weighted positioning that accounts for all three ceasefire outcome models. The fragile truce scenario (current state) supports range-bound positioning between $100-$110 for Brent. The durable resolution scenario justifies hedging downside toward $80-$85. The escalation scenario requires upside protection above $115.
The Longer Arc: What This Crisis Is Revealing About Global Energy Architecture
Beyond the immediate price mechanics, the 2026 Hormuz disruption is functioning as a stress test for the entire structure of global energy supply. The results are revealing deep vulnerabilities that extend well beyond the current conflict.
Governments in Europe and Asia are accelerating strategic petroleum reserve reviews and actively pursuing alternative supply agreements. This is precisely because the current crisis has demonstrated how quickly a single maritime chokepoint can impose trillion-dollar economic consequences on economies that had no direct involvement in the underlying conflict. Notably, ceasefire developments continue to ease some of the most acute supply fears, even if underlying structural risks remain firmly in place.
Sustained $100+ oil prices are simultaneously strengthening the economic case for renewable energy investment and electrification of transport across consuming nations. The long-term investment logic for energy diversification away from Hormuz-dependent supply chains has never been more compelling from a pure risk management perspective, regardless of where one sits on the energy transition debate.
The geopolitical premium on energy security, once a theoretical concept discussed in policy papers, is now embedded directly in crude oil forward curves. That premium is unlikely to fully disappear even after the current conflict resolves. Markets, like insurers, update their risk models based on events that were previously considered improbable. The 2026 Hormuz closure has moved from low-probability tail risk to demonstrated historical precedent, and oil eases on Iran ceasefire signals only temporarily before structural supply realities reassert themselves. Pricing frameworks will reflect that permanently.
Disclaimer: This article contains references to price forecasts, analyst assessments, and scenario projections that represent estimates and opinions as of the dates cited. Oil market conditions are subject to rapid change based on geopolitical developments, diplomatic outcomes, and macroeconomic data. Nothing in this article constitutes financial or investment advice. Readers should conduct independent research and consult qualified financial advisors before making investment decisions.
Want Real-Time Alerts When Energy Market Shifts Create ASX Opportunities?
Discovery Alert's proprietary Discovery IQ model scans ASX announcements instantly, delivering actionable insights on significant mineral discoveries — including those in the energy sector — so investors can act ahead of the broader market. Explore historic discoveries and their market returns, then begin a 14-day free trial to position yourself at the forefront of the next major opportunity.