August 6, 2026
What Economic Forces Drive the Oil-Gold Correlation in Modern Markets?
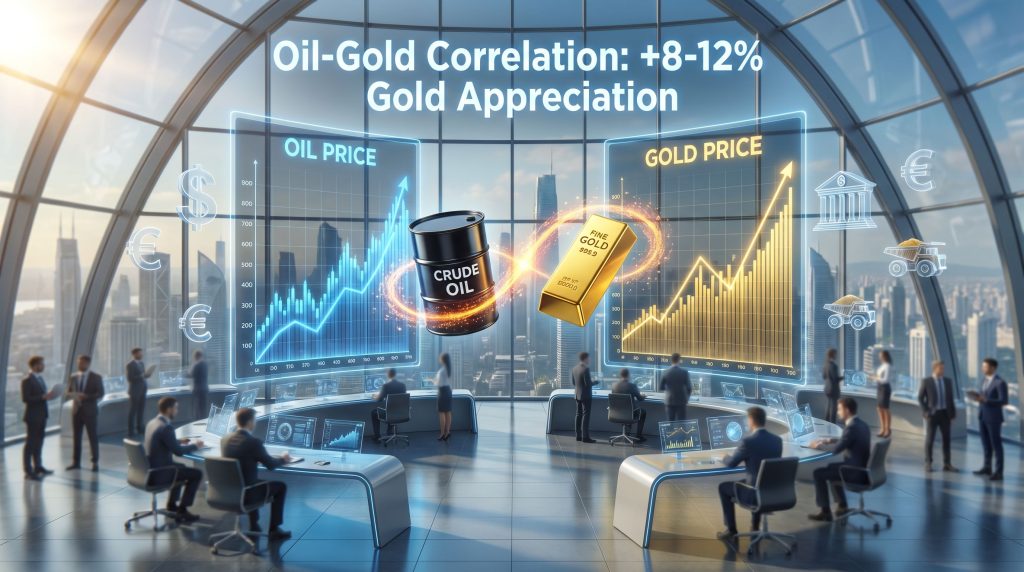
The intricate relationship between energy markets and precious metals operates through sophisticated transmission mechanisms that extend far beyond simple commodity trading patterns. Understanding how the oil prices impact on gold market requires examining how energy price volatility cascades through monetary systems, inflation expectations, and currency valuations across interconnected global markets.
The Inflation Transmission Mechanism
When oil prices surge, the inflationary impact ripples through economic systems via multiple channels. Manufacturing PMI data from April 2026 demonstrates this relationship in real time, with input costs reaching a 10-month high as the S&P Global Flash US Manufacturing PMI jumped to 54.0, representing a 47-month peak. This surge coincided with Brent crude climbing to $103.67 per barrel, reflecting a $37.50 increase (+56.5%) year-over-year.
The transmission operates through several key pathways:
• Energy costs as primary inflation drivers across supply chains
• Manufacturing input price pressures from transportation and production energy
• Consumer price index responses to sustained energy cost increases
• Central bank policy reactions to energy-driven inflation spikes
Furthermore, S&P Global explicitly cited regional conflicts as drivers of energy-linked cost pressure, validating how geopolitical supply constraints translate into production cost inflation. This creates what economists term stagflation conditions where output expands while costs accelerate simultaneously, presenting central banks with conflicting policy mandates.
Currency Dynamics and Dollar Strength
The dollar's role as the pricing currency for both oil and gold creates complex feedback loops that either amplify or dampen their correlation. April 2026 market data reveals a counterintuitive dynamic: oil prices rose while the dollar strengthened, creating cross-currents in commodity markets. This occurs because higher oil prices trigger Federal Reserve rate expectations, which strengthen the dollar and create headwinds for USD-denominated commodities.
The mechanisms include:
• USD pricing structures for both commodities creating common currency exposure
• Federal Reserve interest rate policy responses to oil-driven inflation pressures
• International capital flows during energy price volatility periods
• Exchange rate impacts on commodity demand from non-USD economies
This dual impact explains why gold maintained its position at $4,738 despite simultaneous dollar strengthening, as energy-driven inflation concerns counterbalanced rising real interest rates. Consequently, the oil prices impact on gold market manifests through these complex currency dynamics.
When big ASX news breaks, our subscribers know first
Why Do Rising Energy Costs Create Structural Support for Precious Metals?
Energy price increases generate cascading effects throughout the global economy that systematically enhance gold's appeal as both a monetary hedge and store of value. The relationship operates through production cost inflation and monetary policy constraints that create fundamental price floors for precious metals.
Production Cost Inflation Across Industries
Real-world evidence from Newmont Corporation demonstrates this mechanism in action. The world's largest gold producer reported Q1 2026 all-in sustaining cost (AISC) guidance of $1,680 per ounce, representing a $322 per ounce increase (+23.7%) from $1,358 in 2025. This dramatic cost escalation within 12 months directly correlates with energy price movements.
The cost structure breakdown reveals multiple energy-linked components:
• Mining operations: Diesel fuel for haul trucks, loaders, and drilling equipment (25-40% of cash costs in open-pit mines)
• Processing facilities: Electricity for grinding, leaching, flotation systems (10-20% of processing costs)
• Transportation logistics: Fuel for concentrate and doré shipment (5-10% of cash costs)
• Reagent production: Chemical inputs tied to petroleum derivatives for cyanide, lime, and fuel for calcination
With Brent crude at $103.67 representing a $37.50 increase year-over-year, the direct impact on diesel costs (+$0.15-0.25 per gallon equivalent) scales across large mining operations requiring 100,000+ gallons monthly. This translates to tens of millions in annual cost pressure for major producers, demonstrating clear mining industry trends affecting operational costs.
Monetary Policy Constraints During Energy Shocks
Central banks face unique challenges when inflation stems from energy supply shocks rather than demand-driven price increases. Traditional interest rate tools become less effective against supply-driven inflation, creating the conditions that historically support precious metals demand.
The policy dilemma manifests through:
• Central bank constraints between inflation control and economic growth preservation
• Interest rate policy effectiveness limitations during supply-driven inflation episodes
• Quantitative easing considerations amid persistent energy cost pressures
• Currency debasement risks from accommodative monetary policies
The April 2026 PMI data illustrates this challenge perfectly, showing output expanding (Manufacturing PMI at 54.0) while costs accelerate to 10-month highs. This creates stagflation conditions where central banks become "stuck between two bad options," unable to address inflation without potentially triggering economic contraction.
How Do Geopolitical Energy Disruptions Amplify Gold Demand?
Energy supply disruptions create immediate safe-haven demand while establishing longer-term inflationary pressures that support precious metals valuations. Current events in the Strait of Hormuz provide a real-time case study of these dynamics in action.
Supply Chain Risk Assessment Framework
The Strait of Hormuz handles approximately 20% of global oil trade, making regional instability a critical price driver. Recent developments include 31 ships redirected or intercepted under blockade conditions, with naval operations countering mine-laying activities in this crucial shipping chokepoint.
| Risk Factor | Oil Market Impact | Gold Market Response |
|---|---|---|
| Shipping Route Disruptions | +15-25% price spikes | Safe-haven buying surge |
| Production Facility Attacks | Supply constraint fears | Portfolio diversification |
| Trade Embargo Implementations | Regional price distortions | Currency hedge demand |
| Strategic Reserve Releases | Temporary price moderation | Reduced safe-haven premium |
Goldman Sachs analysis warns that if Hormuz flows remain restricted for another month, Brent could average $120 per barrel in Q3 2026. This projection demonstrates how geopolitical energy supply risks translate into sustained inflationary pressure rather than temporary price spikes, particularly relevant for regions like those covered by Saudi exploration licenses.
Investor Behavior During Energy Crises
Portfolio rebalancing patterns during energy disruptions reveal systematic shifts toward hard assets. Gold's resilience at $4,738 despite simultaneous dollar strengthening illustrates how safe-haven demand can overwhelm traditional currency headwinds during geopolitical uncertainty.
Behavioral responses include:
• Portfolio rebalancing toward hard assets during supply chain uncertainties
• Institutional allocation increases to inflation-protected investments
• Retail investor flight from paper assets during geopolitical tensions
• Central bank reserve diversification away from vulnerable currencies
Physical gold benefits from what market analysts describe as measuring "the cost of a world that can't find stability," representing demand that transcends specific geopolitical outcomes. This aligns with recent record-high gold prices reflecting sustained institutional interest.
What Role Does Dollar Strength Play in Oil-Gold Price Relationships?
The US dollar's dual role as both commodities' pricing currency and global reserve asset creates complex feedback loops that can either reinforce or counteract oil-gold correlations depending on the underlying drivers of dollar strength.
Interest Rate Policy Transmission Effects
When oil price increases trigger inflation expectations, Federal Reserve policy responses create competing forces on precious metals. Higher oil prices lead to "higher for longer" rate expectations, which strengthen the dollar and raise the opportunity cost of holding non-yielding assets like gold.
The transmission mechanisms include:
• Federal Reserve rate hikes strengthening dollar against commodity prices
• Opportunity cost calculations for non-yielding gold holdings during rising rates
• International demand destruction from stronger dollar pricing dynamics
• Emerging market currency pressures affecting commodity consumption patterns
The April 2026 scenario demonstrates this tension: oil at $103.67 creates inflationary pressure supporting gold, while the same oil prices trigger rate expectations that strengthen the dollar and create headwinds for precious metals.
Asymmetric Market Responses
Historical analysis reveals that oil prices impact on gold market exhibits asymmetric characteristics, with gold responding more strongly to oil price increases than decreases. This asymmetry reflects the different market dynamics during energy inflation versus energy deflation periods.
The asymmetric relationship stems from central bank policy responses, which typically become more accommodative during deflationary periods but face constraints during inflationary episodes driven by supply shocks. Moreover, the recent oil production decline in certain regions adds complexity to traditional correlation patterns.
How Do Mining Cost Structures Amplify Oil-Gold Relationships?
Energy represents a significant component of gold mining operational costs, creating direct transmission channels between oil prices and gold production economics that establish fundamental price floors for precious metals.
All-In Sustaining Cost (AISC) Analysis
Newmont's dramatic cost escalation provides concrete evidence of energy's impact on mining economics. The $322 AISC increase in less than 12 months demonstrates how oil price movements translate directly into production cost pressures across the mining industry.
Energy cost components in mining operations include:
• Diesel fuel costs for mining equipment fleets and transportation logistics
• Electricity generation expenses for processing facilities and mill operations
• Reagent and chemical input costs tied to petroleum-derivative pricing
• Labor cost inflation from energy-driven living expense increases in mining regions
With Newmont's stock more than doubling over the past year despite cost pressures, institutional investors are pricing in a sustained high-gold-price environment that reflects structural cost support rather than temporary market volatility.
Supply Response Mechanisms
Rising energy costs create supply constraint mechanisms that reinforce precious metals price floors through several pathways:
• Mine closure decisions based on energy cost thresholds and margin compression
• Capital expenditure deferrals during high energy cost periods affecting future supply
• Exploration budget reductions constraining long-term resource development
• Technology investment priorities shifting toward energy efficiency and cost reduction
When production costs rise as rapidly as Newmont's experience demonstrates, marginal producers face difficult operational decisions. Mines operating near breakeven levels may defer production or reduce output, creating the supply tightening that forms structural price floors beneath gold.
What Market Scenarios Create Oil-Gold Correlation Breakdowns?
Understanding when oil and gold prices diverge reveals the limits of their relationship and helps identify market regime changes that require different investment positioning strategies.
Demand Destruction Scenarios
Economic contractions can break oil-gold correlations when industrial oil demand collapses while gold maintains safe-haven appeal. Silver's recent underperformance illustrates this dynamic, falling approximately 3.5% while gold declined less than 0.3% during the same period, and dropping more than 15% since regional conflicts began.
Correlation breakdown factors include:
• Economic recession reducing industrial oil demand while maintaining gold safe-haven appeal
• Technology disruption affecting long-term oil demand forecasts and energy transition timelines
• Alternative energy adoption rates exceeding market expectations and reducing oil dependency
• Efficiency improvements reducing energy intensity across industrial sectors
Silver's "dual-role problem" demonstrates how industrial metals face selling pressure during demand destruction fears, while monetary metals like gold maintain defensive characteristics even during economic uncertainty.
Monetary Policy Divergence Situations
Aggressive central bank tightening can overwhelm inflation concerns and break traditional oil-gold relationships, particularly when policy responses target demand rather than accommodate supply-driven price pressures.
Divergence scenarios include:
• Aggressive central bank tightening overwhelming inflation concerns through demand destruction
• Deflation expectations despite temporary energy price spikes due to demand collapse
• Currency crisis scenarios affecting regional commodity demand patterns
• Financial system stress creating liquidity preferences over inflation hedge positioning
However, the key variable becomes whether central banks accommodate energy-driven inflation or aggressively combat it through demand destruction policies that can overwhelm traditional commodity relationships. This connects to broader gold price forecast considerations for institutional investors.
The next major ASX story will hit our subscribers first
How Should Investors Position for Oil-Driven Gold Market Opportunities?
Strategic allocation approaches must account for both correlation strengths and timing lags between energy price movements and precious metals responses, while recognising the structural changes affecting traditional relationships.
Portfolio Construction Considerations
Investment horizon and oil price scenarios require different precious metals allocation strategies to optimise risk-adjusted returns during energy-driven market volatility.
| Investment Horizon | Oil Price Scenario | Gold Allocation Strategy |
|---|---|---|
| 3-6 Months | Rising energy costs | 8-12% portfolio weighting |
| 6-18 Months | Sustained high oil prices | 12-18% portfolio weighting |
| 18+ Months | Energy transition uncertainty | 5-8% portfolio weighting |
Current market conditions with oil at $103.67 and gold at $4,738 suggest intermediate-term positioning favouring higher allocations, particularly given manufacturing input costs at 10-month highs and central bank policy constraints.
Risk Management Framework
Effective precious metals positioning during oil price volatility requires monitoring multiple correlation and divergence indicators:
• Correlation breakdown monitoring through technical indicators and regime change signals
• Currency hedge considerations for international exposure during dollar strength periods
• Timing strategies for oil price volatility cycles and geopolitical risk premiums
• Rebalancing triggers based on correlation strength measurements and structural changes
Given Newmont's more than doubling stock performance despite $322 AISC increases, institutional positioning suggests sustained confidence in the energy-gold relationship rather than temporary correlation trading.
What Future Trends Will Shape Oil-Gold Market Relationships?
Structural changes in global energy markets and monetary systems are reshaping traditional commodity relationships in ways that may strengthen or weaken oil prices impact on gold market over different time horizons.
Energy Transition Impact Assessment
The global shift toward renewable energy sources creates both opportunities and challenges for traditional oil-gold relationships, with implications varying by transition timeline and implementation effectiveness.
Transition factors include:
• Renewable energy adoption reducing oil's inflation transmission power over longer time horizons
• Battery metal demand competing with traditional precious metals for portfolio allocation
• Carbon pricing mechanisms affecting energy cost structures and inflation dynamics
• Grid storage technologies changing energy price volatility patterns and supply disruption impacts
However, current mining cost escalation demonstrates that energy transition remains incomplete, with fossil fuels continuing to drive operational expenses across commodity production sectors.
Monetary System Evolution
Changes in global monetary systems and payment mechanisms may alter gold's traditional role as an inflation hedge and store of value, affecting its relationship with energy-driven inflation.
Evolutionary factors include:
• Central bank digital currencies affecting gold's monetary role in portfolio diversification
• Cryptocurrency adoption as alternative inflation hedges competing with precious metals
• International payment system changes reducing dollar dominance and currency transmission effects
• Climate policy integration into monetary policy frameworks affecting energy-inflation dynamics
Strategic Outlook: The oil-gold relationship remains fundamentally intact through inflation transmission channels and mining cost structures, but technological and policy changes are creating new variables that require active monitoring for portfolio optimisation during transition periods.
Current market conditions with oil at $103.67, gold at $4,738, and mining costs rising $322 per ounce annually suggest the traditional energy-precious metals relationship continues operating effectively despite longer-term structural changes beginning to influence market dynamics. Additionally, research from historical commodity correlation studies validates these ongoing relationships across multiple market cycles.
Disclaimer: This analysis is for informational purposes only and does not constitute financial or investment advice. Commodity markets involve substantial risk and may result in partial or total loss of invested capital. Always consult qualified financial professionals before making investment decisions. Market data and projections are subject to change and may not reflect actual future performance.
Ready to Capitalise on Energy-Driven Market Opportunities?
Discovery Alert's proprietary Discovery IQ model delivers real-time notifications on significant ASX mineral discoveries, instantly empowering subscribers to identify actionable opportunities ahead of the broader market during volatile energy cycles. Begin your 14-day free trial today and secure your market-leading advantage in navigating the complex relationships between energy costs, inflation pressures, and precious metals discoveries.