
May 19, 2026
Understanding Oil Market Dynamics During Regional Conflicts
Global energy security faces unprecedented challenges as geopolitical tensions reshape traditional supply-demand calculations. The OPEC April output boost as war threatens supply demonstrates how modern petroleum markets respond to disruption threats beyond simple production mathematics, with recent developments highlighting the complex interplay between regional conflicts and crude oil flows.
Current market conditions demonstrate the evolution of energy crisis management, where producer cartels must balance immediate supply concerns against long-term strategic positioning. This dynamic becomes particularly complex when traditional chokepoint vulnerabilities intersect with spare capacity deployment strategies.
When big ASX news breaks, our subscribers know first
OPEC+ Crisis Response Framework Evolution
The petroleum cartel's approach to managing supply disruptions has evolved significantly from historical precedents. Modern crisis management protocols emphasise graduated responses rather than dramatic production swings, reflecting lessons learned from previous market interventions and the need for measured responses to oil price rally scenarios.
Production Adjustment Methodologies During Uncertainty
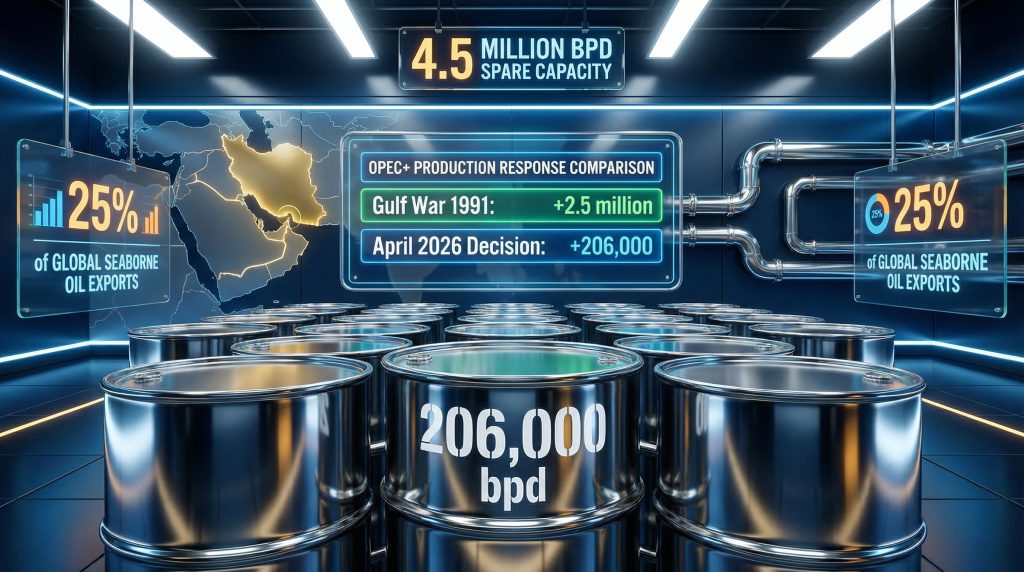
Eight core OPEC+ members recently implemented a 206,000 barrel per day production increase, representing a measured escalation from previous monthly adjustments of 137,000 bpd. This progression indicates systematic unwinding of production cuts initiated in April 2025, with approximately 1.9 million barrels per day already restored to market since March 2025.
The remaining 1 million barrels per day of cuts available for unwinding provides strategic flexibility for continued gradual increases. Furthermore, this phased approach contrasts with emergency surge capacity deployment, which could theoretically access 4.5 million barrels per day of spare production capability concentrated primarily in Saudi Arabia and the UAE.
Historical Crisis Comparison Analysis
| Crisis Period | Output Adjustment | Duration | Market Response | Strategic Outcome |
|---|---|---|---|---|
| Gulf War 1991 | +2.5 million bpd | 6 months | Price stabilisation | Supply security maintained |
| Iraq War 2003 | +1.8 million bpd | 4 months | Market confidence | Alternative routing tested |
| Libya Crisis 2011 | +1.5 million bpd | 12 months | Extended adjustment | Spare capacity proven |
| Current Response | +206,000 bpd | Ongoing | Preemptive measure | Flexibility preserved |
The current adjustment represents approximately 0.2% of global oil production, positioning it as a calibrated market signal rather than emergency flood supply. This modest scale reflects underlying market assessments that fundamentals remain well-supplied despite geopolitical premium concerns affecting oil price movements.
Strategic Chokepoint Vulnerability Assessment
Critical Infrastructure Exposure Analysis
The Strait of Hormuz represents the world's most strategic energy transit corridor, handling approximately 25% of global seaborne oil exports according to shipping analytics from Argus Media. This concentration creates cascading vulnerability across multiple producer nations with limited alternative routing capacity.
Key Regional Export Dependencies:
- Saudi Arabia: 5.3 million bpd via Hormuz transit
- Iraq: 3.2 million bpd regional export flows
- United Arab Emirates: 2.1 million bpd with Fujairah bypass options
- Kuwait: 1.4 million bpd strait-dependent shipments
- Iran: 1.7 million bpd primarily reaching China
These combined flows total approximately 13.7 million barrels per day dependent on Hormuz passage, representing roughly 13-14% of global daily crude consumption. The concentration of multiple producers through a single geographic bottleneck amplifies systemic risk beyond individual country exposure.
Alternative Routing Capacity Limitations
Saudi Arabia's east-west pipeline to Red Sea terminals operates at 5.5 million barrels per day capacity, with potential emergency expansion to 7 million bpd. However, this alternative capacity cannot fully compensate for complete Hormuz closure, creating a structural vulnerability gap of several million barrels daily.
The UAE can partially bypass the strait through increased Fujairah supplies via the Adcop pipeline, though total alternative routing remains insufficient for complete strait replacement.
Secondary risks compound primary chokepoint vulnerabilities. Red Sea routing faces potential disruption from Houthi rebel activity in Yemen, while UAE bypass capacity handles only a fraction of total Emirates export volume. This layered risk structure means producers cannot simply reroute around Hormuz without accepting significant volume constraints.
Insurance Market Risk Pricing Mechanisms
Maritime insurance markets provide real-time risk assessment through premium adjustments and coverage modifications. Recent tensions triggered seven-day cancellation clauses for vessels exposed to Hormuz transit, forcing shipowners to seek alternative coverage at elevated war risk premiums.
Documented Shipping Disruptions:
- Vessel Incidents: Palau-flagged Skylight (11,262 dwt) struck near Khasab port
- Crew Impact: 20 crew evacuated, 4 injured requiring medical treatment
- Traffic Reduction: Sharp decline in strait transit according to shipping data
- LNG Diversions: At least 9 carriers changed course away from strait
These operational disruptions demonstrate how theoretical risks translate into immediate logistical constraints, affecting both crude oil and liquefied natural gas flows through the region.
Economic Fundamentals Versus Geopolitical Premium Dynamics
Supply-Demand Balance Assessment
Market forecasters project large supply surplus conditions throughout 2026, providing the economic foundation for OPEC+'s measured response approach. The 1.9 million barrel per day production increase since March 2025 has occurred without triggering oversupply concerns, indicating demand absorption capacity remains robust.
This fundamental assessment contrasts with geopolitical risk premiums embedded in commodity futures markets. Consequently, the modest production increase signals OPEC+ confidence that underlying supply-demand mechanics can accommodate incremental additions without destabilising price equilibrium, though analysts continue monitoring oil futures analysis for market direction.
Spare Capacity Strategic Deployment
The cartel retains 4.5 million barrels per day of spare production capacity based on January 2026 levels, with concentration in Gulf producers possessing rapid deployment capability. This reserve capacity provides multiple strategic options:
Capacity Deployment Scenarios:
- Scenario A: Hormuz closure triggers emergency capacity activation
- Scenario B: Extended regional conflict necessitates full cut reversal
- Scenario C: Diplomatic resolution enables gradual normalisation timeline
The emphasis on maintaining flexibility to increase or decrease output depending on market conditions reflects sophisticated risk management rather than predetermined production trajectories, especially given recent US drilling decline affecting global supply dynamics.
Market Psychology and Investment Response Patterns
Energy Commodity Futures Reaction Mechanisms
Incremental supply changes of 206,000 barrels per day generate disproportionate futures market responses during uncertainty periods. Price discovery mechanisms amplify modest volume adjustments through risk premium calculations that extend beyond physical supply mathematics.
Futures Curve Implications:
- Contango Development: Forward prices exceed spot levels during supply anxiety
- Backwardation Signals: Immediate delivery premium reflects disruption fears
- Volatility Expansion: Option markets price elevated uncertainty ranges
These market signals influence capital allocation decisions across energy sectors, affecting upstream investment, refining margins, and alternative energy development timelines.
Currency and Energy Equity Correlations
Oil-exporting economies experience currency strength during geopolitical tensions as energy export revenues benefit from risk premiums. In addition, energy equity valuations incorporate both higher commodity price expectations and operational risk assessments for companies with regional exposure.
The correlation between energy security concerns and renewable energy investment acceleration represents a structural shift in long-term capital allocation patterns. Energy transition timelines face potential acceleration as supply diversity becomes a strategic priority beyond environmental considerations.
Operational Crisis Management Protocols
Accelerated Decision-Making Frameworks
The shift to "day-by-day market monitoring" represents a significant operational change from standard monthly or quarterly review cycles. This accelerated assessment protocol enables rapid production adjustments in response to evolving geopolitical conditions.
Virtual meeting capabilities demonstrated during recent tensions prove the cartel can convene and implement decisions within hours of major regional developments. However, the April 5th coordination meeting schedule maintains formal review processes while enabling emergency interventions between scheduled assessments.
Member Compliance and Execution Capability
Historical analysis reveals variable compliance rates across OPEC+ members during previous crisis periods. Current production increase commitments must consider whether participating countries can actually deliver announced volumes amid regional infrastructure constraints, particularly given concerns about oil price stagnation.
Execution Risk Factors:
- Infrastructure Vulnerability: Physical facility exposure to conflict damage
- Logistics Constraints: Transportation capacity limitations during tensions
- Technical Capability: Rapid production adjustment implementation challenges
- Financial Resources: Investment requirements for sustained output increases
Member states with higher operational flexibility and infrastructure redundancy maintain superior execution capabilities during crisis conditions.
The next major ASX story will hit our subscribers first
Global Energy Security Transformation Implications
Infrastructure Diversification Investment Priorities
Current crisis conditions highlight strategic importance of supply route diversification beyond traditional chokepoint dependencies. Long-term infrastructure investment may prioritise alternative transportation corridors, storage capacity expansion, and cross-border pipeline development.
Investment Focus Areas:
- Pipeline Capacity: East-west routing expansion beyond current 7 million bpd emergency levels
- Terminal Infrastructure: Red Sea and Fujairah facility capacity increases
- Storage Systems: Strategic reserve expansion for buffer capacity
- Alternative Routes: Non-strait export corridor development
These infrastructure modifications require multi-year development timelines and substantial capital commitment, extending beyond immediate crisis response measures.
Strategic Petroleum Reserve Utilisation
Major consuming nations maintain strategic petroleum reserves for supply security purposes, though coordination mechanisms with producer countries remain complex. Reserve deployment decisions balance immediate supply needs against long-term strategic stockpile maintenance.
The current crisis highlights potential acceleration of global energy transition planning beyond existing 2030 targets as supply security concerns intersect with climate policy objectives.
Risk Scenario Modeling and Contingency Planning
Quantitative Impact Assessment Models
Production Disruption Scenarios:
| Disruption Level | Volume Impact | Duration Estimate | Price Effect | Alternative Supply |
|---|---|---|---|---|
| Partial Hormuz | 3-5 million bpd | 2-4 weeks | +15-25% premium | Emergency capacity |
| Complete Closure | 15-20 million bpd | 4-12 weeks | +40-60% premium | All alternatives |
| Regional Escalation | 8-12 million bpd | 8-16 weeks | +25-40% premium | Mixed response |
| Infrastructure Damage | 2-8 million bpd | 12-52 weeks | +10-30% premium | Gradual replacement |
These scenario models incorporate spare capacity deployment timelines, alternative routing capabilities, and demand destruction thresholds from elevated prices. For instance, major market participants continue monitoring OPEC production decisions for strategic insights.
Long-term Strategic Adjustment Pathways
Energy market structure may experience permanent modifications following resolution of current tensions. Infrastructure investments, supply chain diversification, and accelerated energy transition policies represent structural changes extending beyond temporary crisis response.
Structural Change Indicators:
- Supply Chain Resilience: Reduced single-point-of-failure dependencies
- Technology Acceleration: Enhanced renewable energy development timelines
- Geopolitical Realignment: Modified energy partnership arrangements
- Investment Reallocation: Capital shifts toward supply security infrastructure
These transformations occur gradually over multiple years rather than immediate crisis resolution periods.
Monitoring Frameworks and Assessment Metrics
Real-time Market Intelligence Systems
Modern crisis management relies on continuous monitoring of multiple data streams including shipping movements, inventory levels, futures market signals, and geopolitical intelligence. Integration of these information sources enables rapid assessment of changing conditions.
Key Monitoring Metrics:
- Strait Transit Volumes: Daily throughput measurement and variance analysis
- Inventory Levels: Global crude and product stockpile changes
- Futures Positioning: Speculative and commercial trader behaviour patterns
- Insurance Premiums: War risk assessment and coverage availability
These metrics provide early warning indicators for production adjustment requirements and market intervention timing.
Decision Threshold Calibration
OPEC+ maintains specific trigger points for different response levels, though these thresholds remain confidential to preserve strategic flexibility. Public communications emphasise maintaining "full flexibility to increase or decrease output depending on market conditions" whilst avoiding specific commitment details.
The balance between market transparency and strategic ambiguity reflects sophisticated crisis management evolution from historical precedents where producer responses were more predictable and mechanistic.
Disclaimer: This analysis is based on publicly available information and market research as of March 2026. Oil market conditions and geopolitical situations remain highly volatile and subject to rapid change. Investors and market participants should conduct independent research and consider professional advice before making investment decisions. Forecasts and scenario analyses represent potential outcomes rather than definitive predictions and should be evaluated within broader risk management frameworks.
Ready to Capitalise on Energy Market Disruptions?
Discovery Alert's proprietary Discovery IQ model delivers instant alerts on significant mineral discoveries across global markets, helping investors identify opportunities in volatile commodity sectors including energy-related exploration companies. Explore Discovery Alert's historic discovery returns to understand how major mineral finds can generate substantial market returns, or begin your 14-day free trial today to position yourself ahead of market movements.