
June 20, 2026
When Sentiment Diverges From Storage: The Oil Market's Growing Credibility Problem
Commodity markets have a long history of pricing in resolutions before they materialise. The psychology is well-documented: traders systematically discount the probability of tail risks persisting, anchoring instead to the most recent diplomatic signal or the nearest plausible de-escalation scenario. In oil markets, this cognitive pattern has a name among veteran traders — it is sometimes called "hope pricing," and it tends to work until the physical market runs out of patience.
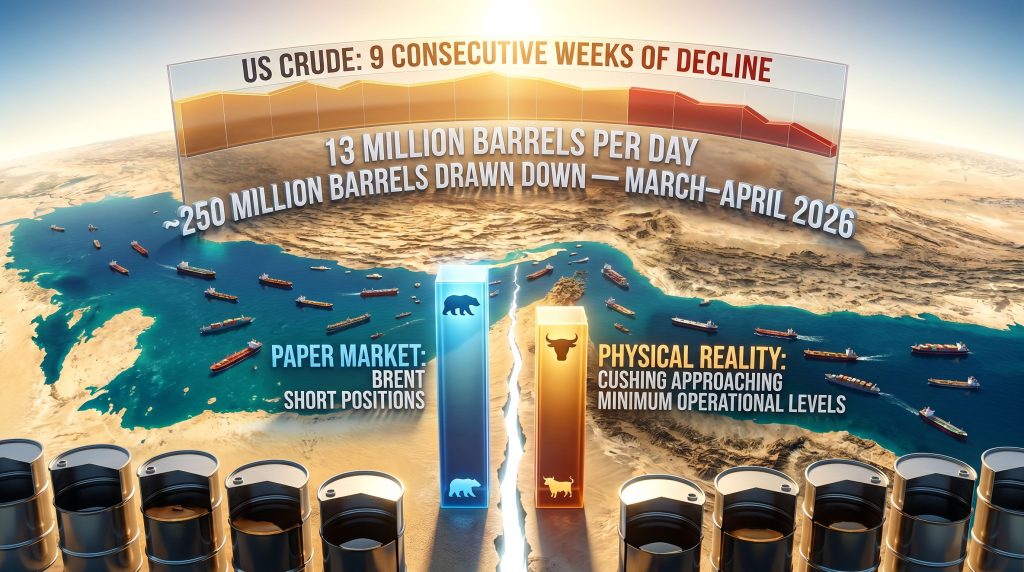
That dynamic is now playing out in real time across crude oil futures markets, where a sustained wave of bearish positioning has emerged despite one of the largest physical supply disruptions in modern energy history. The disconnect between what futures positioning implies about supply expectations and what inventory data is actually recording has reached a scale that deserves serious analytical attention. With traders shorting oil as if the Hormuz crisis is over, the gap between paper market optimism and physical market deterioration continues to widen.
When big ASX news breaks, our subscribers know first
The Paper Market vs. Physical Supply: Understanding the Structural Gap
To understand why this divergence matters, it helps to distinguish between how crude oil is traded on paper versus how it flows in the real world. Futures and derivatives markets allow portfolio managers, hedge funds, and commodity trading advisors to express price views without ever touching a physical barrel. These participants shape price signals primarily through positioning decisions driven by geopolitical expectations, macroeconomic forecasts, and sentiment rather than actual supply and demand balances.
Physical crude markets, by contrast, respond to real barrel flows, storage levels, refinery run rates, and tanker movements. When the two markets diverge significantly, it typically signals one of two things: either the physical market is about to correct toward the futures price, or the futures market is about to face a violent repricing when physical reality asserts itself. Furthermore, understanding crude oil geopolitics helps contextualise why these divergences can persist longer than most participants expect.
The current setup in crude oil is a textbook case of the latter scenario. Short positioning is surging in the futures market at precisely the moment when physical inventory buffers are being depleted at a historically unprecedented pace.
The Scale of the Hormuz Disruption: Contextualising 13 Million Barrels Per Day
The numbers underlying this supply disruption are extraordinary by any historical benchmark. According to the IEA's May 2026 Oil Market Report, approximately 13 million barrels per day of supply has been removed from accessible global markets as a result of the Strait of Hormuz disruption. Against total global consumption of roughly 100 to 103 million barrels per day, this represents a removal of approximately 12 to 13% of daily supply.
For context, the Strait of Hormuz under normal conditions handles approximately 20 to 21% of total global oil trade, making it the single most consequential maritime chokepoint in the world's energy infrastructure. No alternative routing exists at comparable scale or cost. Consequently, the OPEC market influence over spare capacity decisions has become even more pronounced during this period.
Comparing the current situation to prior supply shocks helps illustrate its severity:
| Historical Supply Shock | Estimated Barrels Lost (bpd) | Duration | Approximate Price Impact |
|---|---|---|---|
| 1973 Arab Oil Embargo | ~4–5 million | ~5 months | +300% |
| 1990 Gulf War | ~4–5 million | ~7 months | +100% |
| 2019 Abqaiq Attack | ~5.7 million (temporary) | Days | +15% spike |
| 2026 Hormuz Disruption | ~13 million | 3.5+ months (ongoing) | Unresolved |
The current disruption already surpasses every single prior supply shock in volumetric terms. The 1973 Oil Embargo, which reshaped global energy policy for decades and drove a 300% price surge, involved roughly one-third the daily supply loss currently being absorbed. The 2026 disruption has now persisted for more than three and a half months with no confirmed resolution.
Three Behavioural Forces Driving the Bearish Positioning
Despite this extraordinary supply context, portfolio managers have been systematically rotating into short positions across Brent crude futures since early April 2026. According to Commitment of Traders data compiled through June 2, short positions in Brent crude tripled between the end of March and the beginning of June, reaching their highest level since January 2026. Simultaneously, aggregate open interest in ICE Brent fell to its lowest point since August 2025, reflecting broad disengagement from the market.
ING commodities strategists Warren Patterson and Ewa Manthey noted in a June 2026 research note that market participants are increasingly moving to the sidelines given the fluidity, uncertainty, and headline-driven nature of the situation, a dynamic reflected directly in the declining open interest figures. According to analysis on oil markets, markets appear to be trading the ceasefire narrative rather than the underlying supply shock fundamentals.
Three distinct behavioural forces are driving this positioning:
-
Ceasefire optimism bias — Each signal of an imminent diplomatic resolution triggers a wave of selling, as traders price in an outcome that has repeatedly failed to materialise. After more than three months of near-miss peace deals, this reflex has become deeply conditioned.
-
Recency bias in inventory perception — Many traders are anchoring their expectations to pre-crisis inventory levels rather than recognising the accelerating pace at which those buffers are being consumed.
-
Exhaustion-driven disengagement — The market oscillates between risk-on and risk-off positioning with each fresh escalation or diplomatic headline, creating a form of participant fatigue that pushes capital to the sidelines and compresses open interest.
The January 2026 Precedent: A Warning From Recent History
The most recent comparable episode of elevated Brent short positioning occurred in January 2026, when markets anticipated increased Venezuelan crude supply following a geopolitical shift involving Nicolas Maduro. That positioning peak was followed by a rapid unwinding as physical supply conditions reasserted their dominance over sentiment-driven expectations. The structural parallel to the current setup is instructive: crowded short positioning built on a supply restoration narrative that has not yet materialised in physical barrel flows.
The Inventory Crisis the Futures Market Is Ignoring
While futures positioning reflects optimism about supply restoration, physical inventory data tells a starkly different story. The IEA characterised global inventories as being depleted at a record pace in its May 2026 market report, with observed global stockpiles including oil on water declining by approximately 250 million barrels across March and April 2026 alone. That equates to a drawdown rate of roughly 4 million barrels per day, a figure without precedent in modern oil market records.
Within the United States, the picture is equally stark. US crude oil inventories declined for nine consecutive weeks through early June 2026, shedding approximately 52 million barrels during that period, according to EIA data. Gasoline inventories have followed a similar trajectory, compounding downstream supply pressure heading into peak summer consumption season. This degree of oil price volatility has significant implications for downstream pricing across multiple industries.
| Inventory Metric | Reported Figure | Timeframe |
|---|---|---|
| Global inventory drawdown | ~250 million barrels | March–April 2026 |
| Global drawdown rate | ~4 million bpd | March–April 2026 |
| US crude inventory decline | ~52 million barrels | 9-week period to early June 2026 |
| Cushing, Oklahoma status | Approaching minimum operational levels | As of June 2026 |
The Cushing Warning Signal
Perhaps the most technically significant development in the physical market is the situation at Cushing, Oklahoma, which serves as the designated delivery point for WTI crude futures contracts. As inventories at Cushing approach minimum operational threshold levels, the physical delivery mechanism underpinning the futures market itself becomes impaired.
When storage hubs approach minimum operational levels, the futures market loses its primary physical anchor. This produces non-linear price behaviour that short-positioned traders are uniquely exposed to, as forced covering amplifies rather than stabilises price moves.
The 2020 negative oil price event, while an extreme inverse example driven by a demand collapse rather than supply removal, demonstrated how Cushing inventory dynamics can produce disorderly, discontinuous price action when physical storage mechanics come under stress.
Why a Hormuz Reopening May Not Deliver Immediate Relief
A widespread assumption embedded in the current bearish positioning is that a formal ceasefire or peace agreement will translate quickly into restored supply flows. Historical precedent and commercial logistics suggest this assumption significantly underestimates the time required for physical normalisation.
The supply restoration process involves at least three sequential phases, each introducing its own delay:
-
Security assurance gap — Tanker operators and ship owners require verified confirmation that transit lanes are safe before re-entering Hormuz waters. The insurance market's response is instructive here: specialist insurers have already constructed a $400 million war-risk facility specifically for Hormuz shipping, signalling that commercial risk assessment remains structurally elevated. War-risk premiums must be repriced before commercial shipping resumes at scale.
-
Transit and delivery lag — Once vessels resume movement, crude oil cargoes require multiple weeks to reach end-market buyers, particularly those in Asia. With approximately 60 to 80 million barrels of crude already queued to exit the Strait, the logistics pipeline faces significant congestion even under optimistic transit assumptions.
-
Infrastructure recovery lag — Key downstream processing capacity has sustained damage during the conflict period. TotalEnergies has indicated that a major Saudi refinery affected during the disruption may not achieve full operational recovery until 2027, meaning a Strait reopening alone cannot resolve all the downstream bottlenecks that have accumulated over three and a half months of disruption.
Goldman Sachs has gone further than most in its assessment, warning publicly that Strait of Hormuz traffic flows may never fully recover to pre-crisis throughput levels. This structural impairment thesis directly challenges the market's embedded assumption of a clean, complete supply restoration following any diplomatic agreement. However, as Forbes notes, the oil market effectively cancelled the Hormuz crisis in its pricing even before any ceasefire was confirmed.
The next major ASX story will hit our subscribers first
Q3 2026: The Seasonal Demand Amplifier
The timing risk for short-positioned traders is compounded by a factor that recurs with mechanical regularity every year: seasonal demand. Global oil consumption follows a predictable annual pattern, with the third quarter representing the peak demand period driven by Northern Hemisphere summer travel, aviation activity, industrial production, and power generation for air conditioning load.
ING's Patterson and Manthey explicitly flagged Q3 2026 as the critical pressure window, noting that disruptions persisting into the July-to-September period would coincide with a period of seasonally stronger demand, creating significant upside price pressure precisely when inventory buffers will be at their most depleted.
Chevron CEO Mike Wirth, speaking at the Bernstein 42nd Annual Strategic Decisions Conference in late May 2026, characterised the evolving situation in terms that carry particular weight given Chevron's direct operational exposure to global supply chains. Wirth described the market's shock-absorbing capacity as drastically diminished relative to the start of the disruption, with the steady drawdown of buffers making the system increasingly vulnerable to direct physical price impacts in June and intensifying into July.
Bull vs. Bear: How the Two Camps Assess the Same Data
The current market contains two internally coherent but fundamentally incompatible views of where oil prices are headed:
| Dimension | Bearish Case | Bullish Case |
|---|---|---|
| Supply Outlook | Ceasefire holds; Hormuz reopens within weeks | Reopening delayed; structural damage limits throughput |
| Inventory Assessment | Remaining buffers sufficient to bridge the gap | 250 million barrel drawdown leaves dangerously thin cushion |
| Demand Trajectory | Demand destruction caps further price upside | Peak summer demand amplifies shortage severity |
| Geopolitical Risk | Deal imminent; de-escalation priced in | Ceasefire fragile; daily violations undermine confidence |
| Positioning Dynamic | High short interest reflects market consensus | High short interest creates contrarian short-squeeze setup |
| Goldman Sachs View | Temporary disruption; market normalises | Traffic may never fully recover to pre-crisis levels |
The Short Squeeze Risk: When Crowded Trades Unwind Disorderly
In commodity futures markets, short squeezes occur when a rapid shift in physical or geopolitical conditions forces short-positioned traders to cover their bets simultaneously. The mechanics are self-reinforcing: forced buying drives prices higher, which triggers further forced buying from traders with stop-loss orders, which drives prices still higher.
The current setup in Brent crude presents precisely the structural conditions for this dynamic. Short positions have tripled while open interest has declined to multi-year lows, creating a concentrated, relatively illiquid positioning environment. Any unexpected supply shock, failed diplomatic development, or accelerated inventory depletion signal could trigger a wave of short covering with few natural sellers to absorb the buying pressure. In addition, the broader trade war oil impact on global demand expectations has further complicated how market participants are interpreting price signals.
In commodity markets, the most dangerous trades are frequently the most crowded ones. When positioning converges on a single narrative and physical fundamentals diverge sharply from that narrative, the exit becomes disorderly and price moves become non-linear.
Macro Ripple Effects: Beyond the Oil Price Itself
The implications of sustained oil market tightness extend well beyond the crude price itself. India's energy import bill surged 82% during the disruption period, illustrating the severe macroeconomic transmission mechanism for major oil-importing nations. In response, India has ordered a significant expansion of its strategic petroleum reserves, a policy shift that signals a durable change in national energy security calculus rather than a temporary reaction.
The European Central Bank has assessed that an Iran peace deal alone will not fully erase the energy price shock currently reverberating through European economies, suggesting that inflationary effects will persist into the near term regardless of diplomatic developments. JPMorgan's assessment that European equities have become attractively valued following the oil-price-related selloff indicates that institutional capital is already repositioning around a price recovery scenario.
High fuel prices during the disruption period have also accelerated structural shifts in demand composition, with China's gasoline vehicle market declining sharply as fuel costs surged, and European EV adoption data showing a notable acceleration in response to elevated pump prices. For market participants seeking to manage exposure across this volatile environment, commodity market hedging strategies have become an increasingly critical consideration.
The Widening Gap Between Positioning and Physical Reality
The central analytical tension in crude oil markets as of mid-June 2026 is stark: paper market participants are positioned for a crisis resolution that remains unconfirmed, while physical market data reflects an inventory depletion trajectory with no historical parallel. Traders shorting oil as if the Hormuz crisis is over continue to do so despite three and a half months of evidence suggesting the opposite.
Three structural risks appear significantly underweighted in current futures positioning: the unprecedented pace of global inventory depletion, the multi-phase supply restoration lag that follows even a best-case Hormuz reopening, and the seasonal demand amplification that Q3 introduces at precisely the moment buffers will be thinnest.
Whether the diplomatic process ultimately delivers a durable resolution before physical markets reach critical thresholds remains genuinely uncertain. What is clearer is that the market's current pricing implies a speed and completeness of supply restoration that neither commercial logistics nor infrastructure recovery timelines can plausibly support.
This article is for informational purposes only and does not constitute financial or investment advice. Oil market conditions, geopolitical developments, and inventory data can change rapidly. Readers should conduct their own research and consult qualified financial advisors before making investment decisions. Past supply disruption patterns do not guarantee future price outcomes.
Want To Stay Ahead of the Next Major Commodity Shift?
Discovery Alert's proprietary Discovery IQ model delivers real-time alerts on significant ASX mineral discoveries, instantly translating complex market data into actionable investment insights — explore historic discovery returns to understand how major finds have generated substantial market outcomes, and begin your 14-day free trial at Discovery Alert to position yourself ahead of the broader market.