
July 27, 2026
Understanding Oil Price Dynamics During Regional Conflicts
The intricate machinery of global energy markets operates through complex interconnections between supply-demand fundamentals, storage systems, and risk assessment mechanisms that collectively determine crude oil pricing. Brent crude prices in Middle East conflict scenarios become particularly pronounced during periods of geopolitical uncertainty, when traditional pricing models must account for elevated risk premiums and potential supply disruptions.
The Economic Fundamentals Behind Crude Oil Pricing
Supply-demand equilibrium in energy markets reflects the relatively inelastic nature of both crude oil production and consumption patterns. Production capacity cannot be rapidly adjusted due to technical constraints in extraction, refining, and transportation infrastructure. Similarly, demand patterns remain largely fixed in the short term, as consumers and industrial users have limited ability to immediately substitute alternative energy sources.
Strategic petroleum reserves function as critical market stabilisation tools, with major economies maintaining emergency stockpiles that can be deployed during supply disruptions. The United States Strategic Petroleum Reserve, along with coordinated releases from International Energy Agency member nations, provides a buffer against short-term supply shocks. However, these reserves represent finite resources that can only provide temporary market relief.
Geopolitical risk premiums embedded in crude oil futures reflect market participants' assessments of potential supply disruption probabilities. These premiums fluctuate based on the severity and duration of perceived threats to major oil-producing regions or critical transportation infrastructure.
Historical Context of Middle East Oil Disruptions
Analysis of major supply shocks since the 1970s reveals distinct patterns in market responses and recovery timelines. The 1973 OPEC embargo demonstrated how coordinated production restrictions could generate sustained price increases, while subsequent crises showed varying degrees of market adaptation and alternative supply mobilisation.
The Iran-Iraq War of the 1980s highlighted the vulnerability of Gulf production facilities to prolonged conflict, with tanker attacks and refinery targeting creating sustained supply uncertainty. Recovery patterns from these historical disruptions typically required 12-24 months for full market normalisation, depending on the extent of infrastructure damage and geopolitical resolution.
Economic recovery following previous conflicts shows that sustained high energy costs create cascading effects throughout global supply chains, with transportation, manufacturing, and consumer goods sectors experiencing delayed but significant impact from prolonged oil price elevation.
When big ASX news breaks, our subscribers know first
What Factors Amplify Oil Price Spikes During Middle East Tensions?
Recent market volatility demonstrates how anticipated supply disruptions can generate price movements that exceed actual production losses. Brent crude prices reached US$116 per barrel in March 2026, reflecting a 50% increase over a one-month period, primarily driven by concerns about potential escalation in Red Sea shipping disruptions rather than realised supply constraints.
Critical Chokepoint Analysis
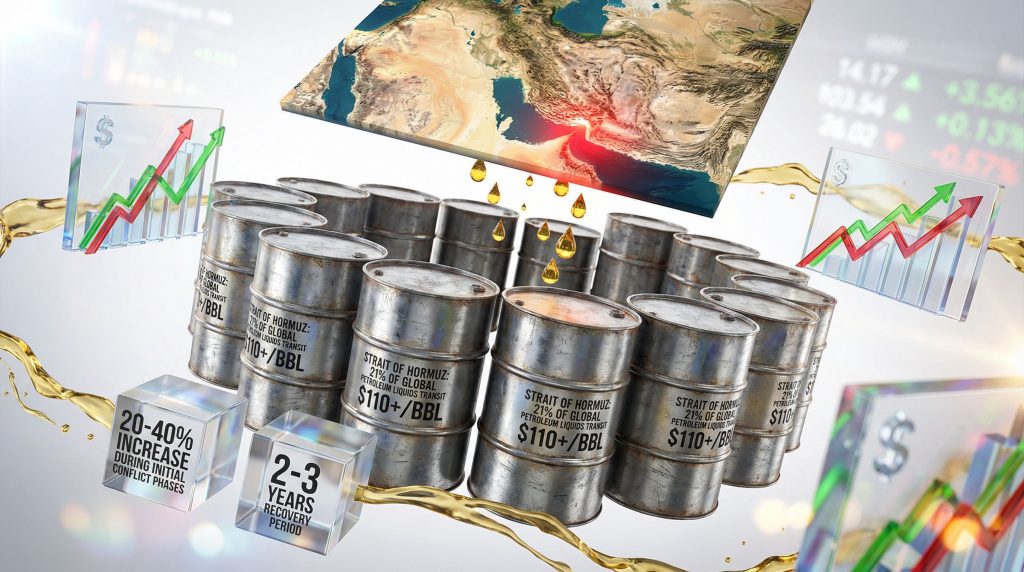
Global oil transportation relies heavily on several strategic waterways where disruptions can create immediate supply chain bottlenecks. The Strait of Hormuz represents the most critical chokepoint, with approximately 21 million barrels per day of petroleum liquids transiting through this narrow passage, representing roughly 21% of global oil trade.
Global Oil Transit Chokepoints
| Chokepoint | Daily Flow (million bpd) | % of Global Trade | Alternative Routes |
|---|---|---|---|
| Strait of Hormuz | 21.0 | 21% | Around Africa (+15 days) |
| Strait of Malacca | 16.0 | 16% | Lombok/Makassar Straits |
| Suez Canal | 5.5 | 5.5% | Around Cape of Good Hope |
Alternative routing options exist but involve significant additional costs and transit time. Ships diverted around the Cape of Good Hope face approximately 15 additional days of transit time, along with increased fuel consumption, insurance premiums, and capital deployment costs. These factors contribute to price premiums that persist even when alternative supply routes remain technically available.
Market Psychology and Speculation Mechanisms
Financial markets often respond to perceived worst-case scenarios rather than most probable outcomes. Market participants appear to be pricing in severe disruption scenarios that exceed current realised supply constraints, creating fear premiums that amplify underlying price movements.
Algorithmic trading systems contribute to rapid price acceleration during geopolitical events, as automated responses to news headlines and technical indicators can trigger substantial position adjustments within minutes of market-moving announcements. These technological factors can magnify initial price responses beyond levels justified by fundamental supply-demand changes.
Commodity futures markets reflect not only current supply-demand conditions but also forward-looking assessments of risk scenarios. Traders position for potential supply disruptions months in advance, creating price volatility that precedes actual physical market constraints.
How Do Regional Conflicts Impact Global Energy Supply Chains?
Production disruption scenarios vary significantly based on the geographic scope and intensity of regional conflicts. Immediate supply interruptions typically affect offshore loading facilities and pipeline networks, while more prolonged disruptions can impact upstream production capacity and refinery operations.
Production Disruption Scenarios
OPEC Production Impact provides the primary mechanism for offsetting supply losses from conflict-affected regions. Saudi Arabia and the United Arab Emirates maintain the majority of this spare capacity, with the ability to increase production by approximately 2-3 million barrels per day within 30-90 days of deployment decisions.
Non-OPEC production responses typically require longer lead times, particularly for unconventional resources such as US shale oil. American tight oil producers can respond to sustained high prices by increasing drilling activity, but production increases generally require 3-6 months to materially impact supply levels.
The effectiveness of production increases from spare capacity depends on the specific crude oil grades available and refinery compatibility. Many refineries are configured to process particular crude types, limiting the substitutability of alternative supplies even when total production capacity exists globally.
Downstream Market Effects
Refinery capacity constraints become critical bottlenecks when supply disruptions affect specific crude oil grades. Regional price differentials emerge as refineries compete for compatible crude supplies, while products markets experience varying degrees of supply pressure based on refinery configurations and inventory levels.
Economic Multiplier Effects
Oil price increases create cascading economic impacts: transportation costs rise immediately, followed by manufacturing input costs, consumer goods inflation, and reduced discretionary spending power across economies.
Strategic petroleum reserve deployment represents a coordinated policy response mechanism, with major consuming nations able to release emergency supplies to moderate price spikes. However, these releases provide temporary market relief rather than permanent solutions to underlying supply constraints.
What Are the Macroeconomic Consequences of Sustained High Oil Prices?
Current energy market conditions demonstrate the rapid transmission of oil price trade war changes throughout broader economic systems. Australian electricity prices increased 30% over the twelve-month period leading to March 2026, contributing to inflationary pressures that prompted central bank policy responses.
Inflation Transmission Mechanisms
Direct energy cost impacts on consumer price indices occur through gasoline, heating oil, and electricity price adjustments. These immediate effects typically appear within 1-2 months of crude oil price changes, with magnitude depending on the energy intensity of individual economies.
Indirect effects through transportation and production costs create more persistent inflationary pressures. Manufacturing sectors experience increased input costs for petrochemical feedstocks and logistics, while agricultural producers face higher fertiliser and equipment operation costs that ultimately translate into food price increases.
Central bank policy responses to energy-driven inflation must balance the competing objectives of price stability and economic growth. The Reserve Bank of Australia implemented its first interest rate increase of 2026 in response to inflationary pressures that included substantial energy cost components.
GDP Growth and Recession Risk Assessment
Historical analysis reveals strong correlations between sustained oil price increases and subsequent economic slowdowns. Price increases above $100 per barrel (in constant 2020 dollars) have preceded recessionary periods in approximately 70% of historical cases since 1970.
Economic Impact Thresholds
| Oil Price Level | Inflation Impact | GDP Growth Risk | Policy Response |
|---|---|---|---|
| $80-90/bbl | Moderate (+0.5-1.0%) | Low | Monitoring |
| $90-110/bbl | Significant (+1.0-2.0%) | Moderate | Hawkish signals |
| $110+/bbl | Severe (+2.0%+) | High | Emergency measures |
Sectoral vulnerability analysis shows that airlines, logistics, and heavy manufacturing industries face the most immediate impact from sustained high energy costs. Consumer discretionary spending typically declines as households allocate larger portions of income to energy expenses, creating secondary economic effects.
How Do Different Economic Regions Respond to Oil Price Volatility?
Net oil-importing economies experience immediate current account balance deterioration as energy import costs increase. These balance of payments pressures often translate into currency depreciation, particularly for emerging market economies with limited foreign exchange reserves.
Net Oil Importing Economies
Current account deficits widen through two primary channels: increased import costs for crude oil and refined products, and reduced competitiveness of domestic industries facing higher energy input costs. Currency depreciation can amplify these effects by increasing the domestic currency cost of energy imports.
Fiscal policy adjustments typically involve subsidy considerations for transportation fuels and electricity generation. Governments face difficult trade-offs between protecting consumers from energy cost increases and maintaining fiscal sustainability during periods of elevated oil prices.
US–China Trade War Impact demonstrates how capital flow patterns shift during energy crises, as international investors reassess the attractiveness of oil-importing versus oil-exporting economies. Portfolio rebalancing can create additional currency pressures for energy-dependent nations.
Oil Exporting Nations' Economic Strategies
Sovereign wealth fund deployment during price spikes allows major oil exporters to capitalise on revenue windfalls while managing exchange rate appreciation pressures. Norway's Government Pension Fund Global and similar institutions provide mechanisms for converting temporary oil revenues into long-term financial assets.
Production capacity considerations involve complex strategic decisions about market share versus price optimisation. Saudi Arabia's role as swing producer requires balancing short-term revenue maximisation against long-term market stability objectives.
Diversification efforts accelerate during high oil price periods, as exporting nations recognise the cyclical nature of energy revenues and invest in alternative economic sectors. However, Dutch disease effects can undermine competitiveness in non-energy industries during boom periods.
What Investment Strategies Emerge During Oil Market Disruptions?
Energy sector capital allocation patterns shift dramatically during supply disruption periods, with upstream exploration and production companies receiving increased investor attention and funding availability. However, investment decisions must account for the potentially temporary nature of price spikes and long-term energy transition trends.
Energy Sector Investment Flows
Upstream exploration and production investments face complex risk-return calculations during volatile price environments. While high current prices support project economics, uncertainty about future price sustainability creates challenges for long-term capital commitment decisions.
Renewable energy acceleration often occurs paradoxically during fossil fuel crises, as governments and private investors seek to reduce dependence on volatile hydrocarbon markets. Solar, wind, and energy storage projects may receive increased policy support and private capital during periods of oil price volatility.
Infrastructure investment in alternative supply routes becomes strategically important during sustained supply disruptions. Pipeline projects, LNG terminals, and strategic storage facilities may receive accelerated development timelines when traditional supply chains face disruption risks.
Portfolio Hedging and Risk Management
Commodity futures positioning strategies allow investors to gain exposure to energy price movements without direct ownership of physical assets. Furthermore, WTI/Brent futures markets can experience significant contango or backwardation during volatile periods, affecting the effectiveness of hedging strategies.
Currency hedging becomes crucial for multinational companies and investors with exposure to oil-dependent economies. Exchange rate volatility often amplifies the domestic impact of oil price changes, particularly in emerging markets.
Sectoral rotation patterns typically favour energy companies, materials producers, and inflation-protected securities during oil price spikes, while consumer discretionary, transportation, and interest-rate-sensitive sectors may underperform.
Q: How much do oil prices typically rise during Middle East conflicts?
Historical analysis shows Brent crude prices in Middle East conflict scenarios increase 20-40% during initial conflict phases, with sustained premiums of $15-25 per barrel during prolonged disruptions, depending on production capacity affected and alternative supply availability.
The next major ASX story will hit our subscribers first
Can Global Markets Adapt to Prolonged Oil Supply Disruptions?
Demand destruction mechanisms represent the primary market adaptation tool during sustained high oil prices. Price elasticity varies significantly across sectors, with industrial users generally more responsive to price signals than individual consumers in the short term.
Demand Destruction Mechanisms
Price elasticity thresholds differ substantially between economic sectors and geographic regions. Industrial users often possess greater flexibility to reduce energy consumption or switch to alternative inputs, while residential consumers face more limited short-term adjustment options.
Behavioural changes in transportation patterns emerge gradually as sustained high prices influence vehicle purchase decisions, commuting patterns, and freight logistics optimisation. However, these adaptations typically require 6-18 months to materially impact aggregate demand levels.
Industrial switching to alternative energy sources accelerates during prolonged oil price elevation, with natural gas, electricity, and renewable alternatives becoming more economically attractive for suitable applications.
Supply Response and Market Rebalancing
Strategic petroleum reserve coordination among International Energy Agency members provides temporary supply augmentation during crisis periods. The United States, European Union, Japan, and other major consuming nations maintain coordinated release protocols for emergency situations.
Emergency production increases from spare capacity holders require careful management to avoid market oversupply once crisis conditions resolve. Saudi Arabia and other Gulf producers must balance immediate market stabilisation objectives against longer-term market share and price stability considerations.
Long-term supply chain diversification strategies emerge from sustained disruption experiences, with consuming nations seeking to reduce dependence on concentrated supply sources through supplier diversification and domestic production development.
What Long-Term Economic Trends Emerge from Oil Price Shocks?
Structural economic adjustments following major energy price disruptions often persist long after immediate crisis conditions resolve. These adaptations include accelerated energy efficiency investments, supply chain reconfiguration, and policy framework modifications designed to reduce future vulnerability.
Structural Economic Adjustments
Accelerated energy transition investment patterns emerge as both public and private sector actors seek to reduce exposure to volatile hydrocarbon markets. Clean energy infrastructure, energy storage systems, and electric vehicle charging networks often receive increased investment priority during oil crisis periods.
Supply chain regionalisation and nearshoring trends accelerate when energy transportation costs increase substantially. Manufacturing location decisions increasingly factor energy transportation costs and supply chain resilience considerations alongside traditional labour cost differentials.
Innovation cycles in energy efficiency technologies receive stimulation from sustained high energy prices, with research and development investments targeting industrial processes, transportation systems, and building efficiency improvements.
Monetary Policy Evolution
Central bank framework adaptations for commodity shocks involve developing more sophisticated models for distinguishing between temporary price level adjustments and sustained inflationary pressures. Policy responses must balance inflation control objectives against economic growth preservation during energy-driven cost increases.
Historical Oil Shock Recovery Timelines
| Event | Peak Price | Duration | Recovery Period | Long-term Impact |
|---|---|---|---|---|
| 1973 Oil Crisis | $55/bbl (2020$) | 6 months | 2-3 years | Energy efficiency focus |
| 1979-80 Crisis | $120/bbl (2020$) | 12 months | 3-4 years | Alternative energy development |
| Gulf War 1990 | $95/bbl (2020$) | 3 months | 1 year | Strategic reserve expansion |
International coordination mechanisms during energy crises involve multilateral institutions such as the International Energy Agency facilitating coordinated policy responses among major consuming nations. These coordination efforts aim to minimise competitive policy responses that could amplify global economic disruption.
Financial stability considerations in energy-dependent markets require regulatory authorities to monitor banking sector exposure to energy sector credits and foreign exchange positions in oil-importing economies experiencing currency pressures.
How Should Investors Position for Ongoing Oil Market Volatility?
Risk assessment frameworks for energy market exposure must incorporate multiple scenario planning approaches, recognising that geopolitical developments can create non-linear price responses that exceed traditional volatility models.
Risk Assessment Framework
Geopolitical risk modelling methodologies require integration of political analysis, military assessment, and economic impact evaluation. Traditional financial models may inadequately capture tail risk scenarios involving major supply disruption events.
Scenario planning for different conflict escalation paths should incorporate multiple probability-weighted outcomes, ranging from diplomatic resolution to broader regional conflict expansion. Investment positioning should reflect this uncertainty through diversification and hedging strategies.
Portfolio stress testing under various oil price environments reveals potential vulnerabilities in traditional asset allocation models. Current market conditions show gold declining 16% while silver dropped nearly 25% over the same period that saw Brent crude increase 50%, demonstrating how traditional safe-haven assets may not provide expected protection during energy crises.
Diversification Strategies
Geographic exposure balancing between oil-importing and oil-exporting economies can provide natural hedging against energy price volatility. Investments in Norwegian, Canadian, or Gulf Cooperation Council markets may offset losses in energy-dependent Asian or European markets.
Sector allocation adjustments should account for varying degrees of energy price sensitivity across industries. Energy companies, materials producers, and infrastructure operators may outperform during high price periods, while airlines, logistics companies, and consumer discretionary businesses typically face margin pressure.
Alternative investment considerations during commodity cycles include real assets such as commodities, real estate, and infrastructure investments that may provide inflation protection during periods of sustained energy cost increases.
Market participants must recognise that energy market volatility represents a structural feature of global economic systems rather than a temporary anomaly. The ASX 200 remains below 9,000 points as investors reassess risk premiums in an environment where multiple oil transportation corridors face potential disruption simultaneously.
Moreover, as trading economics commodity data indicates, the fundamental drivers of market volatility extend beyond immediate geopolitical tensions. Similarly, recent analysis from CNBC on oil price movements highlights how multiple conflict zones can create compounding supply risks.
Investment strategies should emphasise flexibility and diversification while avoiding concentration risks in either energy-dependent or energy-producing sectors. The current environment suggests that traditional correlations between asset classes may not hold during periods of extreme energy market stress, requiring adaptive portfolio management approaches that can respond to rapidly changing market conditions.
Consequently, an effective oil price crash analysis framework must incorporate both upside and downside scenarios, as Brent crude prices in Middle East conflict situations can experience rapid reversals when diplomatic solutions emerge or alternative supply sources come online. This volatility underscores the importance of maintaining balanced exposure across multiple asset classes and geographic regions during periods of heightened geopolitical uncertainty.
Considering Investments in Energy and Commodity Markets During Volatile Periods?
Discovery Alert's proprietary Discovery IQ model delivers real-time alerts on significant ASX mineral and energy discoveries, empowering subscribers to identify actionable opportunities ahead of broader market recognition during these uncertain times. Explore how major mineral discoveries can generate substantial returns by visiting Discovery Alert's dedicated discoveries page, and begin your 14-day free trial today to position yourself strategically in volatile commodity markets.