August 21, 2026
The Hidden Cost Architecture That Determines Whether Gold Miners Actually Profit
The assumption that rising gold prices automatically translate into rising gold miner profits is one of the most persistent and costly misconceptions in resource investing. Long before a single ounce reaches a refinery, the economics of gold extraction are shaped by a layered cost architecture where energy sits as a foundational input, not a marginal one. Understanding oil prices and gold mining costs — and how they interact — is therefore essential before drawing any conclusions about producer margins. When geopolitical events push crude oil prices toward the mid-to-high eighties, the transmission into mine-level economics is rarely linear and almost never uniform across producers.
Understanding how these dynamics interact, which mine types carry the greatest exposure, and what the mid-2026 reporting cycle actually reveals requires moving well beyond headline AISC figures into the operational mechanics that determine whether margin holds or erodes.
When big ASX news breaks, our subscribers know first
What Energy Actually Costs a Gold Mine: The Multi-Channel Transmission Model
Breaking Down the Energy Cost Channels in Gold Operations
Energy typically accounts for approximately 10% to 20% of total gold mining expenditure, with more detailed operational breakdowns placing the average closer to 12% of total operating costs. However, this figure understates energy's influence because crude oil does not enter mine economics through a single channel. It flows in through multiple cost streams simultaneously.
Furthermore, the commodity price impact of oil is felt across several distinct operational layers, not just at the fuel pump.
Primary energy cost channels in gold mining:
- Diesel fuel powers haulage trucks, excavators, water pumps, and ancillary equipment at the mine face
- Explosives used in drill-and-blast operations, primarily ammonium nitrate and emulsion-based products, are directly derived from petrochemical feedstocks and rise in cost alongside crude oil
- Freight and reagent delivery costs increase as fuel surcharges flow through from logistics providers
- Cyanide and processing reagents are energy-intensive to manufacture, creating an indirect but meaningful link to oil price movements
- Gas-fired and diesel-powered electricity generation at remote operations adds a further layer of fuel cost exposure
When oil prices rise sharply, each of these channels transmits cost pressure into AISC simultaneously, creating a compounding effect that is more severe than any single channel would suggest in isolation.
The $10 Per Barrel Rule: How Oil Price Movements Translate to Per-Ounce Costs
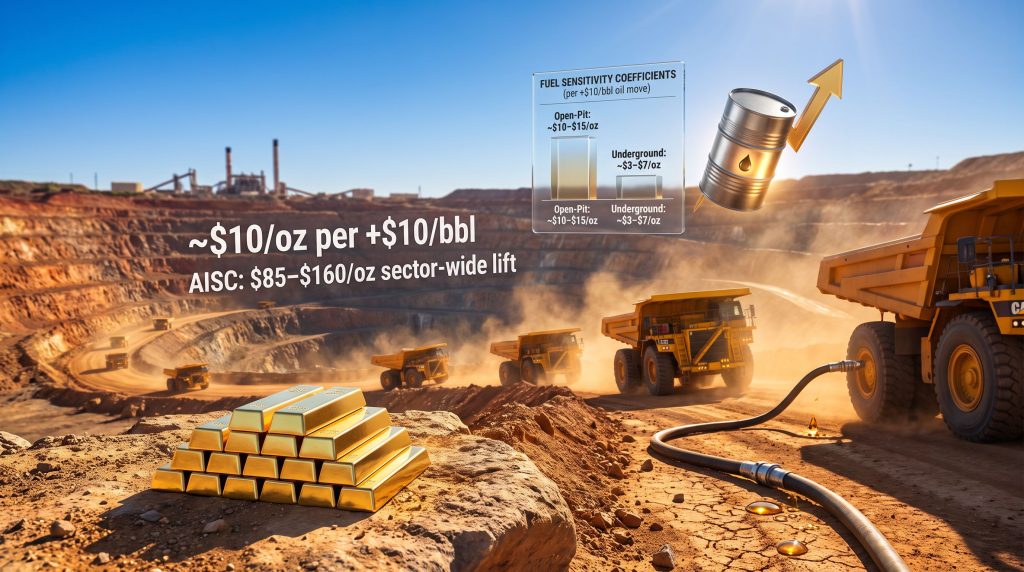
Analyst consensus suggests that a $10 per barrel increase in crude oil prices adds approximately $10 per ounce to gold mining all-in sustaining costs on average. BMO Capital Markets has estimated that a 10% rise in oil prices translates to approximately a 2% increase in mining costs across the sector. Gold Fields' internal modelling has placed the portfolio-level impact at approximately $40 to $50 per ounce under a sustained $100 per barrel assumption.
| Oil Price Scenario | Estimated Sector AISC Impact | Basis |
|---|---|---|
| +$10/bbl increase | ~$10/oz average addition | Analyst consensus |
| Oil at $90–$100/bbl sustained | ~$85–$160/oz sector-wide lift | 5%–9% AISC increase range |
| $100/bbl assumption | ~$40–$50/oz portfolio impact | Gold Fields internal modelling |
| 10% oil price increase | ~2% mining cost increase | BMO Capital Markets estimate |
Key analytical point: The $10/oz per $10/bbl figure is a sector average. Open-pit operations with high strip ratios and long haulage distances can experience materially larger impacts, while underground operations with lower diesel dependence often fall well below this average.
Research published on S&P Global Market Intelligence confirms that sustained high fuel prices push up gold miners' costs in ways that vary considerably by operation type and jurisdiction. The Strait of Hormuz conflict, which kept crude oil near $82 per barrel as of mid-August 2026, provides a live test of how this relationship plays out across different mine types and operating structures. The results through the first half of 2026 are more nuanced than a simple oil-up, costs-up narrative would suggest.
Open-Pit vs. Underground: Why Mine Architecture Is the Primary Cost Sensitivity Variable
The Structural Divide That Determines Diesel Exposure
Not all gold operations carry equal sensitivity to oil price movements. The single most important determinant of fuel cost exposure is whether a mine operates as an open-pit or underground system, because this choice governs the volume of diesel-powered equipment required and the distance over which material must be moved.
Open-pit operations:
- Depend on large diesel-powered truck fleets for continuous ore and waste movement
- Explosives consumption scales directly with the volume of rock drilled and blasted
- Strip ratios, the ratio of waste rock to ore mined, amplify fuel consumption per recoverable ounce as they increase
- Haulage distances from the active pit bench to the processing plant or waste dump compound per-tonne fuel burn
Underground operations:
- Move substantially lower volumes of material per ounce recovered
- Primary energy draws shift toward ventilation systems, hoisting, and development drilling
- Diesel exposure per tonne mined is lower, though electricity costs increase with mine depth
- Narrow-vein underground architectures further reduce material movement requirements
Strip Ratios and Haulage Distance: The Two Variables That Amplify or Dampen Oil Sensitivity
Two operational parameters determine whether a given mine sits above or below the sector average in its responsiveness to diesel price changes.
- Strip ratio — every unit increase in the waste-to-ore ratio means more diesel burned per recoverable ounce, so rising fuel prices hit high-strip-ratio operations with proportionally greater force
- Haulage distance — the longer the distance from the active mining face to the processing facility, the more fuel is consumed per tonne moved, amplifying the per-ounce cost impact of any diesel price increase
Engineering note: Pit-wall steepening is one lever available to open-pit operators seeking to reduce strip ratios and therefore fuel consumption per ounce. However, this approach introduces geotechnical risk and requires independent validation before any projected cost savings are incorporated into base-case margin models or investor guidance.
Monitoring crude oil price trends over rolling quarters is consequently essential for any investor building operation-specific cost models.
What 2026 Producer Data Actually Shows: A Mixed Picture, Not a Sector-Wide Surge
Cross-Producer AISC Performance in Mid-2026
The mid-2026 reporting period, against a backdrop of crude oil near $82 per barrel, provides empirical evidence that oil prices and gold mining costs do not move in lockstep across the industry. The divergence across just four producers illustrates how dramatically mine-specific variables can override the macro energy price signal.
| Producer | Operation | H1/Q2 2026 AISC | Guidance Range | Status |
|---|---|---|---|---|
| Integra Resources | Florida Canyon, Nevada | $3,371/oz (Q2, +28% YoY) | $3,300–$3,500/oz (revised +$550) | Above prior guidance |
| Mineros S.A. | Nechí (Colombia) + Hemco (Nicaragua) | $2,348/oz (H1) | $2,370–$2,470/oz | $22 below guidance floor |
| Serabi Gold | Narrow-vein underground, Brazil | Approaching low $2,000s | Not formally revised | Within tolerance |
| West Red Lake Gold | Madsen, Ontario | Not disclosed | Not disclosed | Unverifiable |
Integra Resources reported a particularly stark result at its Florida Canyon open-pit operation in Nevada. Second-quarter 2026 AISC reached $3,371 per ounce, a 28% increase year over year from $2,641 per ounce, while cash costs climbed 35% to $2,495 per ounce from $1,849. The full-year 2026 AISC guidance was subsequently revised upward by $550 per ounce to a range of $3,300 to $3,500 per ounce, placing it 42% to 50% above the $2,331 life-of-mine average stated in the company's June 2026 feasibility study.
Mineros S.A., operating across Colombia and Nicaragua, delivered the opposite result. First-half 2026 AISC of $2,348 per ounce came in below the lower boundary of its $2,370 to $2,470 guidance range by $22. Mineros also raised both ends of its full-year 2026 production guidance by 7,000 ounces to a range of 220,000 to 240,000 ounces, demonstrating that higher planned output did not require AISC to breach guidance during the first half.
West Red Lake Gold increased second-quarter output by 51% to 8,576 ounces from 5,667 ounces in the first quarter, with average mined grade rising 23% to 4.3 grams per tonne from 3.5 grams per tonne. However, without an AISC disclosure, these operational gains cannot be translated into a verified per-ounce cost comparison.
The divergence across these producers is itself the most important analytical finding from mid-2026. A single fuel price environment has produced wildly different cost outcomes, confirming that mine design, ore grade, and processing arrangements are stronger determinants of AISC than the prevailing oil price alone.
Consequently, investors tracking the gold price and mining equities relationship must account for these operation-level differences rather than applying a uniform cost assumption across the sector.
Gold-Linked Royalties: The Parallel Cost Escalator Most Analysts Underweight
How the Gold Price Itself Can Drive AISC Higher
One of the least discussed dimensions of gold mining cost analysis is the role of royalties and excise taxes that are contractually tied to the prevailing gold price rather than to physical input costs. This mechanism creates a structural cost escalator that operates entirely independently of diesel, explosives, labour, or consumables.
At Integra Resources' Florida Canyon operation, every $100 per ounce increase in the gold price adds approximately $7 per ounce to both cash costs and AISC through royalty and excise tax pass-throughs. Gold traded near $4,339 per ounce on August 19, 2026, approximately 22% below its January 2026 record of $5,595 per ounce, meaning the royalty mechanism alone was adding hundreds of dollars per ounce to Florida Canyon's cost structure relative to the historical period when the feasibility study's life-of-mine average was established.
Implications for cost interpretation:
- AISC increases observed during gold price rallies may partially or substantially reflect royalty pass-throughs rather than genuine operational deterioration
- Analysts who treat all reported AISC increases as evidence of fuel inflation will overestimate energy sensitivity and underestimate the structural royalty burden
- Operations carrying high royalty obligations in jurisdictions with gold-linked tax structures have embedded cost sensitivity to the very price that drives their revenue, creating a partial natural hedge on margin expansion during bull markets
- This dual-direction relationship also means that a sustained gold price decline would reduce royalty-driven AISC even if diesel prices remain elevated
The Feedback Loop Between Gold Prices and Average Production Costs
Rising gold prices create a second, less obvious mechanism through which sector-wide average costs increase. Higher prices make previously uneconomic ore grades viable, incentivise miners to extend operations into higher-cost zones, and encourage processing of lower-grade stockpiles that require more reagent and energy per ounce recovered. Each of these responses raises the sector's average cost of production independently of any input price movement.
In this context, the gold price outlook for 2025 and beyond carries direct implications for AISC trajectories, not just revenue lines. Investors identifying undervalued mining stocks must therefore carefully disaggregate royalty-driven cost escalation from genuine operational inefficiency before drawing margin conclusions.
The next major ASX story will hit our subscribers first
Three Structural Strategies Producers Are Using to Reduce Energy Cost Exposure
Strategy 1: Owner-Operated Processing Infrastructure
i-80 Gold is refurbishing its Lone Tree Complex in Nevada at an estimated cost of approximately $430 million, targeting major construction commencement in the fourth quarter of 2026 and first gold production in the fourth quarter of 2027. The central logic of the investment is vertical integration of ore processing, which eliminates third-party processing fees, gives the operator direct control over throughput scheduling and reagent consumption, and provides greater cost predictability regardless of the energy price environment.
Richard Young, President and Chief Executive Officer of i-80 Gold, has stated that commissioning the Lone Tree facility is expected to bring all-in sustaining costs below $2,000 per ounce. (Source: i-80 Gold corporate communications, 2026.)
Strategy 2: Underground Mining Architecture for Lower Fuel Intensity
Serabi Gold's narrow-vein underground operations in Brazil report a carbon intensity of approximately 0.57 tonnes of CO2 equivalent per ounce, compared to an approximate peer group average of 0.91 tonnes per ounce. This represents a roughly 37% reduction in carbon and fuel intensity relative to the peer average, a structural advantage derived from the mine's underground architecture rather than from any active carbon reduction programme.
Mike Hodgson, Chief Executive Officer of Serabi Gold, has acknowledged that AISC is trending toward the low $2,000s in 2026 despite elevated exploration spending, and that the combination of current gold prices and the company's cost structure leaves a margin of approximately $2,000 per ounce. (Source: Serabi Gold corporate communications, 2026.) Analysis from VanEck further supports the view that gold miners can be more resilient than their headline cost structures suggest, particularly when underground architecture reduces fuel dependency.
Strategy 3: Pit Geometry Optimisation
Integra Resources is targeting reductions in waste movement and associated fuel consumption at Florida Canyon by steepening pit-wall slopes. This engineering approach reduces the total volume of rock requiring excavation and haulage, directly cutting diesel consumption per recoverable ounce.
Investor caution: Quantified savings from pit-wall steepening have not yet been formally disclosed in updated feasibility studies or guidance. Until they are, this potential benefit should remain outside base-case margin models.
A Five-Step Framework for Building Company-Specific AISC Models Under Oil Price Pressure
Given how differently oil prices and gold mining costs interact across operations, a single sector-wide cost assumption is analytically inadequate. The following framework supports more rigorous, operation-by-operation modelling.
- Classify the operation by mine type. Apply higher fuel sensitivity coefficients of approximately $10 to $15 per ounce per $10 per barrel oil move for open-pit operations. Apply lower coefficients of approximately $3 to $7 per ounce for underground operations.
- Identify royalty and excise tax structures. Quantify the gold price pass-through rate embedded in royalty agreements and separate royalty-driven AISC increases from input-cost-driven increases in reported figures.
- Assess strip ratio and haulage distance. Request life-of-mine strip ratio data from company technical reports. Higher strip ratios amplify fuel cost sensitivity materially.
- Evaluate processing arrangements. Third-party processing introduces cost variability. Owner-operated processing provides greater cost predictability. Check whether agreements include energy cost pass-through clauses.
- Monitor quarterly guidance revisions for explicit fuel attribution. Fuel-related AISC guidance increases appearing across multiple producers over two to three consecutive quarters would signal a genuine sector-wide shift rather than operation-specific conditions.
Scenario Analysis: What Different Oil Price Trajectories Mean for 2026-2027 AISC
| Scenario | Oil Price Range | Estimated Sector AISC Impact | Key Monitoring Signal |
|---|---|---|---|
| Geopolitical escalation continues | $85–$100/bbl sustained | +5%–9% sector AISC (~$85–$160/oz) | Multiple producers revise guidance citing fuel |
| Partial de-escalation | $70–$82/bbl | Modest pressure; royalties and strip ratios dominate | Guidance revisions limited to high-strip operations |
| Significant oil price decline | Below $65/bbl | Fuel cost tailwind; royalties become dominant AISC driver | AISC reductions concentrated at open-pit producers |
| Extreme supply disruption | Above $100/bbl | Severe margin compression at diesel-intensive open-pit mines | Widespread guidance increases; hedging disclosures increase |
The two-to-three consecutive quarter confirmation threshold remains the appropriate standard before adjusting 2027 sector-wide AISC assumptions. This filter prevents seasonal fuel cost variations, one-off operational disruptions, and royalty-driven increases from being incorrectly classified as structural energy inflation.
Frequently Asked Questions: Oil Prices and Gold Mining Costs
What percentage of gold mining costs are energy-related?
Energy typically accounts for approximately 10% to 20% of total gold mining costs, with detailed operational breakdowns placing the average closer to 12% of total operating expenditure. Remote operations relying on diesel generation carry higher energy cost shares than grid-connected facilities.
Why do some gold producers report lower AISC even when oil prices are rising?
Several operational factors can offset rising fuel costs at the per-ounce level:
- Higher ore grades reduce the volume of material processed per ounce recovered
- Increased throughput spreads fixed costs across more ounces
- Improved haulage routing and equipment utilisation reduce fuel burn per tonne
- Diesel hedging contracts lock in lower prices for defined periods
- Mine design changes that reduce waste movement requirements
What is the difference between cash costs and AISC in gold mining?
Cash costs capture direct operating expenditure at the mine site, including mining, processing, and site administration. AISC is broader, adding sustaining capital expenditure, royalties, corporate overhead, and certain other costs. AISC is the more comprehensive and widely referenced metric for assessing the true economic cost of maintaining current production levels.
Does a higher gold price always increase AISC?
Not through physical inputs, but gold price-linked royalties and excise taxes create a structural mechanism through which AISC rises alongside the gold price. At Florida Canyon, a $100 per ounce increase in the gold price adds approximately $7 per ounce to both cash costs and AISC, entirely independent of diesel, labour, or consumable price changes.
Key Takeaways for Investors Modelling 2026-2027 Gold Mining Margins
- Energy represents 10%–20% of total gold mining costs and transmits oil price changes at roughly $10 per ounce per $10 per barrel move on average, but this figure masks enormous operation-level variation
- Open-pit operations with high strip ratios carry materially greater fuel sensitivity than underground mines, making mine architecture the primary determinant of oil price exposure
- Mid-2026 AISC data is genuinely mixed, with Integra Resources revising guidance up by $550 per ounce while Mineros reported first-half costs below its guidance floor, preventing any sector-wide conclusion about the relationship between oil prices and gold mining costs
- Gold-linked royalties create a parallel cost escalator that rises with the gold price independently of physical inputs, requiring analysts to disaggregate royalty effects from fuel inflation
- Owner-operated processing, underground mine architecture, and pit geometry optimisation are the three primary structural responses available to producers seeking to reduce energy cost exposure over the medium term
- Two to three consecutive quarters of fuel-attributed guidance increases across multiple producers remain the appropriate confirmation threshold before revising 2027 sector-wide AISC assumptions upward
Disclaimer: This article is for informational purposes only and does not constitute financial or investment advice. Forward-looking statements, cost projections, and scenario analyses involve inherent uncertainty. Readers should conduct independent research and consult qualified financial advisers before making investment decisions. Historical cost data and analyst estimates referenced are sourced from publicly available company disclosures and research, including the U.S. Energy Information Administration Short-Term Energy Outlook (August 2026) and publicly reported producer guidance.
Want to Track ASX Gold Discoveries Before the Market Catches On?
Discovery Alert's proprietary Discovery IQ model delivers real-time alerts on significant ASX mineral discoveries, instantly translating complex geological and commodity data into actionable investment insights — essential for investors navigating the nuanced cost dynamics explored above. Explore historic discovery returns on Discovery Alert's dedicated discoveries page and begin your 14-day free trial to position yourself ahead of the broader market.