
June 30, 2026
The Market as Truth-Teller: Why Price Signals Matter More Than Predictions
Investor psychology has a persistent flaw: it trusts narrative over evidence. In the months leading into the Iran-Israel conflict, consensus forecasts coalesced around a dramatic scenario where oil prices would breach $150 per barrel as Persian Gulf supply chains collapsed. Understanding why oil prices are not hitting $150 during the Iran war — when virtually every expert predicted otherwise — is the most important energy investing lesson of 2025. The question of oil price geopolitics has rarely been more relevant.
When major geopolitical events fail to produce the price extremes that sophisticated analysts predicted, the price signal itself becomes the most credible analytical instrument available. This is not a comfortable conclusion for forecasters, but it is the intellectually honest one.
When big ASX news breaks, our subscribers know first
Why Oil Prices Are Not Hitting $150 During the Iran War: The Core Question
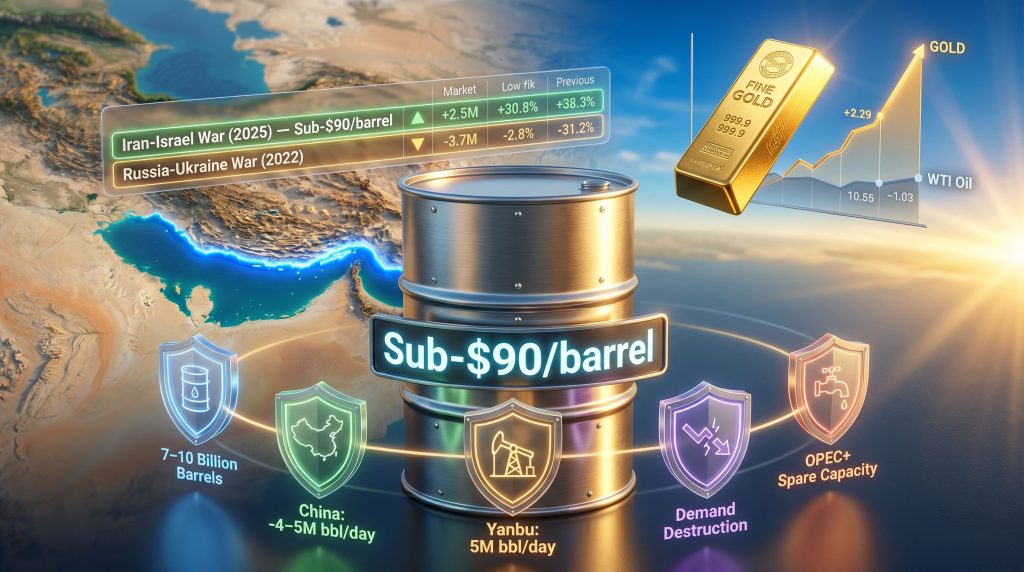
The central puzzle is straightforward to state and remarkably difficult to fully explain. West Texas Intermediate crude oil has continued trading below $90 per barrel throughout a conflict involving the closure of the Strait of Hormuz, a waterway through which approximately 14 million barrels per day of global supply normally flows. Even as Iran and Israel exchanged direct military strikes, WTI remained subdued.
For context, the Russia-Ukraine war in 2022 involved a far smaller volumetric disruption to global supply, and yet it produced price spikes that exceeded anything observed during the Iran conflict. This comparison is not a minor footnote; it is analytically devastating to the $150 thesis. Furthermore, understanding the broader trade war and oil relationship adds yet another layer to why prices have remained suppressed.
| Conflict Event | Peak WTI Price Response | Duration of Spike | Supply Volume Affected |
|---|---|---|---|
| Russia-Ukraine War (2022) | Exceeded Iran war highs | Multi-week surge | ~3-4M bbl/day |
| Iran-Israel War (2025) | Sub-$90/barrel | Muted and brief | ~14M bbl/day (Hormuz) |
| Arab Oil Embargo (1973) | Structural multi-year shift | Prolonged | ~5M bbl/day |
The pattern is striking. A conflict affecting nearly four times the daily supply volume of the Ukraine war produced a fraction of the price response. Something foundational in how global oil markets absorb shocks has changed, and it changed in ways that most analysts failed to anticipate.
What Structural Buffers Prevented the $150 Oil Price Scenario?
Buffer #1: The Inventory Stockpile Advantage
Global crude and refined product inventories entering the conflict were estimated at 7-10 billion barrels, providing markets with a substantial drawdown runway before physical scarcity could force repricing. Rather than immediately bidding up spot prices to reflect blocked supply, buyers drew from existing stocks, effectively buying time for alternative logistics and demand adjustments to take hold.
The critical nuance here is that inventory buffers represent a delay mechanism, not a structural fix. Barrels drawn from stockpiles cannot be instantly replenished. The resilience they provide is finite, and its expiry date matters enormously for understanding where oil prices may trend if the conflict extends beyond current expectations.
Buffer #2: China's Strategic Stockpiling — the Wildcard That Rewrote the Model
Perhaps the single largest analytical error made by pre-war forecasters was underestimating the scale of Chinese strategic reserve accumulation. Pre-war consensus models assumed China was purchasing somewhere between 500,000 and 750,000 barrels per day above its immediate consumption requirements. However, post-conflict analysis suggests this figure was dramatically understated.
The evidence for this is behavioural rather than statistical. China demonstrated a capacity to cut its oil imports by 4-5 million barrels per day without producing visible signs of economic disruption. That kind of demand elasticity is only possible if strategic reserves were operating at a depth no public model had accounted for. According to energy analysts, this revelation has permanently altered how markets must model Chinese demand in future supply shock scenarios.
Buffer #3: Alternative Routing Through Yanbu
Saudi Arabia's Yanbu port on the Red Sea coast has emerged as a critical bypass mechanism, enabling approximately 5 million barrels per day to reach global markets without transiting the Hormuz chokepoint. The effectiveness of this routing workaround has increased progressively as the conflict has extended, reducing the immediate price pressure that Hormuz closure advocates predicted.
This outcome has a geopolitical dimension that is frequently overlooked. Iran's strategic calculus almost certainly assumed that closing Hormuz would produce rapid and severe economic pain for importing nations. The combination of Chinese reserve drawdowns and Saudi alternative routing has, however, blunted that leverage considerably.
Buffer #4: Demand Destruction Economics
Oil markets contain a self-limiting price mechanism. Economic modelling indicates that a doubling of oil prices suppresses global demand by approximately 3-10%, depending on the mix of income levels in consuming economies. Lower-income nations are effectively priced out of consumption at elevated price levels, reducing total demand without any formal policy intervention.
This dynamic means that even in scenarios where supply drops sharply, the resulting price increase simultaneously destroys enough demand to partially rebalance the market. It is an uncomfortable mechanism because the burden falls most heavily on the poorest consumers globally, but it is a real and powerful price ceiling.
Buffer #5: OPEC+ Spare Capacity and Market Psychology
Markets also retained confidence that Saudi Arabia and other OPEC+ producers held finite spare capacity capable of partially offsetting lost Persian Gulf volumes. The OPEC market influence on price expectations has been significant throughout this period. While crude quality mismatches mean this spare capacity cannot fully substitute for all Hormuz-dependent grades, the perception of available backup supply has functioned as a psychological ceiling on speculative price escalation.
Is $150 Oil Still Possible? The Conditions That Could Break the Buffer System
The muted price response should not be read as a permanent resolution. Current buffers are time-limited, not structural. As Forbes has noted, three distinct scenarios remain capable of driving prices toward the $150-$200 range:
Scenario A: Extended Hormuz Closure Beyond Six Months
- Alternative routing reaches physical capacity limits
- Inventory buffers fully depleted, removing the primary shock absorber
- Demand destruction insufficient to offset the remaining supply gap
- Spot markets forced to reprice scarcity in real time
Scenario B: Physical Infrastructure Destruction in the Gulf
- Damage to major Saudi, UAE, or Iranian oil production or export infrastructure
- Spare capacity physically eliminated rather than theoretically constrained
- Insurance and shipping markets seize up, compounding supply restrictions
Scenario C: Ceasefire Collapse and Rapid Market Repricing
- Current oil prices have partially absorbed expectations of diplomatic resolution
- Sudden collapse of ceasefire expectations could compress months of gradual adjustment into days
- Speculative positioning could amplify the move significantly
Analysts project that 3-6 months of continued Hormuz closure could exhaust current inventory buffers sufficiently to make $150-$200 oil a plausible base case rather than a tail risk. The $150 scenario is deferred, not dismissed.
Most structural analysis places the $150 scenario as a tail risk that requires multiple simultaneous adverse developments. It is not a base case, but it is not fantasy either.
What the Iran War Reveals About Oil as a Long-Term Asset Class
The Strengthening Market Principle
Each major energy disruption of the past two decades has produced a wave of structural adaptation: emergency stockpile protocols, alternative routing investments, fuel switching infrastructure, and demand diversification. The Russia-Ukraine war accelerated the first generation of these adaptations. The Iran conflict, consequently, appears to be accelerating a second, more sophisticated generation.
This pattern reflects what might be called the resilience dividend of repeated energy shocks. Even governments with strong progressive environmental agendas have begun reconsidering whether physical possession of emergency reserves is preferable to paper commitments to distant supply sources.
The 60-Year Price Trajectory: What the Data Actually Shows
When global human energy consumption is plotted across six decades using data from the Statistical Review of World Energy, one of the most comprehensive unbiased datasets available to energy analysts, the result is a consistent upward-right trajectory. Disruptions including COVID-19, the Global Financial Crisis, and the Arab Oil Embargo appear as minor deviations rather than structural breaks.
The dominant long-run pattern is more energy consumed at progressively lower real prices. This statistical reality fundamentally challenges the structural bull case for sustained high oil prices, and it reframes how investors should think about energy as an asset class.
The Natural Gas Substitution Effect
U.S. natural gas is currently trading at the energy equivalent of approximately $18 per barrel of oil. Major multinational energy companies consistently report encountering enormous undeveloped gas reserves globally, measured in hundreds of trillions of cubic feet. As oil prices rise due to geopolitical disruption or cartel action, the economic incentive to switch toward gas, renewables, and alternative energy sources accelerates proportionally.
This substitution effect functions as a structural price ceiling that becomes more powerful the higher oil climbs. It represents one of several simultaneous dampening mechanisms — including demand destruction, fuel switching, and strategic stockpiling — that collectively make reaching and sustaining $150 oil significantly more difficult than it would have been during previous supply shock eras.
Gold vs. Oil: Why Two Crisis Assets Are Moving in Opposite Directions
A Comparison of Two Fundamentally Different Assets
| Characteristic | Gold | Oil |
|---|---|---|
| Asset Type | Inert monetary metal | Consumable energy commodity |
| Historical Monetary Role | 5,000+ years | None |
| Stock-to-Flow Ratio | Extremely high | Very low |
| Supply Response to Price | Minimal (fixed above-ground stock) | Significant (production and substitution) |
| Crisis Price Behaviour (2025) | All-time highs | Sub-$90 despite Hormuz closure |
The divergence between gold and oil during the Iran conflict reveals something important about how financial markets categorise these two assets. They are not interchangeable crisis hedges — they respond to entirely different mechanics. The broader gold safe-haven dynamics at play in 2025 further underscore this distinction.
Why Conflict Nations Are Selling Gold
Nations on the economically constrained side of the Strait of Hormuz entered the conflict holding significant positions in both gold and oil. With oil export revenues disrupted by the conflict itself, these nations face liquidity pressures requiring asset liquidation to fund ongoing operations.
Gold, as the most liquid non-sanctioned asset available to sanctioned or conflict-affected economies, becomes the logical source of emergency funding. This creates a counter-intuitive dynamic: war escalation can produce near-term gold price weakness as distressed sellers liquidate to cover revenue shortfalls.
The Post-War Gold Outlook
The wartime selling dynamic is likely temporary. The Iran conflict is simultaneously accelerating a broader geopolitical realignment — one that challenges the assumptions underlying unipolar U.S. military and financial dominance that have structured global markets since the early 1990s.
In addition, central bank gold demand was already elevated before the conflict began, and is likely to intensify in a post-war environment where U.S. dollar reserve status faces structural questioning. The post-conflict period may represent a structural re-rating moment for gold as a reserve asset, distinct from its wartime behaviour.
The next major ASX story will hit our subscribers first
Three Analytical Frameworks That Must Be Rebuilt After This Conflict
The Iran war has not simply produced a surprising price outcome. It has revealed that several foundational frameworks used to model global oil markets require fundamental revision:
-
Chinese Demand Elasticity Models: Pre-war assumptions about China's import dependency were materially understated. Strategic reserve depth must be re-estimated from baseline assumptions upward, and models must now account for the possibility of multi-million-barrel daily swing capacity.
-
Hormuz Inelasticity Assumptions: The long-standing belief that Strait of Hormuz closure automatically triggers catastrophic price action has been empirically challenged. Alternative routing capacity, particularly through Yanbu, is greater than most models assumed, and its effectiveness increases over time rather than degrading.
-
Geopolitical Risk Premium Calibration: The traditional war premium applied to oil prices must now account for the multi-layered resilience mechanisms that modern energy markets have developed. A risk premium framework built on 1970s or even 2000s dynamics is insufficient for today's energy system.
Frequently Asked Questions: Oil Prices, the Iran War, and the $150 Scenario
Why haven't oil prices hit $150 despite the Strait of Hormuz being closed?
Global markets entered the conflict with an estimated 7-10 billion barrels of inventory buffer, China drew down massive strategic reserves at a scale that surprised analysts, alternative routing through Saudi Arabia's Yanbu port redirected approximately 5 million barrels per day, and demand destruction economics naturally suppressed consumption at elevated prices. These mechanisms converged to collectively prevent the price spike most analysts forecast.
How long can current oil price buffers last before $150 becomes realistic?
Most structural analysis suggests that 3-6 months of continued Hormuz closure would deplete current inventory buffers sufficiently to make $150-$200 oil a plausible base case rather than a tail risk scenario.
Why did oil prices rise more during the Ukraine war than the Iran war?
The Ukraine conflict struck a global energy market with lower inventory levels and less strategic preparation. By contrast, major consuming nations, particularly China, entered the Iran conflict with historically elevated strategic reserves, dramatically reducing immediate demand pressure on global spot markets despite a far larger volumetric disruption.
What would actually be required for oil to reach $150 per barrel?
A combination of sustained Hormuz closure beyond six months, physical destruction of Gulf production infrastructure, or a sudden collapse of ceasefire expectations would need to converge simultaneously to drive prices to $150 in the current energy environment.
Is the $150 oil scenario permanently off the table?
No. The $150 scenario remains a tail risk rather than a base case. Current buffers are time-limited. If diplomatic resolution fails and inventory drawdowns continue, the structural conditions for extreme price action will reassemble. The timeline is uncertain, but the mechanism remains intact.
How has China's stockpiling changed global oil market dynamics?
China's demonstrated ability to absorb a 4-5 million barrel per day import reduction without visible economic disruption has revealed that strategic reserve accumulation was far larger than consensus estimates. This fundamentally alters how analysts must model Chinese demand elasticity in all future supply shock scenarios, making why oil prices are not hitting $150 during the Iran war a question with enduring analytical relevance.
Disclaimer: This article is intended for informational and educational purposes only. It does not constitute financial advice or a recommendation to buy or sell any financial instrument. All forecasts, scenarios, and price projections referenced involve inherent uncertainty. Readers should conduct their own research and consult qualified financial advisors before making investment decisions. Past market behaviour during geopolitical events is not necessarily indicative of future outcomes.
Want to Stay Ahead of the Next Major Market-Moving Discovery?
While geopolitical events reshape energy markets in unexpected ways, significant mineral discoveries on the ASX can offer equally compelling opportunities — and Discovery Alert's proprietary Discovery IQ model ensures subscribers receive real-time alerts the moment these discoveries are announced, turning complex data into actionable investment insights. Explore how historic discoveries have generated substantial returns on Discovery Alert's dedicated discoveries page, and begin your 14-day free trial today to position yourself ahead of the broader market.