July 16, 2026
Geopolitical Risk Returns: How a Diplomatic Collapse Sent Oil Surging More Than 5%
Energy markets have a long memory for chokepoints. Throughout history, every time political tension has threatened the narrow maritime corridors that carry the bulk of the world's crude supply, oil futures have responded with sharp, often disproportionate moves. The psychology is straightforward: traders do not wait for actual barrels to disappear before repricing. They reprice the probability of disappearance, and that repricing happens in minutes, not days.
That mechanism was on full display on July 8, 2026, when oil jumps after Trump says deal with Iran over became the defining headline across global energy markets. What unfolded was not simply a price spike. It was a comprehensive reassessment of supply risk that exposed how thin the diplomatic buffer had become and how rapidly short-side positioning could be unwound when geopolitical certainty evaporates.
When big ASX news breaks, our subscribers know first
From Ceasefire Optimism to Diplomatic Collapse: The Sequence That Shocked Markets
Understanding why crude moved so violently requires tracing the chain of events that immediately preceded July 8. When Pakistan brokered a memorandum of understanding between Washington and Tehran in mid-June 2026, the agreement created what traders interpreted as a credible 60-day diplomatic window. That interpretation had direct consequences for oil price movements: Brent crude fell back toward pre-war levels, and a substantial cohort of speculative traders began building net short positions, anticipating continued supply normalisation.
The timeline below captures how quickly the situation deteriorated:
| Date | Event | Market Response |
|---|---|---|
| Late February 2026 | Conflict between U.S. and Iran begins | Initial supply shock; oil prices surge |
| Mid-June 2026 | Pakistan-brokered MOU signed | Oil prices retreat to pre-war levels |
| July 6, 2026 | Brent crude trading in contango | Traders positioned for continued supply recovery |
| July 7, 2026 | U.S. revokes general licence for Iranian crude sales | Brent rises approximately 3% |
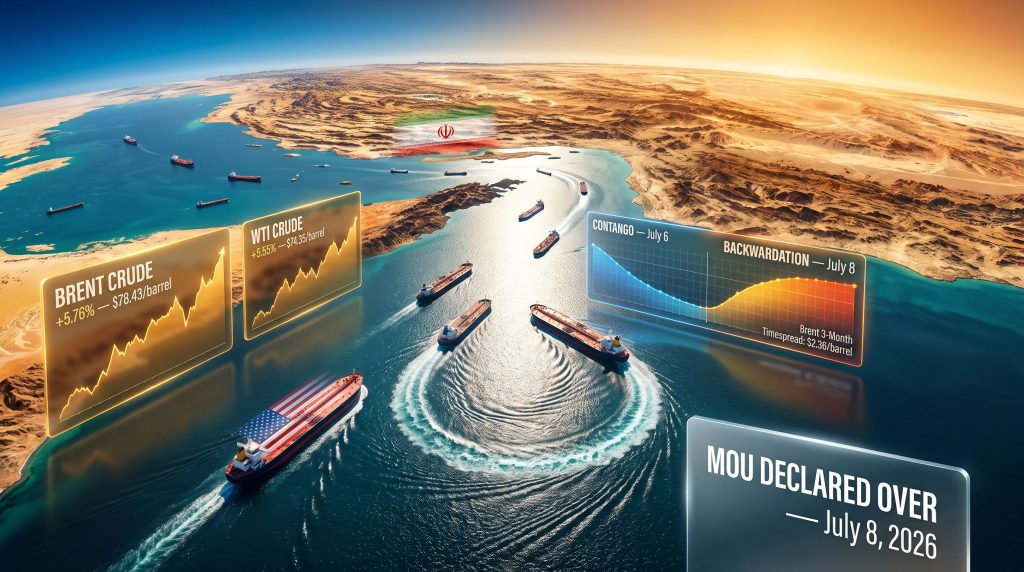
| July 8, 2026 | Trump publicly declares MOU over | Brent surges 5.76%; WTI surges 5.55% |
The revocation of Iran's crude export licence on July 7 was itself a significant signal, delivering a roughly 3% gain to Brent in a single session. However, the full force of market repricing arrived the following morning when President Trump stated publicly that the MOU was finished and that he had no interest in further engagement with Tehran. Crucially, the president's remarks did not merely pause negotiations. They removed the entire diplomatic architecture that had been suppressing the geopolitical risk premium in crude pricing.
The Raw Numbers Behind the Crude Rally
The scale of the price move on July 8, 2026 was significant by any measure. By mid-afternoon Saudi time:
- Brent Crude Futures rose $4.27 per barrel, or 5.76%, reaching $78.43 per barrel, with intraday peaks reported near the $78.80 to $80.00 range
- WTI (West Texas Intermediate) climbed $3.91 per barrel, or 5.55%, to $74.35 per barrel, with peak levels approaching $75.00 per barrel
- Both benchmarks registered their highest readings since June 22, effectively erasing the discount that had been built into prices following the MOU
Critically, these gains followed back-to-back sessions of significant appreciation. The market had already absorbed a 3% rally on July 7 before adding another 5%-plus on July 8. For context, a combined two-day move of roughly 8 to 9% in a major commodity benchmark is an event that forces institutional risk managers across the industry to reassess exposure.
The Futures Curve Signal That Traders Were Watching Most Closely
Beyond the headline price numbers, the structural shift in the Brent futures curve carried important information for sophisticated market participants. The Brent three-month timespread widened to $2.36 per barrel, its highest level since June 16. More consequentially, the market flipped from contango into backwardation within just two trading sessions, having been in contango as recently as July 6.
Furthermore, as reported by the BBC, this structural shift was widely interpreted as reflecting genuine near-term supply anxiety rather than speculative noise.
Backwardation in crude oil markets occurs when near-term futures contracts trade at a premium to longer-dated contracts. It is widely interpreted as a structural signal of near-term supply tightness. When markets flip from contango to backwardation rapidly, it reflects a sudden and significant reassessment of how much oil is available to physical buyers in the immediate term.
The speed of this structural shift is what made the July 8 move particularly notable. A gradual drift into backwardation over weeks would suggest incremental tightening. A flip across two trading sessions signals that the market fundamentally repriced the near-term supply outlook in real time.
The Strait of Hormuz: Anatomy of the World's Most Consequential Chokepoint
No analysis of this price move is complete without understanding why the Strait of Hormuz commands such an outsized role in oil market psychology. The strait is a narrow navigable passage connecting the Persian Gulf to the Gulf of Oman, bordered by Iran to the north and Oman and the United Arab Emirates to the south. At its narrowest point, the navigable shipping channel is only about two miles wide in each direction.
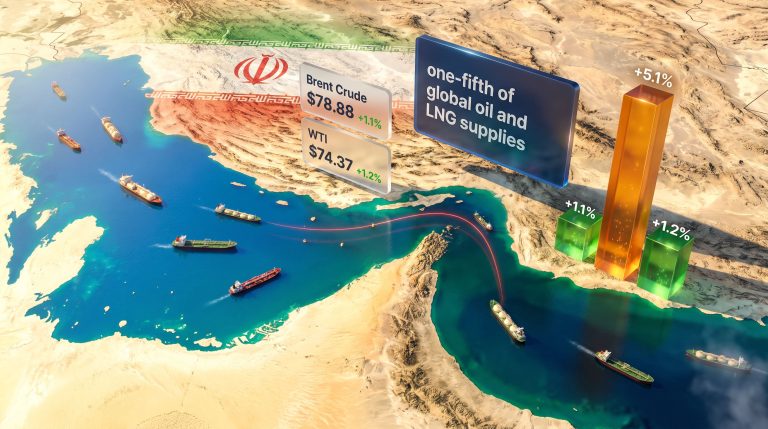
Before the conflict began in late February 2026, the strait carried approximately one-fifth of all global energy supply, including crude oil, refined products, and liquefied natural gas. There is no practical large-scale alternative routing for Persian Gulf producers. Unlike some chokepoints where bypass infrastructure exists in partial form, the Persian Gulf has no equivalent to the Suez Canal bypass pipelines available in Egypt. The strait is, for the Gulf producers who depend on it, effectively irreplaceable.
What the Ship-Tracking Data Revealed
The consequences of renewed tension were not purely theoretical. Real-world tanker behaviour began shifting almost immediately:
- At least four oil and gas tankers reversed course and abandoned planned Strait of Hormuz transits following the renewed escalation
- U.S. Central Command confirmed that American airstrikes on Iran were conducted in direct response to Iranian attacks on three commercial vessels transiting the strait
- Iran's Revolutionary Guards subsequently announced retaliatory strikes targeting U.S. military installations in Bahrain and Kuwait
This sequence carries particular significance for energy market analysts. The attack-response-retaliation cycle represents a classic escalatory ladder, and each rung of that ladder increases the actuarial probability of sustained strait disruption. Energy traders are, in effect, pricing insurance against that probability, and that insurance becomes dramatically more expensive when the ladder is actively being climbed.
The Short Squeeze Mechanism That Amplified the Rally
A factor that is often underappreciated in media coverage of geopolitical oil spikes is the role of positioning dynamics in amplifying price moves. The impact on oil markets from forced short-covering is often as significant as the geopolitical trigger itself, particularly when traders had accumulated large net short positions during the preceding weeks of ceasefire optimism.
When the MOU collapsed, those positions became loss-making almost instantly. The resulting forced short-covering created a mechanical buying surge that compounded the price impact of the geopolitical news itself. This reflexivity dynamic means that the size of a crude oil rally in a geopolitical crisis is partly a function of how complacent market positioning had become in the preceding weeks.
Nations had also been actively drawing down strategic petroleum reserves since the conflict began to compensate for supply shortfalls. This drawdown, while stabilising in the short term, progressively reduces the buffer capacity available to absorb future disruptions, making subsequent price spikes larger and harder to contain through policy intervention alone.
Analyst Perspectives and Institutional Forecasts
Market commentary from analysts in the immediate aftermath of the July 8 move reflected the depth of uncertainty now facing energy traders.
Saxo Bank analyst Ole Hansen described the market as being forced to re-price the risk that renewed vessel attacks, or a broader deterioration in U.S.-Iran relations, could slow or reverse the normalisation of flows through the Strait of Hormuz. This framing is precise: the core concern is not a complete closure of the strait, but rather a slowing of the normalisation process that markets had been pricing in.
Separately, the head of research at MST Marquee characterised Trump's declaration as raising the prospect of the strait effectively re-closing as a new escalatory cycle gets underway. The distinction between a full closure and a partial or intermittent disruption is important. Even a partial disruption capable of routing significant tanker traffic around the Cape of Good Hope would add weeks to transit times and meaningfully tighten the physical market.
Institutional Price Forecasts: Where Banks Stand
| Institution | 2026 Brent Forecast | Core Assumption |
|---|---|---|
| HSBC | $80/barrel (revised down from $95) | Gulf exports normalise by end of September 2026 |
| Pre-July 8 market consensus | Below $75 | Continued MOU compliance and supply recovery |
| Post-July 8 risk scenario | $85 to $95+ | Sustained strait disruption or expanded conflict |
HSBC's downward revision of its 2026 Brent forecast from $95 to $80 per barrel was made on the explicit assumption that Gulf oil exports would normalise by late Q3 2026. The collapse of the MOU places that assumption under direct pressure. If normalisation is delayed by even one quarter, the $80 forecast becomes vulnerable to upward revision. In addition, the crude oil volatility generated by this episode has forced many institutional desks to widen their scenario ranges considerably.
Mapping the Supply Shock Scenarios
Energy analysts and traders are currently evaluating three broad scenarios for how the Strait of Hormuz situation evolves from here:
-
Partial Disruption – Tanker operators reroute via the Cape of Good Hope, adding 10 to 15 days of transit time and substantial freight costs. Global supply tightens but does not collapse. Brent likely trades in the $80 to $90 range.
-
Sustained Closure – The strait becomes impassable to commercial traffic for an extended period. Approximately 20% of global energy supply faces immediate disruption. IEA member nations activate coordinated strategic reserve releases. Prices could approach or exceed levels seen during the 2022 energy crisis.
-
Diplomatic Re-engagement – New intermediary talks through Oman, Qatar, or a European framework produce a revised ceasefire agreement. Markets retrace 50 to 70% of the July 8 gains within days as short positions are rebuilt.
Each scenario carries radically different implications for downstream industries, including airlines, petrochemical manufacturers, and shipping operators, all of whom use crude-linked pricing benchmarks in their cost structures.
The China Variable: A Demand-Side Wildcard
Adding another layer of complexity to the outlook, China announced on the same day as Trump's declaration that it had lifted refined fuel export restrictions for the remainder of July and permitted a private refiner to resume shipments after a four-month halt. This is not a minor data point.
Chinese refinery activity resuming at scale creates a compounding demand-side pressure on global refined products markets, arriving simultaneously with the supply-side shock from Middle East disruption. The historical precedent for simultaneous supply restriction and demand acceleration in oil markets points consistently toward sustained price elevation rather than a quick mean reversion. Consequently, geopolitical tensions of this nature have increasingly become a structural feature of energy pricing rather than a transient event.
The next major ASX story will hit our subscribers first
Key Variables to Monitor in the Weeks Ahead
For investors and market participants tracking this situation, the following data points will serve as the most reliable leading indicators of where oil prices are headed:
- Real-time tanker tracking data through the Strait of Hormuz will provide the earliest indication of whether physical supply is being meaningfully disrupted
- U.S. diplomatic signals regarding any back-channel engagement with Tehran despite the public rejection of the MOU framework
- OPEC's global influence and spare capacity utilisation, and whether Gulf producers attempt to compensate for any Iranian supply shortfall
- IEA strategic reserve coordination and the pace of any coordinated release among member nations
- Net speculative positioning in WTI and Brent futures, which will indicate whether the short-covering cycle has fully run its course or has further to go
As ABC News reported, the broader context of U.S. strikes on Iran has compounded the urgency with which traders and policymakers alike are reassessing their assumptions about Middle East supply stability.
Disclaimer: This article is intended for informational purposes only and does not constitute financial or investment advice. Oil price forecasts and geopolitical scenarios discussed herein are subject to rapid change. Readers should conduct their own due diligence and consult qualified financial advisors before making investment decisions based on commodity price movements.
FAQ: Oil Prices, Iran, and the Strait of Hormuz
Why do oil prices react so sharply to U.S.-Iran tensions?
Iran is geographically positioned at the edge of the Strait of Hormuz, through which roughly one-fifth of global energy supply passes. Any credible threat to that transit corridor forces immediate risk repricing across crude benchmarks globally. This was precisely the dynamic that saw oil jumps after Trump says deal with Iran over dominate market headlines on July 8, 2026.
What does it mean when oil markets flip from contango to backwardation?
Contango describes a market where future-dated oil contracts trade at a premium to spot prices, typically signalling expected supply recovery. Backwardation is the inverse, with spot prices exceeding future prices, indicating that traders expect near-term supply to be constrained. The two-session flip from contango to backwardation on July 6 to 8, 2026 reflected a dramatic and rapid reassessment of immediate supply risk.
What was the Pakistan-brokered MOU?
The memorandum of understanding was a Pakistan-mediated interim diplomatic agreement designed to create a 60-day window for the U.S. and Iran to negotiate a broader resolution to their conflict. It came under strain following fresh U.S. airstrikes on Iran and was publicly declared finished by President Trump on July 8, 2026.
How does a ceasefire collapse affect retail fuel prices?
Sustained Brent crude prices above $80 to $85 per barrel typically translate into higher retail fuel costs within two to four weeks, depending on refining margins, local tax structures, and currency dynamics in each market.
What are strategic petroleum reserves and why do drawdowns matter?
Strategic petroleum reserves are government-held crude oil stockpiles designed to buffer against supply disruptions. When nations draw them down during a conflict, as has occurred since February 2026, the available cushion for future disruptions shrinks, making subsequent price spikes larger and harder to contain.
For ongoing coverage of Gulf energy markets and regional geopolitical developments, readers can follow reporting from Arab News Energy.
Want to Stay Ahead of the Next Major Resource Discovery Triggered by Geopolitical Shifts?
While oil markets reprice risk in real time, significant mineral discoveries on the ASX can move just as swiftly — and Discovery Alert's proprietary Discovery IQ model delivers instant alerts the moment a major discovery is announced, ensuring subscribers are positioned ahead of the broader market. Explore historic discovery returns to understand the scale of opportunity these moments can create, and begin a 14-day free trial at Discovery Alert to gain an immediate edge on high-potential ASX announcements.