July 16, 2026
The Chokepoint That Controls Everything: How Hormuz Shapes Global Energy Pricing
Energy markets have always been vulnerable to geography. Unlike equities or currency pairs, crude oil cannot be rerouted through a server or redirected via a software update. It moves through physical corridors, and when those corridors are threatened, prices respond in ways that no other asset class quite replicates. The Strait of Hormuz has long been the most consequential of these corridors, and oil rises after US strikes on Iran have placed this narrow waterway back at the centre of global energy pricing dynamics.
Understanding why oil rises after US strikes on Iran requires more than tracking headlines. It demands a structural understanding of how geopolitical risk gets embedded into crude benchmarks, why diplomatic failure often moves prices more aggressively than military action, and what the cascading effects look like across global supply chains. For a broader view, the crude oil geopolitics analysis provides essential context on how macro forces are shaping the market.
When big ASX news breaks, our subscribers know first
The Architecture of the War Risk Premium
Every barrel of crude oil traded on global markets carries an embedded risk premium that reflects the probability of supply disruption. In stable periods, this premium is negligible. During active conflict near critical infrastructure, it can add $10 to $20 per barrel or more to prevailing prices, depending on the severity and duration of perceived disruption.
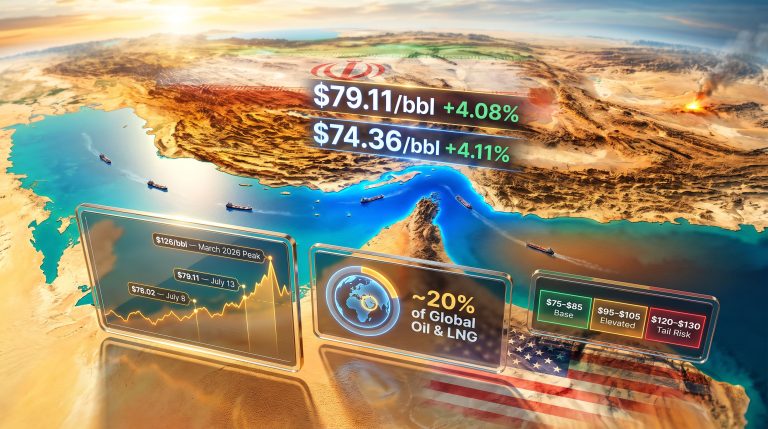
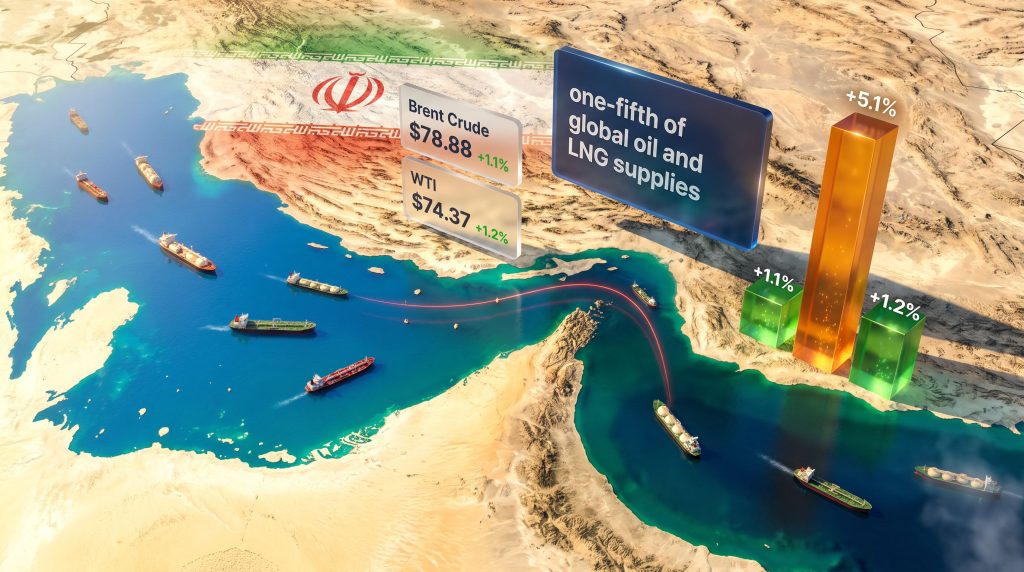
The Iran-US conflict carries a structurally larger premium than most regional flashpoints because of a single variable: Tehran's geographic control over the Strait of Hormuz. No other party in any comparable conflict has the ability to threaten the simultaneous disruption of approximately one-fifth of global oil and LNG supplies by leveraging a single piece of coastline.
Historical precedent reinforces this dynamic. During the Gulf War of 1991, Brent crude spiked from roughly $20 to nearly $40 per barrel before collapsing as coalition forces secured the theatre. The 2003 Iraq invasion produced a more muted response because Hormuz was not directly threatened. The 2019 Abqaiq-Khurais drone strikes on Saudi Aramco infrastructure triggered a single-session spike exceeding 14%, the largest intraday jump in decades at that time, yet prices normalised within weeks because the strait itself remained open. The current conflict is different because the strait is the conflict's primary strategic battlefield.
Why Brent and WTI Respond Differently to the Same Event
The two dominant crude benchmarks do not move in lockstep during conflict events, even when the underlying supply threat is identical. Their divergence reveals something important about how markets compartmentalise geopolitical risk.
| Benchmark | Pre-Strike Price | Post-Strike Price | % Change | Primary Driver |
|---|---|---|---|---|
| Brent Crude | ~$78.02 | $78.88 | +1.1% | Hormuz supply risk |
| WTI Crude | ~$73.52 | $74.37 | +1.2% | US export competitiveness |
| Brent (prior session) | ~$74.05 | ~$77.90 | +5.1% | Ceasefire collapse |
| WTI (prior session) | ~$70.44 | ~$73.89 | +4.9% | Naval blockade reimposition |
Brent, as the globally traded benchmark with stronger exposure to seaborne crude flows, responds more directly to Hormuz-specific risk. WTI, while linked to domestic US production, benefits from the competitiveness dynamics of US shale exports when Middle Eastern supply becomes uncertain. Both move upward during escalation, but the underlying logic differs.
Furthermore, the more significant observation from the data above is that the 5%+ single-session surge occurred not when bombs fell, but when diplomacy collapsed. Markets had partially priced in military action. What they had not priced in was the complete removal of the supply restoration narrative.
The Strait of Hormuz: Why No Chokepoint Compares
The Strait of Hormuz is a navigable passage approximately 33 kilometres wide at its narrowest point, situated between Iran's southern coastline and the Omani exclave of Musandam. Every major Gulf producer, including Saudi Arabia, the UAE, Kuwait, Iraq, and Qatar, depends on this passage to export crude oil and liquefied natural gas to global markets.
Prior to the current conflict, between 17 and 21 million barrels per day of crude oil and petroleum products transited the strait, alongside approximately 20% of globally traded LNG. There is no pipeline alternative capable of substituting this volume at scale. The East-West Pipeline across Saudi Arabia and the Petroline can handle roughly 5 million barrels per day, a meaningful but incomplete bypass that leaves the bulk of Gulf export capacity dependent on maritime access.
Iran's strategic positioning along the strait's northern shoreline provides it with a layered deterrence architecture:
- Coastal anti-ship missile batteries capable of engaging vessels in the shipping lanes
- Fast-attack naval craft designed for swarm tactics against large commercial vessels
- Underwater mine-laying capability, historically deployed in the 1980s Tanker War
- Surveillance and targeting infrastructure integrated along the coastline
The approximately 90 Iranian military targets struck by US forces in the latest operation specifically addressed this architecture, including air defence systems, coastal surveillance assets, missile and drone storage facilities, and naval logistics infrastructure. The intent was to degrade Iran's capacity to enforce maritime interdiction, but degrading capability is not the same as eliminating it. According to NBC News, oil prices jumped sharply following the strikes as markets responded to the escalating threat to regional supply routes.
The Asymmetric Logic Behind Iran's Hormuz Strategy
Iran cannot match US conventional military power in an open engagement. What it can do, however, is impose disproportionate economic costs by threatening the global supply chain that developed economies depend on. A single successful attack on a VLCC (Very Large Crude Carrier) in the shipping lane generates immediate insurance market responses, route avoidance decisions by shipowners, and price spikes that far exceed the physical damage caused.
War risk insurance premiums for Hormuz transit routes have historically escalated by 300 to 800 percent during active conflict phases. When these premiums spike, even vessels not directly targeted begin avoiding the route, creating a supply disruption that is market-driven rather than physically enforced. This amplification effect means Iran's actual interdiction capability matters less than the credible threat of using it.
How the Ceasefire Collapse Became the Market-Moving Event
The sequence of escalation that produced the latest price surge is instructive for understanding how energy markets process political information. Consequently, the oil price shock registered across global energy producers almost immediately following the ceasefire breakdown.
- An interim ceasefire agreement between Washington and Tehran had been reached, causing oil prices to retreat as traders priced in a gradual restoration of Hormuz traffic
- Iranian forces attacked at least one LNG tanker operating in the strait, followed by assaults on three commercial vessels
- President Trump declared the interim agreement terminated, triggering a 5%+ single-session surge in Brent crude to a two-week high
- US Central Command launched fresh strikes targeting approximately 90 Iranian military installations along the coastline
- Iran retaliated with attacks on US military facilities in Bahrain and Kuwait, broadening the conflict's geographic footprint
- Brent settled at $78.88, up 1.1%, while WTI reached $74.37, up 1.2%, as the market processed the new escalation baseline
ING analysts noted that the fresh US strikes had undermined confidence in the fragile ceasefire framework, with the escalation directly threatening supply stability across the region's maritime corridors. This framing captures something important: the market was not simply reacting to the strikes themselves, but to the destruction of a forward-looking narrative that had been suppressing the risk premium.
When a ceasefire collapses, markets lose more than a diplomatic agreement. They lose the pricing model they had built around supply restoration expectations. The repricing is therefore larger than the underlying physical change in supply would warrant.
Supply Disruption and the Sanctions Escalation
Military action was not the only mechanism tightening supply. The US response included the revocation of export permits that had previously allowed Iranian crude to reach international buyers during the ceasefire window, alongside the reimposition of a naval blockade on Iranian ports. The combined effect removed a meaningful volume of crude from accessible global supply at precisely the moment when Hormuz transit uncertainty was already elevating the risk premium.
| Supply Variable | Pre-Conflict Estimate | Post-Escalation Scenario |
|---|---|---|
| Iranian crude exports | ~1.5-1.8 mb/d | Severely constrained |
| Hormuz daily throughput | ~17-21 mb/d | Disrupted/reduced |
| LNG shipments affected | ~20% of global LNG | Rerouting underway |
| OPEC+ spare capacity buffer | ~3-4 mb/d | Partially activated |
Saudi Arabia and other Gulf OPEC+ members face a genuinely complex dual pressure in this environment. Higher prices benefit their fiscal positions, but any prolonged Hormuz disruption threatens their own export routes. This shared strategic vulnerability creates an incentive for Gulf producers to quietly support de-escalation even while benefiting from near-term price strength. In addition, the oil price crash risks associated with an OPEC+ supply response add another layer of uncertainty to the medium-term outlook.
What Analysts Are Forecasting: Volatility With a Downward Medium-Term Bias
DBS Bank's head of energy research has argued that Iran retains strong incentives to prolong negotiations, which means the war risk premium embedded in oil prices may not fully dissipate for several months. The expectation is for continued volatility against a medium-term trajectory that tilts gradually downward as market participants adapt to the new supply geography.
This framework produces three distinct price scenarios depending on how the conflict evolves:
| Scenario | Trigger Condition | Brent Price Range | Expected Duration |
|---|---|---|---|
| Rapid De-escalation | New ceasefire holds, Hormuz reopens | $68-$72/barrel | 1-3 months |
| Prolonged Stalemate | Negotiations drag, partial disruption | $75-$82/barrel | 3-9 months |
| Full Hormuz Closure | Major escalation, strait blocked | $95-$110+/barrel | Unpredictable |
An important counterweight to the war premium is the inflation feedback loop. Higher energy prices feed directly into consumer price indices, which creates pressure for central bank tightening responses that suppress demand. This self-limiting dynamic partly explains why Thursday's gain of 1.1% was considerably more modest than the prior session's 5%+ surge. Macro headwinds were competing with supply risk narratives in real time.
The LNG Market as a Secondary Shock Vector
A dimension of this conflict that receives less attention than crude oil is its impact on LNG markets. The Iranian attack on an LNG tanker in the strait was not incidental; it was a deliberate signal about Tehran's willingness to target the energy infrastructure that importing nations depend on as an alternative to pipeline gas. The broader LNG supply outlook suggests these disruptions could have lasting implications well beyond the current conflict window.
European nations that restructured their energy imports toward LNG dependency following the 2022 Russia-Ukraine disruption now face compounded vulnerability. Spot LNG prices in Asia-Pacific markets have historically spiked 15 to 30 percent during Hormuz disruption events, creating price contagion that extends well beyond crude oil markets.
Asia-Pacific importers, including China, India, Japan, and South Korea, are structurally the most exposed to Hormuz disruption because the majority of crude transiting the strait flows eastward. European buyers face secondary exposure through LNG price contagion and refined product markets. The US domestic market has greater insulation due to shale production capacity, but WTI price correlation means no economy is fully immune.
The next major ASX story will hit our subscribers first
Five Variables That Will Drive Oil Prices From Here
For investors and energy market participants monitoring this situation, the following indicators represent the most consequential real-time signals:
- Hormuz vessel traffic data – Daily transit counts are the most immediate physical indicator of actual disruption versus perceived risk
- US CENTCOM operational communications – Further strike announcements signal sustained engagement; extended pauses open negotiation windows
- Iranian retaliation scope – Attacks on Gulf Arab infrastructure in Bahrain and Kuwait represent a geographic broadening that adds a new layer of regional risk
- OPEC+ unscheduled communications – Any emergency meeting signal suggests producers are preparing a supply management response to abnormal conditions
- Quiet diplomatic channel activity – Back-channel negotiations between Washington and Tehran can reverse the risk premium faster than any military development
| Indicator | Bullish for Oil | Bearish for Oil |
|---|---|---|
| Hormuz vessel traffic | Sharp decline in transits | Resumption of normal flow |
| US CENTCOM statements | New strike announcements | Mission completion language |
| Iranian state media | Retaliation threats | Ceasefire acceptance signals |
| War risk insurance rates | Continued premium elevation | Rates normalising |
| IEA/SPR announcements | No coordinated release | SPR release activated |
The Enduring Structural Reality of Hormuz
What distinguishes this conflict from previous Iran escalation episodes is the explicit targeting of the ceasefire framework itself. In earlier pressure campaigns, there was no expectation of a negotiated resolution to be destroyed. Here, markets had built forward pricing models around supply restoration, and those models collapsed within a single session when Trump declared the interim deal terminated.
This creates a more volatile pricing environment precisely because expectations had shifted. Geopolitical risk in oil markets is non-linear: small escalations at critical diplomatic junctures produce disproportionate price responses because they destroy not just current conditions, but the anticipated future conditions that traders had already discounted. OilPrice.com reports that markets reacted swiftly as oil rises after US strikes on Iran renewed fears of a sustained regional conflict. Furthermore, the trade war oil markets dynamic adds yet another dimension of uncertainty, as tariff pressures compound the supply-side risks already embedded in global crude pricing.
The Hormuz chokepoint remains the single most consequential geographic variable in global energy pricing. No amount of shale production growth, renewable energy deployment, or strategic reserve accumulation has changed the fundamental arithmetic: when nearly a fifth of global oil and LNG supply depends on safe passage through 33 kilometres of water controlled by one party to an active armed conflict, the market will price that risk accordingly.
Disclaimer: This article contains forward-looking scenarios and market analysis based on publicly available information as of the date of publication. Oil price forecasts and conflict scenarios discussed herein represent analytical frameworks and should not be construed as financial advice. Energy markets are subject to rapid change, and actual outcomes may differ materially from any projections cited.
Want to Stay Ahead of the Next Major Commodity Market Shift?
When geopolitical flashpoints like the Strait of Hormuz crisis reshape global energy pricing in real time, the investors who act fastest gain the greatest advantage — Discovery Alert's proprietary Discovery IQ model scans ASX announcements daily, delivering instant alerts on significant mineral and commodity discoveries so subscribers can identify actionable opportunities before the broader market reacts. Explore historic discovery returns on Discovery Alert's dedicated discoveries page and begin your 14-day free trial today to position yourself ahead of the next major market movement.