July 16, 2026
The Hidden Architecture of Crude Oil Pricing During Geopolitical Shocks
Most investors instinctively associate oil price spikes with supply cuts or OPEC decisions. Far fewer understand the precise mechanical sequence that unfolds when military force is applied to the world's most consequential shipping lane. The oil prices Strait of Hormuz strikes dynamic does not behave like a typical commodity supply variable. It functions more like a systemic circuit breaker: when it trips, the shock travels simultaneously across crude oil, liquefied natural gas, refined products, and freight insurance markets within hours. Understanding why prices respond so violently requires looking beneath the headline numbers and into the layered pricing architecture that governs energy futures during active conflict.
When big ASX news breaks, our subscribers know first
Why the Strait of Hormuz Is Structurally Irreplaceable
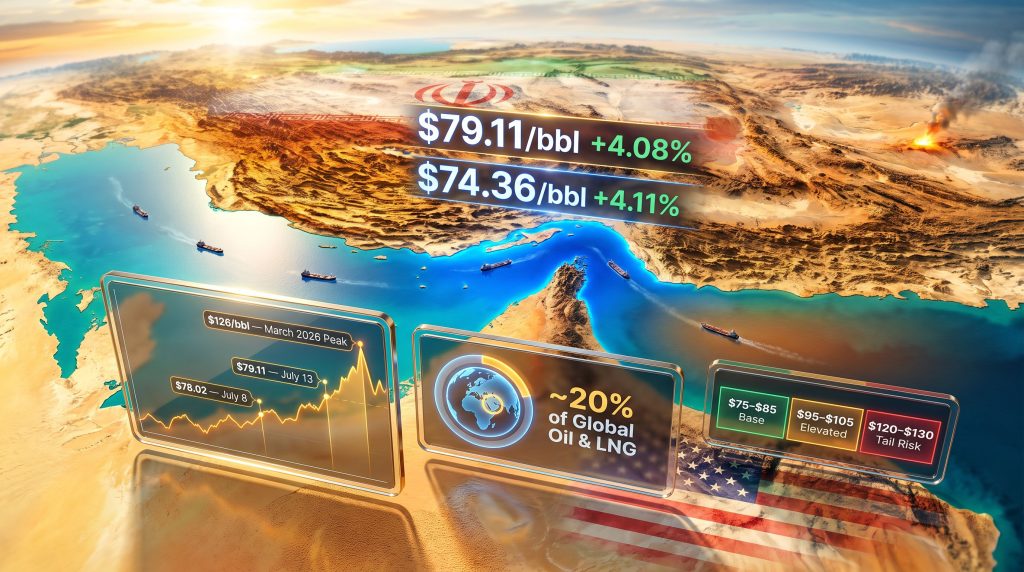
The strait is a 33-kilometre navigable channel at its narrowest point, separating the Persian Gulf from the Gulf of Oman and connecting the world's most prolific oil-producing basin to global export markets. Approximately 20% of the world's oil and liquefied natural gas moves through this single waterway every day. That figure is not a worst-case estimate — it is the structural baseline upon which the entire global energy supply chain is calibrated.
There is no credible short-term alternative. The East-West Pipeline crossing Saudi Arabia can carry roughly 5 million barrels per day (bpd), which represents only a fraction of normal Hormuz throughput. The Habshan-Fujairah pipeline bypasses the strait but operates well below its theoretical maximum capacity. In practical terms, a sustained closure would create an immediate supply vacuum that no combination of alternative infrastructure could fill within weeks or even months.
Why Physical Concentration Risk Changes Everything
What makes this waterway uniquely dangerous from a market stability perspective is its physical concentration risk. The navigable shipping lanes are narrow enough that land-based missile systems, drone swarms, and naval interdiction assets can effectively threaten traffic without requiring naval superiority. Insurance underwriters classify the strait as a tier-one war risk zone, meaning any confirmed escalation event triggers automatic premium escalation across all vessel categories transiting the region.
Furthermore, the geopolitical oil price drivers at play here are uniquely concentrated. A Strait of Hormuz disruption is categorically different from other geopolitical supply shocks because it affects crude oil, LNG, and refined product markets simultaneously. This multi-commodity shock characteristic means that standard single-market hedging strategies are insufficient during active conflict cycles.
The July 2026 Escalation: What the Data Actually Shows
The sequence of events between July 8 and July 13, 2026 illustrates precisely how oil prices Strait of Hormuz strikes interact across a compressed timeline.
| Date | Event | Market Impact |
|---|---|---|
| June 17, 2026 | US-Iran interim memorandum signed; strait partially reopened | Oil prices retreated toward pre-conflict levels |
| July 8, 2026 | Iranian forces struck three commercial vessels in the strait | Brent crude surged 5.2% to $78.02/bbl |
| July 8, 2026 | President Trump declared the ceasefire void | Renewed military posturing; uncertainty spiked sharply |
| July 11-12, 2026 | US CENTCOM executed precision strikes across dozens of Iranian sites | Oil climbed further; vessel traffic fell to multi-week lows |
| July 13, 2026 | Iran's Revolutionary Guards struck US military installations in Kuwait and Bahrain | Brent reached $79.11/bbl (+4.08%); WTI rose to $74.36/bbl (+4.11%) |
Brent crude futures for September delivery settled at $78.82 per barrel, the highest level recorded since June 22, 2026. Vessel tracking data published by Kpler recorded only six transits through the strait on Sunday, July 12, representing the lowest single-day count in five weeks. The normal operational baseline sits between 15 and 20 vessel transits daily, meaning traffic had collapsed to roughly 30–40% of typical throughput.
The Three-Layer Risk Premium Mechanism
The relationship between Strait of Hormuz strikes and oil prices is not a simple cause-and-effect. Market participants apply a structured multi-layer premium framework that activates sequentially depending on the severity and duration of any disruption event.
Layer 1: The Immediate Threat Premium
This layer activates within hours of any confirmed military action or vessel interdiction. It typically adds $3 to $8 per barrel to Brent crude within the first 24 to 48 hours. Critically, this premium is partially reversible: if credible diplomatic signalling emerges within 72 hours of an escalation event, traders will begin unwinding positions and the premium compresses. The July 8 spike of 5.2% exemplifies a strong immediate threat premium response.
Layer 2: The Supply Continuity Discount
This layer is driven by observable shipping data rather than geopolitical sentiment. When vessel transit counts, cargo declarations, and port congestion metrics show measurable disruption, futures markets apply a sustained discount to the probability of uninterrupted supply. The drop from 15–20 daily transits to just six on July 12 constitutes a significant continuity signal. ANZ Research flagged this dynamic directly, noting that the escalation over the preceding weekend placed any hopes of a rapid resolution in serious doubt.
Layer 3: The Structural Supply Deficit Premium
This layer becomes active when the cumulative shortfall in physical supply becomes quantifiable through official data. According to the International Energy Agency's July 2026 monthly report, global oil supply remained 9.4 million barrels per day below pre-war levels even after the June recovery had contributed 4.1 million bpd following the signing of the interim memorandum. This structural deficit underpins a baseline price elevation that persists independent of daily market sentiment swings.
The current July 2026 price range of $74–$79 per barrel sits approximately 9% above pre-conflict baseline levels from late February 2026, demonstrating that the structural deficit premium has not unwound despite diplomatic efforts. Examining the broader picture of crude oil trade and geopolitics helps explain why these premiums prove so persistent.
Benchmarking Against Historical Hormuz Crisis Events
Context matters when interpreting current price levels. At the peak of the 2026 conflict in March, Brent crude briefly reached $126 per barrel, the highest level ever recorded during a strait closure event. That extreme reflected shipment restrictions exceeding 90% of normal transit volumes, creating a supply shock comparable to the worst oil market dislocations in modern history.
The July 2026 price range of $74–$79 per barrel therefore represents a significant de-escalation from that March peak, but the market's current posture is not complacent. IG Markets analyst Tony Sycamore observed that the relatively contained price response to the July escalation suggested market participants were treating the situation as an intensification within a still-intact, if deeply fragile, truce framework rather than an outright collapse of the ceasefire architecture. That assessment carries its own risks: if the situation deteriorates beyond what the current pricing already anticipates, the repricing could be sudden and severe.
What Would Push Brent Back Toward $100 Per Barrel?
Analysts tracking the Hormuz situation have identified four primary trigger conditions capable of driving crude oil prices back toward triple digits:
- Sustained infrastructure damage to oil terminals, processing facilities, or subsea pipeline networks in the Gulf
- A return to near-complete strait closure, replicating the 90%-plus traffic restriction seen during the March 2026 peak
- Third-party escalation, including the involvement of additional regional actors that broadens the conflict geographically
- Insurance market withdrawal, where Protection and Indemnity clubs and war risk underwriters suspend or severely restrict coverage, effectively creating a commercial shipping blockade independent of any military action
The Diplomatic Fault Line: Why the June 17 Agreement Fractured
Understanding the current crisis requires examining why the interim memorandum signed on June 17, 2026 failed to hold. The agreement established two core commitments: immediate reopening of the Strait of Hormuz to commercial traffic, and a 60-day structured negotiation window aimed at formalising a broader end to hostilities.
The agreement initially delivered measurable results. Global oil supply rose by 4.1 million bpd in June as producers expanded output in anticipation of normalised transit conditions. However, the legal ambiguity embedded in the agreement's language created the fault line that eventually collapsed it.
Iran interpreted a vessel travelling what it classified as an unapproved route as a treaty violation justifying interdiction. The United States maintained that the strait is open to all commercial traffic under international maritime law, regardless of routing. These two positions were not merely diplomatically different — they were structurally incompatible, creating the conditions for exactly the kind of incident that occurred on July 8. This pattern is consistent with broader oil market trade war impact dynamics, where legal and political ambiguity amplifies price volatility.
The next major ASX story will hit our subscribers first
LNG: The Underappreciated Exposure
Crude oil captures most of the financial media's attention during Hormuz crises, but the LNG supply implications of any disruption carry consequences that are arguably more difficult to manage over the medium term.
Qatar, the world's largest LNG exporter, routes the majority of its output through the Strait of Hormuz. Unlike crude oil, where spot markets can reprice within hours and alternative suppliers can be accessed through relatively liquid trading mechanisms, LNG markets operate on longer contract cycles with more limited spot liquidity. This means:
- Price transmission lags of 2 to 4 weeks are typical for LNG compared to immediate crude repricing
- European and Asian importers without long-term supply contracts face asymmetric vulnerability to spot price spikes
- LNG cargo disruptions can persist in their market effects well beyond the resolution of the underlying military event
This lag dynamic also means that consumer-facing energy prices in Asia and Europe may not yet fully reflect the July 2026 escalation, with downstream inflation effects still working through the supply chain.
Scenario Modelling: Three Trajectories for Oil Prices
Based on current market signals, diplomatic conditions, and historical precedent, three distinct scenarios can be constructed for crude oil price trajectories over the next 30 to 90 days.
Scenario A: Controlled Escalation (Base Case)
Military exchanges remain limited in scope, with no permanent damage to energy infrastructure. Brent crude stabilises in the $75–$85 per barrel range. Shipping traffic recovers toward 10–15 daily transits within two to three weeks, and the June 17 negotiation framework is extended under informal terms.
Scenario B: Prolonged Disruption (Elevated Risk Case)
Repeated strikes prevent normalisation of shipping, and insurance markets begin restricting coverage. Brent crude tests $95–$105 per barrel within 30 to 60 days. IEA member states coordinate a Strategic Petroleum Reserve release to buffer supply, and global growth forecasts are revised downward by 0.3–0.6 percentage points across major economies.
Scenario C: Full Strait Closure (Tail Risk Case)
Comprehensive closure approaches the March 2026 peak conditions, with traffic restriction exceeding 90% of normal throughput. Brent crude re-approaches $120–$130 per barrel territory. Emergency G7 energy coordination is activated, and recession risk becomes elevated for energy-import-dependent economies across Asia and Europe.
These scenarios represent analytical frameworks based on observable market signals and historical precedents. They should not be interpreted as investment advice. Commodity markets carry inherent uncertainty, and active geopolitical conflicts can produce outcomes that fall outside any modelled range.
Market Positioning and Institutional Signals to Watch
Institutional traders and sophisticated energy market participants are not waiting passively for diplomatic outcomes. Several observable signals indicate how professional money is currently positioned:
- Elevated call option premiums on Brent crude above the $90 and $100 strike price levels signal accelerating institutional hedging activity
- Implied volatility in crude oil options markets has risen sharply, reflecting genuine uncertainty rather than purely speculative positioning
- War risk insurance premiums for vessels transiting the strait have risen substantially, adding meaningful incremental cost per voyage
- Some operators are already routing tankers around the Cape of Good Hope, adding approximately 10–14 days of transit time and significant additional fuel costs per voyage
The Cape of Good Hope rerouting dynamic is particularly important because it tightens the global tanker fleet's effective capacity utilisation even without any physical supply reduction. Fewer vessels are available for spot cargoes when the global fleet is spending additional weeks at sea per round trip.
Three Indicators Deserving Closest Attention
For anyone tracking how oil prices Strait of Hormuz strikes interact in real time, three data streams carry the highest signal value:
- Daily vessel transit counts via shiptracking platforms: recovery above 12–15 daily transits would constitute a meaningful de-escalation signal
- War risk insurance premium movements: a sustained decline in premiums would indicate underwriter confidence in route safety beginning to recover
- Diplomatic channel activity: any confirmed resumption of structured negotiations under the June 17 framework would be the most powerful leading indicator of medium-term price stabilisation
Furthermore, OPEC's market influence over production decisions in response to these signals will remain a critical secondary variable worth monitoring closely.
Key Statistics at a Glance
| Metric | Value | Context |
|---|---|---|
| Brent crude (July 13, 2026) | $79.11/bbl | +4.08% single-session gain |
| WTI crude (July 13, 2026) | $74.36/bbl | +4.11% single-session gain |
| Brent September futures | $78.82/bbl | Highest since June 22, 2026 |
| Brent peak (March 2026) | $126/bbl | During 90%+ traffic restriction |
| Daily strait transits (July 12) | 6 vessels | Lowest count in five weeks |
| Global supply recovery (June) | +4.1 million bpd | Following June 17 memorandum |
| Remaining supply deficit | 9.4 million bpd below pre-war | Per IEA July 2026 report |
| Share of global oil/LNG via Hormuz | ~20% | Structural chokepoint exposure |
| Current price vs. pre-conflict | ~9% higher | Versus late February 2026 baseline |
The Structural Vulnerability That Outlasts Any Single Crisis
The July 2026 escalation has done more than move oil prices by four percent in a single session. It has once again exposed the fundamental brittleness of a global energy system built around a single 33-kilometre navigable channel. Every diplomatic resolution, every interim memorandum, and every temporary de-escalation leaves this underlying structural vulnerability intact.
The medium-term policy response across major consuming nations will likely focus on three areas: accelerating alternative export infrastructure within the Gulf region, diversifying LNG sourcing contracts away from single-route dependency, and expanding strategic reserve capacity to extend the buffer window available during future disruptions. These are decade-scale investments, not near-term fixes.
For oil markets, the current crisis is a live stress test of a system that was never designed to withstand the complete closure of its most critical node. As reported by the BBC, the price signals emerging from that stress test deserve careful, layered interpretation rather than simple headline reading.
Want to Stay Ahead of the Next Major Resource Discovery?
Discovery Alert's proprietary Discovery IQ model scans ASX announcements in real time, instantly identifying significant mineral discoveries and translating complex data into clear, actionable insights — cutting through market noise the same way seasoned analysts cut through crude oil pricing layers. Explore how historic discoveries have generated substantial returns on Discovery Alert's dedicated discoveries page, and begin your 14-day free trial today to position yourself ahead of the broader market.