
June 29, 2026
The Hidden Architecture of a Crisis: How One Waterway Holds the World's Energy System Hostage
Energy markets are rarely moved by a single variable, yet one geographical feature consistently overrides every other pricing input in the global oil complex. The Strait of Hormuz, a narrow channel connecting the Persian Gulf to the open ocean, functions less like a shipping lane and more like a pressure valve for the world's energy infrastructure. When that valve is threatened, oil prices after US-Iran strikes in the Strait of Hormuz react dramatically, often before a single barrel is actually lost.
The 2026 US-Iran conflict has offered an accelerated masterclass in exactly how this mechanism operates, compressing years of geopolitical risk theory into months of lived market experience. Understanding the price movements that followed renewed strikes in late June 2026 requires more than reading a headline. It demands a structural examination of why this waterway commands such extraordinary pricing power, and what the current volatility is telling traders, policymakers, and energy buyers about the months ahead.
When big ASX news breaks, our subscribers know first
The Strait of Hormuz: Why This 33-Kilometre Chokepoint Controls Global Oil Prices
How Much of the World's Oil Supply Flows Through the Strait of Hormuz?
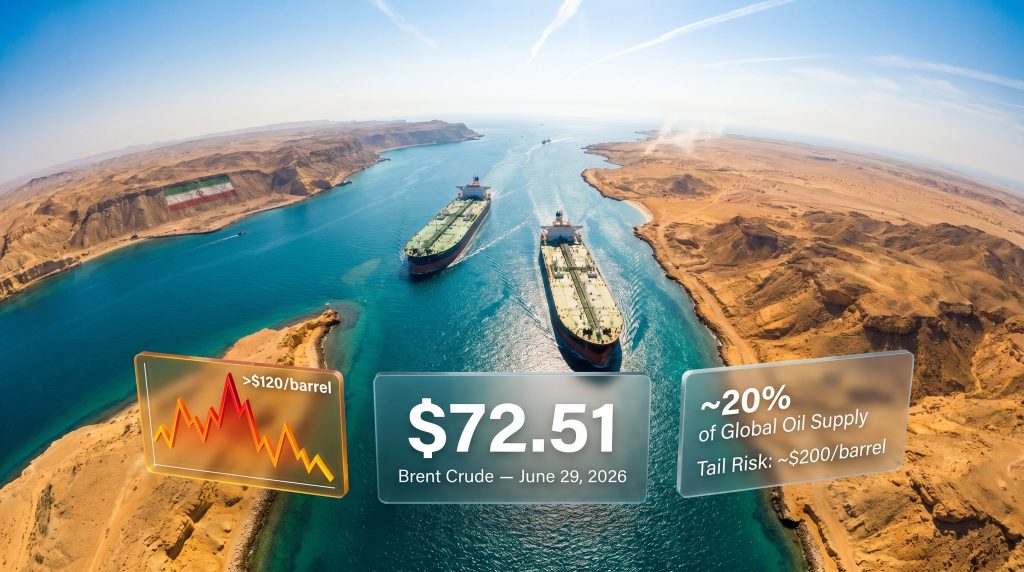
Roughly 20% of the world's daily oil supply transits the Strait of Hormuz, making it the single most consequential chokepoint in global energy infrastructure. The producers feeding this flow include Saudi Arabia, Iraq, Kuwait, the UAE, and Iran itself, none of whom possess adequate alternative export capacity to fully compensate for a closure.
The geography compounds the vulnerability. At its narrowest navigable point, the strait measures approximately 33 kilometres across, yet all tanker traffic, both inbound and outbound, is concentrated across just two shipping lanes each approximately 3 kilometres wide. This means that an extraordinary volume of global commerce is effectively funnelled through a channel no wider than a small city.
Saudi Arabia's East-West Petroline pipeline offers a partial bypass, but its throughput capacity falls well short of the volumes the strait handles on a normal operating day. When the strait is disrupted, the market does not simply reroute supply. It confronts a structural deficit that pipelines, emergency reserves, and alternative producers can only partially address. Furthermore, crude oil price trends in recent years have consistently demonstrated how quickly benchmarks respond to even the threat of Hormuz disruption.
When the Strait of Hormuz is disrupted, the global oil market does not simply reroute. It contracts. The resulting supply deficit is structural, not logistical, and pricing responds accordingly.
The Layered Logistics Problem That Makes Disruption So Costly
A lesser-understood dimension of Hormuz disruptions is that the damage compounds across multiple logistics layers simultaneously:
- Tanker backlogs accumulate rapidly and cannot be cleared quickly once shipping lanes reopen
- Damaged port and loading infrastructure requires capital-intensive restoration work before export volumes can normalise
- Production shut-ins across Gulf oil fields require systematic restart protocols that take weeks, not days
- War-risk insurance premiums escalate independently of physical access, adding a secondary cost layer to every cargo
- Shipping operators voluntarily withdraw from Gulf routes even during partial reopenings, compounding the physical vessel shortage
Each of these factors creates a lag between diplomatic resolution and physical supply recovery, a dynamic that the 2026 conflict has illustrated with unusual clarity.
What Happened: A Timeline of US-Iran Military Escalation in 2026
From Interim Peace Deal to Renewed Hostilities
The 2026 escalation cycle did not emerge from a vacuum. A US-Israeli military conflict with Iran began in February 2026, triggering an initial surge in oil prices. Iran's subsequent decision to close the Strait of Hormuz in March 2026 pushed Brent crude above $120 per barrel, a threshold that activated emergency response protocols across importing nations.
| Period | Event | Oil Price Impact |
|---|---|---|
| February 2026 | US-Israeli military conflict with Iran begins | Initial price surge |
| March 2026 | Iran closes the Strait of Hormuz | Prices breach $120/barrel |
| Late May 2026 | US strikes Iranian facility threatening shipping lanes | Brent rises ~2% to $96.28/bbl |
| Late May/Early June 2026 | US-Iran deal announced to reopen strait | Brent drops to ~$83.88/bbl |
| Late June 2026 | Renewed tit-for-tat strikes; Qatar-linked tanker attacked | Brent climbs to $72.51/bbl |
| June 29, 2026 | US and Iran agree to halt hostilities, renew Qatar talks | Price gains capped |
The pattern embedded in this timeline reveals something important: diplomatic announcements move prices nearly as dramatically as physical events. The single-day Brent drop of 3.95% following the initial US-Iran deal announcement, and the subsequent 4.62% WTI decline, confirm that geopolitical risk premiums compress extremely rapidly when credible de-escalation signals emerge. In addition, Brent and WTI futures markets have historically shown this same sensitivity to Hormuz-related diplomatic developments.
What Triggered the Late June 2026 Escalation?
The renewed hostilities that pushed oil prices after US-Iran strikes in the Strait of Hormuz back upward in late June originated from attacks on commercial vessels transiting the waterway from Thursday of that week. A Qatar-linked oil tanker was among the vessels targeted, a development carrying particular significance given Qatar's role as a major LNG exporter operating in the same shipping corridor.
US and Iranian forces exchanged direct strikes in response, characterised by multiple observers as the most serious breach of the interim peace deal since its signing. Iran and the United States subsequently agreed to halt recent hostilities and resume talks in Qatar, according to a report by Axios on Sunday, though Reuters was unable to immediately confirm the report independently.
How Did Oil Markets React to the US-Iran Strikes?
Brent Crude and WTI Price Movements: The Numbers Behind the Volatility
The market response on June 29, 2026, was measured relative to what the conflict had already delivered:
June 29, 2026 Market Snapshot:
- Brent Crude Futures: Rose 52 cents, or 0.67%, to $72.51 per barrel
- WTI Crude: Gained 71 cents, or 1.03%, to $69.94 per barrel
- Context: Brent had declined 10.6% the prior week, its third consecutive weekly fall, as strait shipments briefly recovered to their highest post-conflict volumes
Peak Volatility Reference Points (2026):
- March 2026 strait closure: Brent exceeded $120 per barrel
- Late May 2026 US strikes: Brent surged to $96.28 per barrel; WTI climbed to approximately $90.75 per barrel
- Post-deal announcement: Brent fell 3.95% to $83.88; WTI dropped 4.62% to $80.96
The compressed range between these peaks and the June 29 price of $72.51 reflects a market that had partially priced in supply recovery, only to be forced to reverse that assumption upon renewed escalation.
Why Did Oil Prices Fall 10.6% the Week Before the Latest Escalation?
The Brief Recovery Window and Why Markets Mispriced It
The sharp pre-escalation price decline had a logical foundation. Crude shipments through the Strait of Hormuz had risen to their highest volumes since the conflict began in February 2026. Persian Gulf producers had ramped up output and exports ahead of the interim peace deal, generating visible supply momentum. Most significantly, Saudi Aramco resumed crude oil loadings at its Ras Tanura terminal after a halt of nearly four months, a development that markets interpreted as confirmation of a durable supply recovery trajectory.
That interpretation proved premature. ANZ analysts noted in a research note that despite the diplomatic inflection point, physical oil flows remained constrained by tanker backlogs, damaged infrastructure, and production shut-ins. The bank's analysts further indicated that a return to pre-conflict supply levels may not occur until the end of 2026, even under improving conditions.
Why Physical Flow Recovery Always Lags Diplomatic Agreements
This gap between diplomatic resolution and physical supply normalisation is a structural feature of major oil infrastructure disruptions, not an anomaly:
- Tanker scheduling operates on weeks-long lead times; vessels cannot simply redirect overnight
- Loading terminal restarts require safety inspections, crew mobilisation, and equipment recommissioning
- Production shut-ins in oil fields follow restart protocols to prevent reservoir damage, limiting the pace of output recovery
- Insurance market repricing takes time, with war-risk premiums remaining elevated even after ceasefires are announced
- Cargo buyers require contractual certainty before committing to Gulf-origin crude, introducing additional commercial delays
What Is the Ras Tanura Terminal and Why Does It Matter to Global Oil Supply?
Saudi Aramco's Ras Tanura: The World's Largest Crude Export Hub
Ras Tanura occupies a unique position in global energy infrastructure as Saudi Aramco's primary crude oil loading terminal on the Arabian Gulf's eastern coast. Its throughput capacity makes it one of the largest such facilities anywhere in the world, and its operational status functions as a real-time indicator of Persian Gulf supply health.
The terminal's resumption of loadings after a near four-month halt in late June 2026 was correctly interpreted as a positive signal, but markets initially overcorrected in their optimism. The terminal's restart confirmed intent, not delivery. The logistical pipeline between terminal operation and global supply normalisation involves multiple intermediate steps that unfold over months, not days.
Loadings at Ras Tanura continued despite a helicopter crash on June 29, 2026, which killed 14 Saudi nationals. The cause of the crash was not immediately determined, according to the Saudi state news agency. The decision to maintain operations through that event signalled the operational priority assigned to restoring export capacity.
Ras Tanura's restart is best understood as a leading indicator with a significant lag, not an immediate supply catalyst. The terminal's ability to load vessels means little until those vessels can transit safely and buyers have priced the risk of doing so.
The next major ASX story will hit our subscribers first
What Are the Scenarios for Oil Prices Going Forward?
Three Strategic Scenarios for Crude Oil Pricing Through End-2026
Scenario 1: Sustained De-escalation and Full Strait Reopening
- Qatar talks produce a durable ceasefire framework accepted by both parties
- Tanker backlogs clear progressively through Q3 2026
- War-risk insurance premiums compress toward pre-conflict levels
- Brent crude retreats toward $70 to $75 per barrel as the supply fear premium dissipates
- Full pre-conflict supply volumes potentially restored by Q4 2026
Scenario 2: Continued Intermittent Hostilities (Base Case)
- Tit-for-tat exchanges continue at current frequency without triggering a full strait closure
- Physical flow disruptions persist, delaying supply recovery beyond year-end
- Brent crude trades in a volatile band between $72 and $96 per barrel
- Markets repeatedly revise supply recovery assumptions, sustaining price uncertainty
Scenario 3: Full Strait Closure or Iranian Mining
- Iran executes a full closure order or deploys naval mines in the shipping lanes
- Approximately 20% of global daily supply is immediately removed from the market
- Analyst estimates place prices in a potential range approaching $200 per barrel under this scenario
- Emergency Strategic Petroleum Reserve releases would be triggered across IEA member nations
- Demand destruction would accelerate, particularly in price-sensitive Asian import markets
Risk Disclosure: The $200 per barrel scenario represents a tail-risk outcome, not a base-case projection. It is included here because understanding the asymmetric downside of strait disruption is essential context for any energy market analysis. Current diplomatic trajectories, while unstable, do not point toward this outcome as the most probable path.
How Do Geopolitical Risk Premiums Work in Oil Markets?
Understanding the Fear Premium Embedded in Crude Prices
A geopolitical risk premium is the excess price that markets assign above the level justified by fundamental supply and demand. During active conflict near critical energy infrastructure, this premium can add $10 to $30 or more per barrel to benchmark prices depending on the severity of perceived disruption risk.
The mechanics operate through several interconnected channels:
- Options market hedging: Institutional buyers purchase call options to protect against price spikes, driving up implied volatility and, indirectly, spot prices
- Inventory building: Importers accelerate strategic stockpiling when supply is at risk, pulling forward demand and tightening near-term balances
- Speculative positioning: Commodity funds increase long exposure during conflict periods, adding momentum to price moves
- Physical cargo repricing: Spot market premiums for Gulf crude widen as buyers price in delivery uncertainty
| Variable | Effect on Geopolitical Risk Premium |
|---|---|
| Strait operational status (open/closed) | Highest single determinant |
| US-Iran diplomatic progress | Compresses premium rapidly |
| OPEC+ spare capacity availability | Partial offset to disruption fears |
| Tanker insurance rates in the Gulf | Leading indicator of physical risk |
| SPR release announcements | Short-term premium suppression |
| Qatar talks progression | Forward guidance for premium trajectory |
How Does the US-Iran Conflict Affect Global Energy Markets Beyond Crude Oil?
LNG Supply Chains and the Qatar Dimension
The involvement of a Qatar-linked tanker in the late June 2026 attacks introduces a dimension beyond crude oil markets. Qatar is one of the world's largest LNG exporters, and its shipping routes intersect with the same conflict zone. Consequently, the LNG supply implications for European and Asian importers are significant, particularly given their limited short-term flexibility in supply sourcing.
The LNG market operates differently from crude in one critical respect: it cannot be as easily rerouted. LNG tankers are specialised vessels, cargoes are typically pre-committed under long-term contracts, and regasification infrastructure at destination ports is designed for specific supply sources. Disruption therefore transmits more directly into end-user price increases than in crude markets, where spot cargo flexibility provides a partial buffer.
Refined Product and Secondary Market Exposure
Refined product markets carry independent vulnerability to Gulf disruptions. However, it is worth noting that these oil market disruptions extend well beyond the immediate region:
- Diesel and jet fuel prices respond to refinery feedstock availability disruptions, not just crude price changes
- Naphtha supply to Asian petrochemical complexes faces direct sourcing risk when Gulf crude exports are constrained
- Higher crude input costs combine with tightening refined product supply to produce a compounding inflation effect in fuel markets globally
Frequently Asked Questions: Oil Prices and the US-Iran Strait of Hormuz Conflict
What is the current oil price after US-Iran strikes in the Strait of Hormuz?
As of June 29, 2026, Brent crude was trading at $72.51 per barrel and WTI at $69.94 per barrel, reflecting modest gains following renewed US-Iran military exchanges. These figures sit well below the March 2026 peak above $120 per barrel but remain sensitive to further diplomatic or military developments.
Why did oil prices fall so sharply before the latest escalation?
Brent declined 10.6% in the week before the June 29 escalation, its third consecutive weekly drop, as strait shipping volumes recovered and Saudi Aramco resumed loadings at Ras Tanura. Markets had priced in an accelerating supply normalisation trajectory that the renewed strikes subsequently invalidated.
Could oil prices reach $200 per barrel?
A full Iranian strait closure or mining operation represents the scenario under which analyst estimates approach $200 per barrel. This is not a base-case projection. The current diplomatic framework, with US-Iran talks continuing in Qatar, points toward a more moderate trading range of $70 to $96 per barrel depending on how negotiations evolve. Furthermore, OPEC's global influence over spare capacity could provide a meaningful buffer against the most extreme price outcomes.
How long will it take for Gulf oil supply to fully recover?
ANZ analysts have indicated that even under improving conditions, a return to pre-conflict supply levels may not be achieved until the end of 2026, given the compounding effects of tanker backlogs, infrastructure damage, and production shut-in restart timelines.
Key Takeaways: What the US-Iran Strait of Hormuz Crisis Means for Oil Markets
Summary of Critical Data Points
| Metric | Value |
|---|---|
| Brent Crude (June 29, 2026) | $72.51/barrel |
| WTI (June 29, 2026) | $69.94/barrel |
| Brent Peak (March 2026 Closure) | >$120/barrel |
| Brent Peak (Late May 2026 US Strikes) | $96.28/barrel |
| Brent Post-Deal Low | ~$83.88/barrel |
| WTI Post-Deal Low | ~$80.96/barrel |
| Prior Week Brent Decline | -10.6% |
| Ras Tanura Halt Duration | ~4 months |
| Estimated Full Recovery Timeline | End of 2026 |
| Tail Risk Price Scenario | ~$200/barrel |
What Investors and Energy Buyers Should Monitor
The 2026 conflict cycle has established a clear set of leading indicators for tracking oil price trajectory:
- Tanker traffic data through the Strait of Hormuz provides the most direct real-time signal of physical supply flow
- War-risk insurance premium movements reveal how the shipping industry is pricing operational risk ahead of price markets
- Qatar talks progress determines whether the geopolitical risk premium compresses or expands in coming weeks
- Ras Tanura loading volumes indicate the pace of Saudi export recovery, the single most important national supply signal
- OPEC+ spare capacity utilisation shapes how much buffer exists against further disruption
The deeper lesson from oil prices after US-Iran strikes in the Strait of Hormuz is that physical supply recovery and diplomatic resolution operate on fundamentally different timescales. Markets that price the two as equivalent will be consistently wrong, both on the upside when deals are announced and on the downside when the logistical reality of recovery sets in. Indeed, analysts tracking hopes for a peace deal have repeatedly noted this disconnect between headline diplomacy and actual supply restoration.
This article contains forward-looking analysis and scenario projections based on information available as of June 29, 2026. Commodity price forecasts are inherently uncertain and should not be construed as investment advice. Readers should conduct independent research and consult qualified financial advisers before making investment decisions related to energy markets or commodities.
Want To Stay Ahead of Major Commodity Discoveries Driving Market Moves?
While geopolitical shocks like the US-Iran Strait of Hormuz crisis dominate energy headlines, the most transformative investment returns often emerge from significant mineral discoveries — and Discovery Alert's proprietary Discovery IQ model instantly identifies these opportunities on the ASX, delivering real-time alerts so subscribers can act before the broader market catches on. Explore historic discoveries and their remarkable returns to understand the potential, then begin your 14-day free trial at Discovery Alert and position yourself ahead of the next major find.