August 7, 2026
The Hidden Mechanics Behind Crude Oil Pricing in a Conflict Zone
Most investors assume oil prices rise when wars break out and fall when peace returns. The reality is considerably more nuanced. Energy markets operate on probability-weighted futures pricing, meaning the relationship between geopolitical events and crude benchmarks is mediated by trader expectations, not just physical supply conditions. Understanding this mechanism is essential for anyone attempting to interpret how oil prices and US-Iran war talks interact in real time.
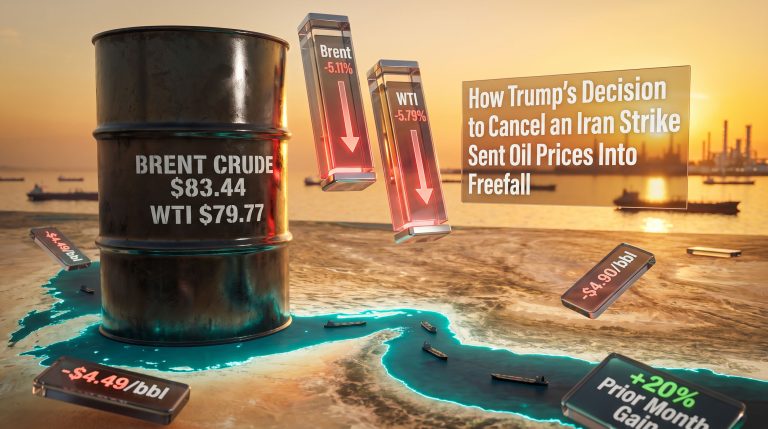
The events of early August 2026 provided a masterclass in this dynamic. A single statement from a political leader, unconfirmed by the opposing party, was sufficient to trigger a 7% single-session collapse in Brent crude followed by a partial recovery the next morning. No tankers changed course. No wells shut down. No pipelines were severed. Markets moved purely on the perceived probability of diplomatic progress.
When big ASX news breaks, our subscribers know first
Why Crude Futures Price Risk, Not Reality
Energy traders working futures markets are not responding to today's supply figures. They are constantly repricing the probability distribution of tomorrow's supply conditions. This forward-looking structure means that geopolitical risk premiums are built into crude prices well before any physical disruption occurs, and they unwind just as quickly when the perceived threat diminishes.
For a broader perspective on geopolitical oil price drivers, it helps to understand how conflict zones historically influence energy benchmarks. This is why the announcement of potential US-Iran negotiations, even unverified ones, caused such a dramatic selloff. The market had already priced in a meaningful probability of continued conflict-related Hormuz disruption. When that probability appeared to fall, the premium evaporated rapidly.
The three-layer structure of how crude markets process geopolitical information works as follows:
- Signal detection – A political statement, maritime incident report, or diplomatic communique enters the market
- Probability reassessment – Algorithmic and discretionary traders update their estimates of supply disruption likelihood
- Futures repricing – Positions are adjusted across Brent, WTI, and regional benchmarks within minutes
This sequence happens regardless of whether the underlying geopolitical signal is accurate or verified.
The Strait of Hormuz as a Sovereign Leverage Instrument
Before examining specific price movements, it is worth understanding what makes the Strait of Hormuz categorically different from other potential supply disruption points. Unlike an oil field that can be taken offline by sabotage or a pipeline that can be bombed, the strait is a legal and geographic entity that no party can simply destroy or replace.
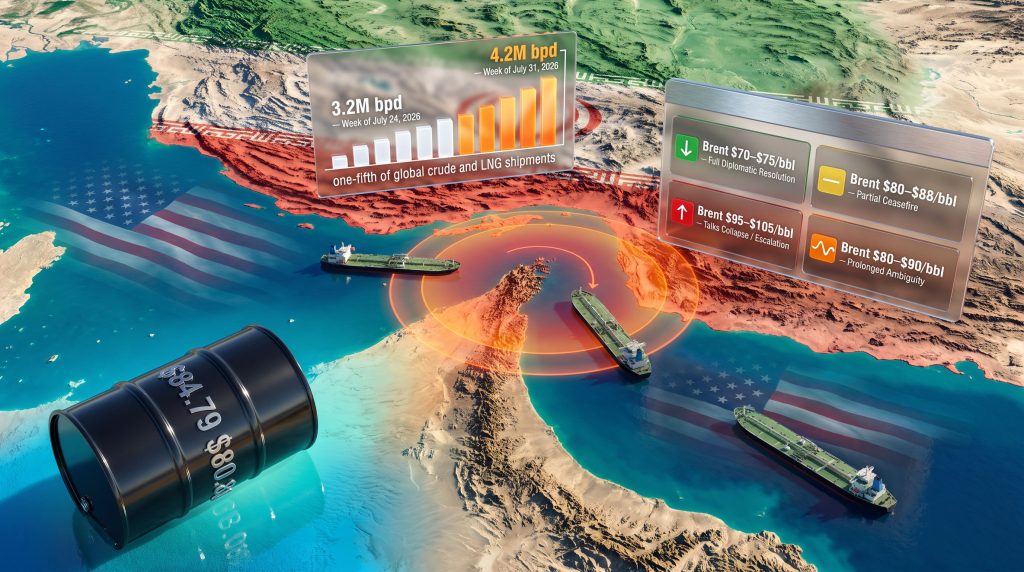
Prior to the conflict disrupting normal shipping patterns, the strait served as the transit corridor for approximately one-fifth of all global crude oil and natural gas shipments, making it the single most consequential maritime chokepoint in the global energy system.
The waterway connects Gulf producers including Saudi Arabia, Iraq, Kuwait, and the UAE to Asian, European, and global markets. Its unique strategic value lies in the fact that Iran physically borders the strait, giving Tehran what amounts to a geographic veto over Gulf oil exports during any period of military conflict. This has historically made Hormuz less of an oil infrastructure issue and more of a sovereignty negotiation instrument.
The current conflict has introduced a secondary complication that is less widely understood. The Bab el-Mandeb Strait in the Red Sea has been simultaneously affected by Houthi-related shipping interference, creating what market analysts describe as a dual-chokepoint risk dynamic. When both maritime corridors face disruption, Gulf producers lose access to all viable short-distance export routes, forcing costly rerouting around southern Africa.
The operational consequences of this dual-chokepoint scenario include:
- Extended voyage times of approximately 10 to 14 additional days when rerouting around the Cape of Good Hope
- War-risk insurance premium escalation for vessels transiting conflict-adjacent zones
- Reduced effective global tanker fleet capacity due to longer voyage cycles
- Refinery scheduling disruptions as delayed crude arrivals force spot market purchases at premium prices
Benchmark Movements and What the Numbers Revealed
The August 4, 2026 trading session illustrated how compressed and asymmetric the market response to ambiguous diplomatic signals can be. The prior session had seen dramatic declines across both major benchmarks before a partial recovery emerged.
| Benchmark | Prior Session Decline | Recovery Move | Recovered Price |
|---|---|---|---|
| Brent Crude (front-month) | -7.0% (3-week low) | +$1.02 (+1.2%) | $84.79/bbl |
| WTI Crude | -5.0%+ (near-week low) | +$0.46 (+0.6%) | $80.80/bbl |
Analysts at ING noted that the scale of the prior session's decline appeared excessive relative to the actual change in underlying geopolitical conditions. Their assessment was that considerable uncertainty remained and that markets had been through similar cycles before, only to see apparent diplomatic progress unravel entirely. For further context, Brent and WTI futures have historically demonstrated this kind of sharp repricing during geopolitical uncertainty phases.
The recovery was only partial for a structurally important reason. Iran's Foreign Ministry spokesman Esmail Baghaei issued a direct rejection of claims that negotiations were taking place, stating that no meetings with the US were scheduled. This contradiction prevented a full risk premium unwind and explains why Brent recovered only 1.2% of its 7% loss rather than staging a fuller reversal.
Three structural factors amplified the initial selloff beyond what fundamentals justified:
- Algorithmic amplification – Momentum-driven trading systems accelerated the decline once key technical levels were breached, feeding on themselves irrespective of fundamental context
- Thin liquidity conditions – Weekend-adjacent sessions create shallower market depth, magnifying the price impact of any given volume of sell orders
- Premature risk premium unwinding – Markets moved ahead of confirmed diplomatic progress, creating a mean-reversion setup that the partial recovery represented
The Hormuz Interpretive Deadlock and Its Market Implications
One of the least understood dimensions of the current standoff is that the core legal dispute is not simply about whether Iran will open the strait. It is about what both parties agreed to in the June memorandum of understanding, and whether that document created a binding obligation or merely preserved the status quo.
Washington's position holds that the MOU required Iran to reopen the strait to international commercial shipping as a precondition for conflict de-escalation. Tehran's position holds that the same document explicitly preserved Iran's sovereign authority over the waterway, with no obligation to guarantee third-party transit rights.
This interpretive deadlock is particularly significant for oil markets because:
- It means no single diplomatic statement can resolve the uncertainty without a separately negotiated and mutually acknowledged legal clarification
- Markets cannot reliably price a resolution timeline when the foundational disagreement is about what was already agreed
- Any claimed progress toward a deal is immediately subject to competing interpretation by both parties, reinforcing volatility
Shipping data from Barclays research offered a more concrete picture of what was actually flowing through the strait during this period.
| Week Ending | Net Crude + Product Exports via Hormuz |
|---|---|
| July 24, 2026 | 3.2 million barrels per day |
| July 31, 2026 | 4.2 million barrels per day |
The week-on-week increase of 1.0 million barrels per day suggested partial restoration of transit flows, though levels remained well below pre-conflict norms. Simultaneously, six Saudi-flagged supertankers rerouted through the Gulf of Aden toward southern Africa, and two tankers carrying Saudi crude successfully transited the Bab el-Mandeb Strait, confirming the Red Sea corridor remained partially operational as an alternative.
Active Maritime Threats Prevent Full Premium Unwinding
Even during periods when diplomatic signals appear more constructive, the physical danger within the Hormuz transit zone continues to sustain elevated risk premiums. On August 4, 2026, the UK Maritime Trade Operations agency issued an alert regarding an incident 20 nautical miles northeast of Oman's Al Khasab, after a cargo vessel reported being struck by an unknown projectile while transiting the zone.
This type of incident carries market significance beyond the immediate vessel affected. It reinforces the perception that the strait remains operationally dangerous regardless of whatever diplomatic signals are being exchanged at a governmental level. Insurance underwriters respond to incident data, not political statements, meaning that war-risk premiums remain elevated even when talks appear to progress. Al Jazeera's reporting on US strikes against Iran underscores how quickly maritime risk can re-escalate following apparent diplomatic windows.
Tim Waterer, Chief Market Analyst at KCM Trade, has noted that the fighting between Saudi Arabia and the Houthis, while not completely halting energy flows, has created a persistent cost burden through longer voyage times, higher insurance expenses, and periodic rerouting. The dual-chokepoint dynamic prevents oil prices and US-Iran war talks from delivering any clean resolution to embedded geopolitical premiums, even during apparent diplomatic windows.
The next major ASX story will hit our subscribers first
How Conflicting Official Statements Manufacture Volatility
The August 2026 episode offers a textbook case study in how information asymmetry generates oil market instability. When the parties to a conflict have strong incentives to manage public perception, markets face a structural inability to determine the true state of negotiations from public statements alone.
| Party | Public Statement | Market Interpretation |
|---|---|---|
| US President Trump | Pausing military action pending ongoing talks | Diplomatic progress → risk premium selloff |
| Iran Foreign Ministry (Baghaei) | No negotiations underway; no meetings scheduled | Contradiction → partial price recovery |
| Net Market Outcome | Brent -7%, then +1.2% recovery | Compressed range with elevated intraday volatility |
This pattern is characteristic of geopolitical uncertainty phases rather than supply-demand driven markets. The practical implication for traders and analysts is that statement-level monitoring becomes as important as inventory and production data during active conflict periods. Furthermore, a thorough trade and geopolitics analysis reveals how these dynamics have played out across multiple conflict cycles.
Scenario Framework: Four Price Pathways From Current Conditions
The range of possible outcomes for crude pricing over the coming months can be structured around four distinct scenarios, each with different probability weightings and price implications. The following scenarios are analytical frameworks for understanding market dynamics and do not constitute financial advice.
| Scenario | Near-Term Probability | Brent Price Range | Key Trigger |
|---|---|---|---|
| Full diplomatic resolution with Hormuz agreement | Low-to-moderate | $70-$75/bbl | Legal clarification of MOU text |
| Partial ceasefire without Hormuz resolution | Moderate | $80-$88/bbl | Back-channel progress |
| Talks collapse and renewed escalation | Moderate-to-high | $95-$105/bbl | Iran denial of any framework |
| Prolonged strategic ambiguity (current path) | High | $80-$90/bbl with volatility | Status quo continuation |
The scenario with the highest current probability is also the one least discussed in mainstream commentary: prolonged strategic ambiguity in which neither full escalation nor genuine resolution occurs. This creates a persistently elevated oil price environment with high intraday volatility and sustained insurance premiums, even as headline prices remain within a seemingly stable range. Reviewing the current crude market overview provides additional context for how these scenarios compare to broader market baselines.
Benchmarking the 2026 Conflict Against Historical Supply Shocks
Context from prior Middle East disruptions illuminates why the 2026 US-Iran conflict has produced a distinctive market pattern compared to historical precedents.
| Historical Event | Year | Peak Price Impact | Primary Mechanism |
|---|---|---|---|
| Arab Oil Embargo | 1973 | ~+400% over 12 months | Production restriction |
| Iranian Revolution | 1979 | ~+150% over 18 months | Production collapse |
| Gulf War (Iraq-Kuwait) | 1990-91 | ~+130% short-term spike | Supply shock and military risk |
| US-Iran War | 2026 | Elevated with high volatility | Chokepoint disruption and risk premium |
A critical distinction separates the 2026 conflict from its predecessors. The 1973 embargo and 1979 revolution both involved direct, structural reductions in production volumes. The 2026 conflict's primary market mechanism is chokepoint risk rather than production loss. Iran continues to produce oil. Gulf producers continue to extract and attempt to export. The disruption exists at the transit layer rather than the production layer.
This structural difference makes price movements more sensitive to diplomatic signals and more volatile in response to ambiguous information, because the physical supply disruption is conditional rather than structural. A single verified agreement on Hormuz transit rights could theoretically restore significant flow volumes rapidly, whereas reversing a production collapse requires months of infrastructure restoration. Consequently, understanding the impact on oil markets from prior geopolitical flashpoints helps contextualise just how unique the 2026 chokepoint dynamic truly is.
Key Variables Market Participants Should Monitor
Given the signal-driven nature of crude pricing in this environment, the following variables warrant systematic tracking:
- Official diplomatic communications from Washington and Tehran, particularly any convergence or contradiction in their characterisation of negotiation status
- Weekly Hormuz transit volume data from Barclays and similar institutional research, which provides the clearest available proxy for actual supply flow conditions
- UKMTO incident reports from the Hormuz transit zone, which indicate whether physical risk is escalating or stabilising independent of political statements
- Tanker rerouting patterns through the Gulf of Aden and around the Cape of Good Hope, which signal producer confidence in Hormuz safety
- War-risk insurance premium movements, which reflect underwriter assessments of operational danger rather than political messaging
NBC News has also reported extensively on how oil prices responded when Iran talks collapsed, providing an important real-world reference point for each of these monitoring variables.
The oil prices and US-Iran war talks dynamic has created a market environment where diplomatic signals move prices faster than physical supply data. Until a verifiable, mutually acknowledged agreement on Hormuz transit rights is reached, crude benchmarks will remain acutely sensitive to statement-level developments. Real-time geopolitical monitoring has become as analytically important as traditional supply-demand modelling for anyone engaged with energy markets.
This article presents factual reporting and analytical frameworks for informational purposes only. Nothing contained herein constitutes financial advice or a recommendation to buy or sell any financial instrument. Readers should conduct their own due diligence before making investment decisions. All price scenarios and probability assessments reflect analytical opinion and are subject to rapid change based on evolving geopolitical conditions.
Want to Stay Ahead of Major Resource Discoveries Driven by Shifting Energy Markets?
While geopolitical volatility reshapes energy markets in real time, Discovery Alert's proprietary Discovery IQ model scans ASX announcements daily to deliver instant alerts on significant mineral discoveries — transforming complex data across 30+ commodities into clear, actionable insights for traders and investors at every level. Explore historic discovery returns on Discovery Alert's discoveries page and begin your 14-day free trial today to secure a market-leading edge.