July 21, 2026
When Geography Becomes Destiny: The Strait That Moves Markets
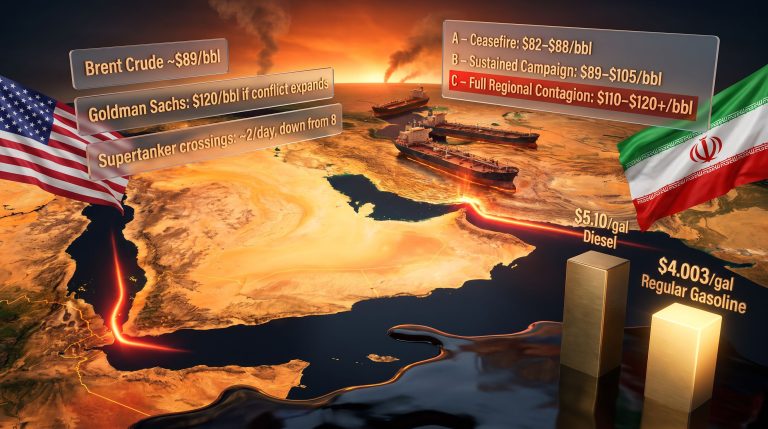
Few geographic features on Earth carry as much economic consequence as a 39-kilometre-wide passage between the Omani and Iranian coastlines. The Strait of Hormuz is not merely a shipping lane; it is the circulatory system of global energy trade. When that system is threatened, the financial consequences ripple outward with extraordinary speed, touching everything from jet fuel prices in Tokyo to inflation readings in New Delhi. The week of May 3 through May 7, 2026 delivered a masterclass in just how violently markets respond when that passage is genuinely at risk.
Understanding why oil prices whipsaw as U.S.-Iran conflict shakes markets requires more than reading price charts. It demands a grasp of physical geography, military strategy, diplomatic psychology, and the structural mechanics of global commodity trading all at once. Furthermore, the trade-war oil markets dimension adds yet another layer of complexity to an already volatile pricing environment.
When big ASX news breaks, our subscribers know first
The Strait of Hormuz: A Chokepoint With No Equal
Why 39 Kilometres Controls the World's Energy
The Strait of Hormuz sits at the mouth of the Persian Gulf, separating Iran to the north from Oman and the UAE to the south. At its narrowest navigable point, the usable shipping lanes are just a few kilometres wide, divided into two-kilometre inbound and outbound corridors separated by a two-kilometre buffer zone. This extraordinary physical constraint means there is genuinely no room for error, and no realistic alternative for the volume of energy that transits it daily.
| Metric | Estimated Volume |
|---|---|
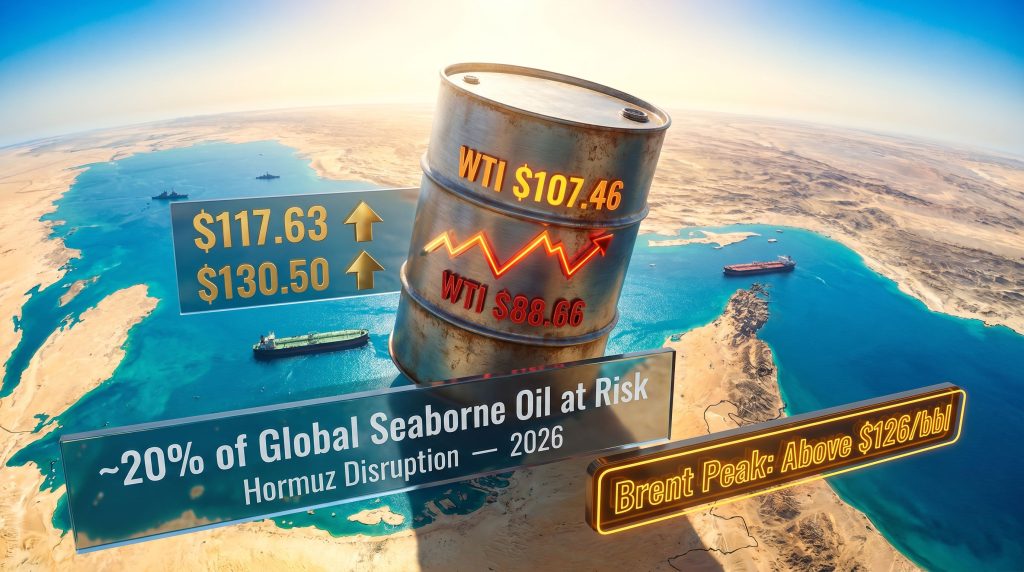
| Share of global seaborne crude oil | ~20% |
| Share of global LNG trade | ~20% |
| Daily barrels at risk during disruption | Upwards of 17–21 million bpd |
| Freight and insurance cost impact | Surged sharply during conflict period |
| Nations most dependent on transit | Japan, China, India, South Korea |
What makes Hormuz uniquely irreplaceable is the absence of sufficient bypass infrastructure. While the UAE operates the Abu Dhabi Crude Oil Pipeline, which can route roughly 1.5 million barrels per day around the strait via a land route to Fujairah on the Gulf of Oman, that capacity covers only a fraction of total Gulf export volumes. Saudi Arabia's East-West pipeline adds some relief, but aggregate bypass capacity falls dramatically short of the 17–21 million barrels per day that typically flow through the waterway.
ADNOC has announced plans to double its Hormuz-bypass export capacity through a new pipeline expected to be operational by 2027, but that infrastructure remains incomplete during the current crisis. Consequently, the considerations around oil trade and geopolitics have never been more directly relevant to day-to-day price formation.
The Hidden Cost: Force Majeure and Freight Market Seizure
Beyond headline crude prices, the Hormuz disruption created cascading damage through shipping markets. When tankers are denied safe transit or face missile threat zones, insurance underwriters invoke war-risk clauses, causing shipping premiums to spike dramatically. During the week of May 3, marine war-risk insurance for Persian Gulf transit reportedly surged to levels not seen since the 2019 tanker attacks, forcing some charterers to declare force majeure on delivery commitments.
This is a subtler but profoundly important market dynamic that financial oil traders often underweight: the physical unavailability of vessels is distinct from, and in some ways more damaging than, the price of the barrels themselves.
The Most Volatile Week in Recent Energy Market History
A Blow-by-Blow Account of the May 3–7 Price Swings
The trading week that unfolded between May 3 and May 7, 2026 produced price movements that broke records in both directions, illustrating precisely the kind of headline-driven volatility that has replaced fundamental analysis as the dominant short-term pricing mechanism. As reported by AP News, stock and oil markets were rattled simultaneously by the escalating conflict.
| Trading Session | WTI Price Level | Key Catalyst |
|---|---|---|
| Early-week high | $107.46/bbl | Hormuz closure fears, UAE missile strikes |
| Mid-week collapse | $88.66/bbl | Peace negotiation reports surface |
| End-of-week stabilisation | ~$97/bbl | Diplomatic uncertainty resurfaces |
| Brent intraday peak | Above $126/bbl | Regional supply shock premium |
Monday opened with aggressive buying after Iranian missile and drone strikes targeted the UAE near Fujairah, a critical oil export terminal situated outside the Strait on the Gulf of Oman. The strategic significance of targeting Fujairah specifically should not be underestimated: it is precisely the port used by the Abu Dhabi bypass pipeline, meaning the strike was designed to eliminate even the partial workaround that would otherwise soften the Hormuz closure's impact.
WTI surged above $106 per barrel as futures traders priced in a genuine multi-week supply disruption. U.S. naval forces simultaneously escalated operations aimed at restoring commercial shipping access through the strait.
The Mid-Week Collapse That Stunned the Market
Wednesday's session produced what technical analysts described as the largest single-session percentage decline in crude oil since the COVID-19 demand collapse of 2020. WTI fell nearly 15% intraday after media reports surfaced indicating that U.S. and Iranian negotiators had drafted a preliminary framework agreement. The proposed framework reportedly included provisions to reopen the Strait, pause active military operations, and ease sanctions on Iranian crude exports.
President Trump simultaneously announced a temporary suspension of elements of the U.S. naval protection mission, which traders read as confirmation that a deal was materially close. The futures market responded instantly: positions built on supply shortage fears were unwound at an extraordinary pace, and WTI briefly touched $88.66 per barrel.
The speed of the mid-week reversal illustrates a critical market psychology dynamic: in a geopolitically driven market, the risk of acting on unverified diplomatic headlines is severe. Traders who sold crude short into the rally were immediately punished by the Monday surge. Those who aggressively bought the peace rumour on Wednesday faced violent losses within hours as the diplomatic narrative reversed.
However, within the same trading session, Trump clarified that a final agreement remained distant and indicated that renewed military action remained a live option. Iran's negotiating position complicated matters further, with demands reportedly including financial reparations for war damages — a condition that Washington showed no appetite to accept. By the time the U.S. equity market closed Wednesday, crude prices had already recovered substantially from the intraday lows.
Physical Fundamentals: The Floor Beneath the Volatility
What U.S. Inventory Data Is Telling the Market
While geopolitical headlines dominated price action, the physical oil market told a quietly bullish structural story throughout the week. The American Petroleum Institute reported an 8.1 million barrel draw in U.S. crude inventories for the week ending May 1, a figure that significantly exceeded analyst expectations and reflected genuine tightening in domestic supply conditions.
| Inventory Metric | Reported Figure |
|---|---|
| API crude draw (week ending May 1) | 8.1 million barrels |
| EIA commercial crude stock change | Continued weekly decline |
| Gasoline and distillate inventories | Also declining |
| U.S. crude and petroleum exports | Approaching ~13 million bpd |
The inventory data revealed something important: the physical oil market was already tightening before the Hormuz crisis began, and the conflict has accelerated that process by forcing Asian and European buyers to redirect procurement toward U.S. barrels. American refiners responded by ramping up jet fuel production specifically, as European and Asian carriers sought to replace Middle Eastern supply that had become unreliable or prohibitively expensive to insure.
U.S. crude and petroleum product exports approached approximately 13 million barrels per day, near record levels, as global buyers scrambled to fill the Persian Gulf vacuum with North American supply.
What Energy Industry Leaders Are Saying
Chevron's chief executive Mike Wirth stated publicly that the concern had evolved beyond oil being expensive; the fundamental question had become whether fuel would be physically available in consistent quantities at all. That distinction matters enormously for understanding the current market regime. Wirth's framing reflects a shift from price risk to supply availability risk, which historically corresponds to more sustained price elevation and less mean-reversion behaviour.
ExxonMobil's chief executive Darren Woods reinforced that perspective by indicating that financial markets had not yet fully incorporated the scale of the supply disruption into prices, implying additional upside risk remained embedded in the market. Both assessments aligned with the physical inventory picture and supported the view that the current rally has structural underpinnings beyond pure speculation.
Technical Analysis: What the Chart Structure Reveals
Key Levels Every Trader Is Watching
The technical picture for WTI crude futures entering the week of May 12 is defined by a pivotal support and resistance structure that will likely determine whether the broader uptrend resumes or begins to exhibit distribution behaviour.
| Technical Level | Price | Significance |
|---|---|---|
| Short-term resistance | $110.93 | Uptrend resumption signal |
| Retracement support (upper) | $94.95 | Key pivot for bullish continuation |
| Retracement support (lower) | $91.18 | Bearish trigger if breached sustainably |
| 52-week moving average | $67.10–$67.11 | Long-term trend anchor |
| Nearest major structural bottom | $55.12 | Long-term structural floor |
| Near-term upside targets | $117.63 / $119.48 | Previous nearby futures highs |
| Extended upside targets | $123.00 / $130.50 | Russia-Ukraine war era peaks |
The critical technical insight from last week's price action is what did not happen. Despite the violent mid-week selloff that briefly pierced $88.66, buyers returned forcefully and drove prices back above the $91.18 to $94.95 support zone before the session closed. In technical analysis, a false breakdown followed by a strong recovery is frequently interpreted as a bullish signal, as it demonstrates the presence of substantial buyers willing to defend specific price levels aggressively.
Bullish and Bearish Scenarios Defined
Bullish case: A sustained weekly close above $94.95 signals buyer dominance and opens the path toward $110.93, above which the next targets are $117.63 and $119.48. If conflict escalates further, the Russia-Ukraine war era peaks of $123.00 and $130.50 become plausible.
Bearish case: A sustained break and weekly close below $91.18 would signal seller control and open the path toward the $83.02 to $76.44 retracement zone. The 52-week moving average at $67.10 acts as the ultimate trend-defining level; as long as prices remain above it, the broad market posture remains bullish.
Global Ripple Effects: Who Bears the Greatest Risk
Asia's Energy Import Dependency
The nations most exposed to Hormuz disruption are concentrated across Asia, where energy import dependency is structural rather than cyclical.
-
Japan operates with minimal domestic oil production and relies on Gulf imports for the majority of its crude supply. Japan's refinery utilisation rate moved to approximately 73% as strategic oil stockpiles were deployed during the crisis period.
-
India faces a compounded crisis. Fuel costs surged approximately 25% year-on-year, driving India's wholesale inflation to a 3.5-year high. India's prime minister ordered a 50% reduction in government motorcade sizes as a fuel conservation signal. New Delhi also moved to sign strategic oil reserve and LPG agreements with the UAE to diversify procurement.
-
China responded with characteristic caution, with tankers initially navigating Hormuz in what shipping analysts described as a coordinated arrangement with Iranian authorities. Chinese gasoline consumption could fall by as much as 5.5% in 2026 if elevated oil prices persist. In addition, the disruption to global LNG supply chains has compounded China's procurement challenges considerably.
-
South Korea and other Northeast Asian importers face similar exposure with limited bypass options.
Europe's Accelerating Pivot to U.S. LNG
Europe's energy procurement shift, which began in earnest after 2022's Russian supply disruption, has accelerated meaningfully as Middle Eastern LNG supply becomes operationally unreliable. Furthermore, European gas price pressures have intensified the urgency with which European buyers are seeking long-term alternatives to Gulf supply.
Commonwealth LNG approved a major $13 billion Louisiana export project that signals long-term U.S. LNG expansion is commercially viable at current price levels. Canada's British Columbia province simultaneously moved to advance LNG export ambitions, and the federal government cleared a path for a new west coast oil pipeline capable of approximately 1 million barrels per day of additional export capacity.
Russia's Unintended Windfall
An underappreciated consequence of the Hormuz closure is the competitive advantage it delivers to producers operating outside the Persian Gulf. Russia, already a major supplier to India and China through preferential pricing arrangements, has seen its oil revenue surge by approximately $6.3 billion as elevated global prices offset ongoing production constraints. The Hormuz crisis has effectively subsidised Russia's oil export revenues without any action on Moscow's part, a dynamic that complicates Western diplomatic calculations considerably.
The next major ASX story will hit our subscribers first
Five Scenarios the Market Is Pricing In
| Scenario | Primary Driver | WTI Price Implication |
|---|---|---|
| Ceasefire holds, Hormuz fully reopens | Diplomatic breakthrough | Sharp selloff toward $76–$83 support zone |
| Talks collapse, new strikes occur | Military escalation resumes | Retest of $107–$117 range |
| Prolonged stalemate, partial shipping | Status quo conflict | Consolidation near $94–$100 |
| OPEC emergency output increase | Coordinated supply response | Moderate price relief, limited duration |
| Conflict broadens beyond Iran-U.S. | Regional escalation | Potential move toward $123–$130 |
The scenario table above reflects a market that is not pricing in a clean resolution. OPEC's market influence remains a critical wildcard in this environment, as any coordinated emergency output response from Gulf producers could meaningfully alter the price trajectory. The preponderance of probability sits in the middle scenarios of prolonged uncertainty and partial disruption rather than the tail scenarios of either complete diplomatic resolution or dramatic regional escalation.
What Investors and Traders Must Watch Next
The Five Signals That Will Define Oil's Next Move
-
Diplomatic confirmation — Any verified and substantive framework agreement between Washington and Tehran, not merely media reports of preliminary talks, would be the single most powerful bearish catalyst available.
-
Hormuz shipping normalisation — A measurable return to commercial tanker transit volumes, verifiable through AIS tracking data, would confirm physical supply restoration and pressure prices lower.
-
Weekly U.S. inventory reports — API and EIA data releases will continue to reveal whether domestic tightening is accelerating or plateauing, providing the clearest window into physical market conditions.
-
OPEC+ supply response — Whether producers outside the Gulf, particularly those with spare capacity, move to fill the volume gap will materially affect price trajectory in the medium term.
-
Inflation data and central bank signals — With gas prices having risen by approximately $1 per gallon in some markets during peak escalation, inflation expectations data will determine whether central banks alter rate trajectories in response to energy-driven price pressures.
As Global News reports, the prospect of stalled U.S.-Iran talks remains a live concern that continues to keep markets on edge. Indeed, oil prices whipsaw as U.S.-Iran conflict shakes markets in precisely this fashion — swinging violently on every diplomatic signal, no matter how preliminary or unverified.
Until the 52-week moving average at $67.10 is broken on a sustained weekly closing basis, the structural posture of the crude oil market remains bullish. Attempting to identify a definitive top in a geopolitically driven bull market, particularly one without a clear distributive chart pattern, carries substantial risk of premature positioning.
The IEA revised its 2026 supply forecast to reflect a widening oil deficit as Iranian production losses compound the physical impact of Hormuz disruption. That revised deficit estimate, combined with near-record U.S. export volumes, structurally tight inventories, and a 52-week moving average that remains $30 below current prices, suggests the fundamental backdrop will remain supportive even if geopolitical risk premiums partially unwind. For traders and investors alike, the enduring lesson is clear: when oil prices whipsaw as U.S.-Iran conflict shakes markets, patience and disciplined risk management are far more valuable than speed.
This article is intended for informational and educational purposes only. Nothing contained herein constitutes investment advice, a solicitation to buy or sell any security, or a financial recommendation of any kind. Crude oil markets involve significant risk, and past price behaviour is not indicative of future results. Readers should conduct their own due diligence and consult a qualified financial professional before making any investment decisions.
Want to Stay Ahead of the Next Major Resource Discovery Triggered by Energy Market Volatility?
When geopolitical shocks send commodity markets into frenzy, the window for identifying transformative investment opportunities can open and close within hours — Discovery Alert's proprietary Discovery IQ model delivers real-time ASX mineral discovery alerts, ensuring subscribers are positioned ahead of the broader market. Explore historic discoveries and their extraordinary returns, then begin a 14-day free trial to secure your market-leading edge.