
July 24, 2026
The Mechanics of a Supply Shock: When Redundancy Fails
Global oil markets are engineered around redundancy. For decades, the assumption underpinning energy security strategy was that no single chokepoint could remain disrupted long enough to cause sustained price dislocation, because alternative corridors existed to absorb the flow. That assumption has been stress-tested before, during the 1973 Arab oil embargo, the 1990 Gulf War, and the 2019 drone strikes on Saudi Abqaiq facilities. Each time, the redundancy held, at least partially.
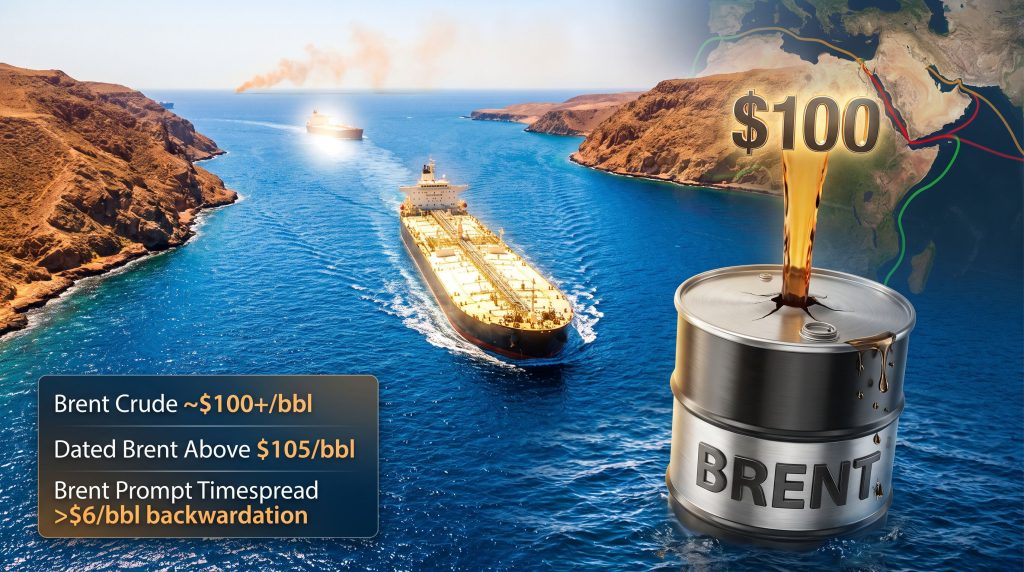
What makes the current environment structurally different is the simultaneous application of pressure across multiple independent transit corridors. When oil tops $100 after Red Sea attacks in July 2026, the milestone is not a reflection of one bad week in the Middle East. It is the visible output of a system whose backup mechanisms are failing at the same time as its primary ones.
Understanding why this matters requires moving beyond the headline price and examining the architecture of global oil logistics, the signal language of physical crude markets, and the compounding nature of geopolitical risk accumulation.
When big ASX news breaks, our subscribers know first
The $100 Threshold and What Market Structure Is Actually Saying
Why $100/bbl Is More Than a Round Number
Price thresholds carry weight in commodity markets that extends beyond their numerical value. The $100/bbl level for Brent crude functions as both a psychological barrier and a structural signal, triggering algorithmic trading responses, altering consumer and government behaviour, and shifting the calculus for energy-intensive industries around hedging and capex planning.
However, the spot price is only one layer of the signal. The more instructive indicator in July 2026 is the structure of the Brent futures curve itself.
Reading the Backwardation Signal
Brent's prompt timespread widened to more than $6/bbl in backwardation by late July 2026, meaning the price of crude available for immediate delivery significantly exceeded the price of barrels for future delivery. This is the opposite of contango, which tends to characterise markets with surplus supply and encourages storage.
What does oil market backwardation mean?
Backwardation occurs when crude oil for immediate delivery trades at a meaningful premium to forward-dated contracts. A prompt spread exceeding $6/bbl in Brent signals that physical buyers are urgently competing for available barrels today, reflecting genuine supply tightness rather than speculative momentum alone. Historically, deep backwardation of this magnitude has coincided with supply shock episodes rather than demand-driven rallies.
Alongside futures curve dynamics, the premium on Dated Brent — the benchmark used to price actual physical cargo transactions — rising above $105/bbl for the first time since late May confirmed that the tightness was not a paper market phenomenon. Physical buyers were paying up. That convergence of futures and physical signals is harder to dismiss than either metric in isolation.
| Benchmark | Price Level | Market Significance |
|---|---|---|
| Brent Crude Futures | ~$100+/bbl | First breach above $100 in two months |
| Dated Brent (Physical) | Above $105/bbl | Highest level since late May |
| Diesel Futures | Multi-month high | Refined product demand amplification |
| Brent Prompt Timespread | >$6/bbl backwardation | Strong immediate delivery premium |
| WTI Crude | ~$91-$93/bbl | Lagging Brent on logistics constraints |
The 35% monthly rally in Brent is particularly telling. Single-event oil price spikes of 5–10% are common and frequently reverse within weeks. A sustained 35% monthly gain reflects the accumulation of multiple risk vectors, each reinforcing the other, rather than a market overreacting to one incident. Furthermore, crude oil price trends heading into 2025 had already signalled underlying vulnerability before this escalation materialised.
How the Red Sea Became the World's Most Exposed Energy Corridor
The Geography of Global Oil Transit
To appreciate why Houthi militant activity in the Red Sea carries global consequences, it is worth tracing the physical geography of oil movement from the Persian Gulf to consuming nations.
The Strait of Hormuz, a narrow waterway between Oman and Iran, remains the single most critical oil chokepoint on Earth. Approximately 20% of global oil supply transits this corridor, according to the U.S. Energy Information Administration. During periods of Hormuz disruption, tanker operators have historically rerouted crude through an alternative path: northward through the Gulf of Aden, through the Bab el Mandeb Strait at the southern tip of the Red Sea, and then either through the Suez Canal toward European destinations or southward around the Cape of Good Hope toward Asia.
The critical vulnerability embedded in this structure is rarely articulated plainly: the Red Sea corridor is not truly an independent alternative to Hormuz. It is downstream of Hormuz. Saudi crude exports, in particular, can exit via both corridors, but when Hormuz faces active disruption, the Red Sea route absorbs diverted volume and becomes more congested and more strategically valuable simultaneously.
When Backup Routes Carry Primary Risk
This is the structural trap markets found themselves in during July 2026. Iran-backed Houthi militants, operating from Yemen, targeted two Saudi-linked oil tankers in the Red Sea in a single incident, according to reporting from Bloomberg. Brent crude gained approximately 8% on the day of those reports, reflecting the market's recognition that the fallback route had itself become a threat zone.
The Bab el Mandeb Strait, through which roughly 6 million barrels per day of oil and petroleum products flow under normal conditions according to EIA data, is narrow enough that even credible interdiction threats force operators to make costly rerouting decisions. Some tanker operators had already begun avoiding the strait prior to the July attacks, taking longer Cape of Good Hope routes. The escalation in July compressed the timeline for those decisions industry-wide.
Four Converging Supply Risk Vectors
Vector 1: Houthi Strikes and the Escalation Trajectory
The July 2026 tanker attacks were not an isolated event but rather a continuation of an escalating campaign. The significance of targeting Saudi-linked vessels specifically is that it converts a regional conflict into a direct threat to the world's largest crude exporter's ability to move product. Analysts from Rapidan Energy Group have characterised the second phase of the military conflict as substantially broader in scope than earlier engagements, with risks extending beyond shipping lanes to energy infrastructure more broadly.
Vector 2: The CPC Terminal and Kazakhstan's Export Vulnerability
Less prominently discussed but equally significant is the repeated disruption of the Caspian Pipeline Consortium (CPC) terminal on Russia's Black Sea coast. The CPC pipeline system is the primary export channel for Kazakhstani crude, handling the substantial majority of the country's seaborne oil exports, which average approximately 1.2–1.4 million barrels per day under normal operating conditions.
Kazakhstan is not a marginal producer. It is a meaningful contributor to global non-OPEC supply. When the CPC terminal faces disruption, that volume cannot easily be redirected. Kazakhstan is landlocked, and the CPC route represents the country's only high-volume export corridor to global markets. Infrastructure attacks on this facility compound global supply anxiety in ways that are disproportionate to Kazakhstan's OPEC+ quota share.
Vector 3: The Disappearance of Traditional Stabilisers
Two mechanisms that markets have historically relied upon to absorb supply shocks are operating at diminished capacity simultaneously:
- U.S. Strategic Petroleum Reserve (SPR): Inventories have declined substantially during the current conflict period, reducing the volume of emergency crude that Washington could release to cool prices. The SPR, which held roughly 638 million barrels at its pre-2022 peak, has seen significant drawdowns over recent years, limiting its effectiveness as a crisis buffer.
- Cushing Hub Inventories: Crude stocks at the Cushing, Oklahoma delivery hub, which serves as the physical delivery point for WTI futures contracts, have been operating near operational minimum levels. When Cushing inventories are this low, WTI's price behaviour becomes more volatile and less representative of global supply conditions, which partly explains the widening Brent-WTI spread observed during this period.
Vector 4: U.S.-Iran Tensions and the Political Risk Premium
Statements from Washington indicating the possibility of expanded military action against Iran have embedded a structural political risk premium into forward pricing curves. Analyst consensus across multiple energy research firms suggests that sustained escalation involving direct Iranian infrastructure could push Brent toward $120/bbl or beyond. This forward risk is now reflected in options market pricing, where the cost of upside call options has risen disproportionately relative to downside puts, indicating that professional traders are positioning for further upside rather than mean reversion.
In addition, the trade war impact on oil prices has added another layer of complexity to an already fragile demand outlook, making it harder for markets to predict where equilibrium pricing ultimately settles.
Shipping Route Economics: The Hidden Cost Multiplier
How Rerouting Translates Into Consumer Prices
When tanker operators avoid the Bab el Mandeb Strait, they face a binary choice: reroute via the Suez Canal (viable but operationally constrained) or take the full Cape of Good Hope bypass. Neither is cost-neutral.
| Route | Transit Time to Asia | Vessel Size Flexibility | Estimated Cost Premium | Security Risk |
|---|---|---|---|---|
| Red Sea / Bab el Mandeb (Direct) | Shortest | Unrestricted | Baseline | Elevated – active threat |
| Suez Canal Reroute | Moderate increase | Smaller vessels required | +15–25% estimated | Lower but complex |
| Cape of Good Hope (Full Bypass) | Significant increase | Larger vessels viable | +30–45% estimated | Minimal |
Senior energy market analysts have noted that while Saudi crude volumes can theoretically be redirected through alternative corridors, the practical constraints of vessel size limits in the Suez Canal, extended transit times, and port capacity bottlenecks mean that efficiency losses are structural rather than temporary. The market absorbs these costs through higher freight rates, which then transmit into refined product prices at the consumer level.
The Suez Canal's draft and beam restrictions mean that very large crude carriers (VLCCs), which dominate long-haul Saudi export volumes, cannot transit the canal fully laden. Operators must either transfer cargo to smaller vessels — a process known as ship-to-ship transfer that adds time and cost — or route via the Cape, adding approximately 10–14 days to Asian voyage times.
Scenario Analysis: Three Price Paths Over the Next 90 Days
| Scenario | Key Trigger | Brent Price Range | Assessment |
|---|---|---|---|
| Escalation Deepens | Expanded military action, further infrastructure strikes | $115–$130/bbl | Elevated probability if diplomatic channels remain closed |
| Status Quo Persists | Ongoing disruptions with partial rerouting adaptation | $95–$110/bbl | Base case under current conditions |
| De-escalation Emerges | Ceasefire signals or diplomatic intervention | $75–$90/bbl | Lower near-term probability |
A sustained $120/bbl environment would carry meaningful implications for global inflation. Energy costs feed directly into transportation, manufacturing, and food production costs. Central banks that have spent the post-2022 period attempting to anchor inflation expectations would face renewed pressure, potentially forcing a recalibration of interest rate trajectories at a time when several major economies are navigating fragile growth conditions.
Consequently, OPEC's influence on oil markets has become increasingly scrutinised, as member nations weigh the revenue benefits of elevated prices against the demand destruction risk that historically accompanies sustained triple-digit crude.
The next major ASX story will hit our subscribers first
Why This Shock Is Historically Unusual
Most oil supply shocks in the historical record involve disruption to a single production region or transit corridor. The 2019 Abqaiq-Khurais drone strikes temporarily removed approximately 5% of global oil supply but left transit corridors intact. The 2022 Russia-Ukraine conflict disrupted Russian pipeline flows into Europe but left Middle Eastern logistics functioning normally.
The current environment is historically unusual because it applies simultaneous pressure to multiple independent chokepoints: the Strait of Hormuz through the broader Iran conflict, the Red Sea and Bab el Mandeb through Houthi activity, and the CPC Black Sea terminal through attacks on Kazakhstan's export infrastructure. Traditional supply shock models that assume disruption to a single node underestimate the compounding effect of concurrent multi-corridor stress.
This compounding dynamic is what justifies treating the oil tops $100 after Red Sea attacks milestone as a structural signal rather than a cyclical blip. Each pressure point individually might produce a 5–10% price response. Their simultaneous activation, against a backdrop of depleted emergency buffers, creates a multiplicative rather than additive effect on market pricing.
Downstream Consequences Beyond the Crude Price
Refined Products and the Diesel Amplification Effect
Diesel futures reaching their highest level since early April reflects a dynamic that goes beyond crude input costs. Refinery throughput disruptions caused by feedstock uncertainty, combined with elevated freight costs for refined product shipments, create a second-order amplification of the crude price shock at the consumer level. Diesel prices feed directly into agricultural transport, commercial freight, and industrial manufacturing costs, making the refined product signal arguably more economically consequential than the crude headline.
LNG and the Cross-Commodity Exposure Risk
Liquefied natural gas shipping routes through the same Red Sea and Bab el Mandeb corridor used for crude tankers face analogous risks. LNG carriers are subject to the same rerouting economics and security threat assessments. The LNG supply implications of a sustained Red Sea closure would affect European gas supply reliability during the refilling season, adding cross-commodity risk to what is already a complex energy security picture.
Emerging Market Economies and the Import Bill Shock
Net oil-importing emerging market economies face a compounded vulnerability. Higher crude prices inflate their import bills in dollar terms at the same time that a risk-off global environment tends to strengthen the U.S. dollar and weaken their currencies, creating a double deterioration in energy affordability. Countries across South Asia and Southeast Asia that have limited domestic production and limited SPR capacity face the sharpest near-term exposure.
Frequently Asked Questions
Why did oil prices cross $100 per barrel after the Red Sea attacks?
The crossing of $100/bbl reflected the combination of direct supply disruption risk from tanker attacks and the broader recognition that both primary and backup oil transit corridors are now under simultaneous threat, at a time when emergency inventory buffers are near multi-year lows. Forbes reported that Iran-backed Houthi targeting of Red Sea shipping was a central driver of the move, reinforcing market fears of a wider regional conflict.
What is the Caspian Pipeline Consortium and why does it matter?
The CPC is the pipeline system that carries Kazakhstani crude from inland production fields to the Black Sea coast for export. Because Kazakhstan is landlocked and the CPC handles the large majority of its export volumes, attacks on the terminal have an outsized impact on non-OPEC supply availability globally.
Could the U.S. Strategic Petroleum Reserve stabilise prices?
The SPR remains a theoretical tool, however its practical capacity has been reduced by significant drawdowns over recent years. At current inventory levels, an SPR release would offer temporary relief rather than sustained price suppression, particularly against a backdrop of ongoing physical supply disruption.
What is the difference between Brent crude and WTI in this context?
Brent is the global benchmark derived from North Sea production and reflects the cost of crude in international waterborne markets. WTI is priced at Cushing, Oklahoma and reflects U.S. domestic supply-demand dynamics. The widening Brent-WTI spread during this period reflects the greater exposure of international logistics to Red Sea and Hormuz disruptions compared to the landlocked U.S. delivery system.
How long could elevated oil prices persist?
Duration depends primarily on the trajectory of the underlying geopolitical conflict. Historical analogues suggest that multi-corridor disruptions of this kind, absent rapid diplomatic resolution, sustain elevated pricing for quarters rather than weeks. The depletion of emergency buffers means markets cannot rely on inventory releases to bridge a prolonged supply gap. Furthermore, the US-China trade war oil prices dynamic adds a further dimension to the demand side of the equation, complicating any straightforward price recovery scenario.
This article contains forward-looking analysis, scenario projections, and market commentary based on publicly available information as of July 2026. The scenarios and price projections discussed represent analytical frameworks and do not constitute financial advice. Commodity markets are subject to rapid and unpredictable change. Readers should conduct their own due diligence before making investment or commercial decisions based on energy price outlooks.
For ongoing upstream industry analysis and pricing data related to this topic, World Oil at worldoil.com provides detailed geopolitical risk reporting and market intelligence relevant to global oil market dynamics.
Want to Stay Ahead of the Next Major Resource Discovery Triggered by Global Supply Shocks?
When commodity markets are under structural stress, identifying the right resource discoveries early can define investment outcomes — Discovery Alert's proprietary Discovery IQ model scans ASX announcements in real time, delivering instant alerts on significant mineral discoveries across more than 30 commodities, so subscribers can act before the broader market catches on. Explore historic discoveries and their returns, then start your 14-day free trial at Discovery Alert to position yourself ahead of the next major opportunity.