
July 28, 2026
The Hidden Architecture of Oil Price Risk: Why Geography Still Trumps Everything
Energy markets have a peculiar relationship with geography. Decades of technological disruption, financial innovation, and geopolitical diplomacy have failed to dislodge a single, stubborn reality: roughly one in every five barrels of petroleum consumed globally depends on safe passage through a narrow corridor of water. The Strait of Hormuz, at its narrowest point spanning just 21 nautical miles, remains the single most consequential chokepoint in the architecture of global energy supply.
Understanding why oil volatility amid Strait of Hormuz tensions produces such extreme price behaviour requires more than tracking daily market moves. It demands an appreciation of how physical geography, inventory dynamics, geopolitical oil price drivers, and macroeconomic momentum interact in ways that amplify each other under stress conditions.
When big ASX news breaks, our subscribers know first
Why One Waterway Holds the Global Economy Hostage
The sheer volume transiting this passage defies easy comprehension. Approximately 20% of global petroleum liquids, representing roughly 20 million barrels per day, moved through the strait in 2024, a throughput rate that remained consistent into early 2025. Saudi Arabia's contribution alone, estimated at around 5.5 million barrels per day or roughly 38% of total Hormuz crude exports, illustrates the concentration of supply dependency on a single maritime lane.
What makes this geography so decisive is not just volume but the absence of viable alternatives. Iraq, Kuwait, the UAE, Qatar, and Iran all funnel their primary crude exports through the same exit point. Furthermore, while limited pipeline infrastructure exists, most notably the Abu Dhabi Crude Oil Pipeline and Saudi Arabia's Petroline system, these routes collectively lack the throughput capacity to absorb even a partial Hormuz closure at scale.
The result is a structural vulnerability embedded in the global energy system that no amount of financial hedging can fully eliminate. According to UNCTAD's analysis of Hormuz disruptions, the implications for global trade and development are severe and far-reaching, reinforcing just how exposed the international economy remains to this single geographic constraint.
The Mispricing of Chokepoint Risk
For most of the past three decades, market participants have treated Hormuz disruption as a theoretical scenario rather than an operational one. Insurance models, shipping contracts, and futures pricing all calibrated to the probability of threat rather than the mechanics of active conflict. This distinction matters enormously. A threat environment generates a modest risk premium; an active conflict environment triggers a fundamental repricing of every supply assumption embedded in the forward curve.
"The events of May 2026 represent precisely this kind of structural repricing moment. Markets are not simply reacting to news, they are recalibrating the baseline probability distribution for Gulf supply security."
Oil Price Action: A Two-Day Anatomy of Extreme Volatility
The oil price movements observed across May 4 and May 5, 2026 offer a textbook illustration of how geopolitical risk trades in commodity markets. The sequence is instructive:
| Benchmark | Prior Session Move | May 5 Move | Price Level (May 5) |
|---|---|---|---|
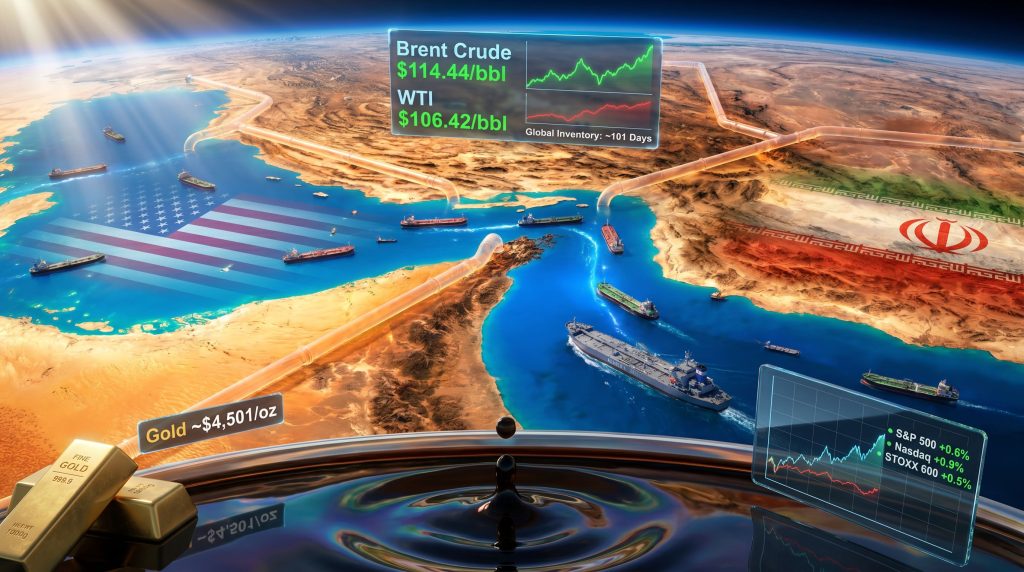
| Brent Crude (July) | +5.8% | -2.6% ($2.99) | $111.45/bbl |
| WTI Crude (June) | +4.4% | -3.5% ($3.70) | $102.72/bbl |
| WTI Settlement (June) | +4.4% prior | +$4.48 | $106.42/bbl |
| Brent Settlement (July) | +5.8% prior | +$6.27 | $114.44/bbl |
The intraday swings on May 5 were driven by a specific operational event. Maersk confirmed that the Alliance Fairfax, a US-flagged vehicle carrier, exited the Persian Gulf through the strait under active US military accompaniment. Markets initially interpreted this as a partial proof of concept for restored passage, triggering the early session pullback in Brent and WTI prices.
However, the relief was short-lived. Ongoing exchanges of fire between US and Iranian forces through the session prevented any sustained price collapse, and settlements recovered significantly from intraday lows. This price action illustrates a critical dynamic: markets are simultaneously discounting both de-escalation signals and escalation risks within the same trading session.
The Distinction That Determines Everything
Tim Waterer, Chief Market Analyst at KCM Trade, offered perspective that captures the market's interpretive framework precisely. His assessment, as reported on May 5, 2026, characterised the Alliance Fairfax transit as demonstrating that limited safe passage is achievable under current conditions, while simultaneously emphasising that a single escorted vessel represents an isolated operational event rather than a systematic restoration of commercial shipping access.
This distinction between isolated military-assisted transit and commercially viable free passage is not merely semantic. Shipping operators require predictable, insurable, unescorted access to justify resuming normal commercial operations. A corridor requiring individual US Navy accompaniment for each vessel is not, by any commercial definition, an open strait.
Supply-Side Dynamics: When Low Inventories Become a Multiplier
The severity of price reactions to Hormuz disruptions is not constant over time. It is heavily conditioned by the state of global oil inventories at the moment of the shock. When inventories are abundant, the market has a physical buffer that absorbs supply disruptions before they translate fully into price spikes. When inventories are thin, the same geopolitical event produces a much larger price response.
As of the onset of the May 2026 crisis, global oil stocks were estimated at approximately 101 days of demand coverage, with projections pointing toward a decline to around 98 days by the close of May 2026. If accurate, this would represent the tightest inventory buffer in approximately eight years, creating conditions where even a partial supply disruption carries outsized price implications.
The scenario matrix below illustrates the range of potential outcomes and their estimated market implications:
| Scenario | Current Status | Estimated Market Impact |
|---|---|---|
| Military-escorted selective transit | Active (confirmed) | Modest relief; uncertainty sustained |
| Partial commercial disruption | Elevated probability | WTI floor above $100/bbl |
| Full strait closure | Low but non-zero | Historical models suggest $150-$200+ range |
| Alternative routing at scale | Structurally insufficient | Unable to offset Hormuz volumes |
Disclaimer: Scenario price projections are based on historical precedent and analytical frameworks, not confirmed forecasts. Actual outcomes will depend on geopolitical developments that remain highly uncertain.
The Winners, Losers, and Unexpected Crosscurrents
Sustained crude prices above $100 per barrel redistribute economic value on a massive scale, creating both beneficiaries and casualties across the global economy. In addition, the trade war impact on oil compounds these pressures, further complicating the outlook for energy-dependent sectors worldwide.
Sectors Under Acute Pressure
- Aviation: Jet fuel, refined directly from crude, has surged in cost correlation with benchmark prices. Carriers operating thin-margin international routes face an existential squeeze. Cathay Pacific's reported implementation of flight reductions in response to fuel cost escalation reflects an industry-wide pattern where airlines are choosing capacity reduction over margin destruction.
- Consumer logistics and transport: Fuel-intensive supply chains across e-commerce, freight, and last-mile delivery are absorbing cost increases that will eventually transmit to consumer prices.
- Energy-importing nations: Countries reliant on oil imports with limited domestic production face compounding pressure from both fuel costs and currency weakness against dollar-denominated commodity pricing.
- Airline equities: Stocks in the aviation sector are exhibiting binary price behaviour, surging on any credible de-escalation signal and reversing sharply when conflict escalation news emerges, reflecting a sector whose earnings model is acutely sensitive to one input variable.
The Equity Market Paradox
Perhaps the most counterintuitive aspect of this crisis period is the resilience of equity markets despite the severity of oil volatility amid Strait of Hormuz tensions. On May 5, 2026, as crude prices swung violently, major indices recorded modest but positive sessions:
- Dow Jones Industrial Average: +0.2%
- S&P 500: +0.6%
- Nasdaq Composite: +0.9%
- European STOXX 600: +0.5%
This divergence is explained by the strength of underlying corporate earnings data. S&P Global Market Intelligence data confirmed that 83% of S&P 500 reporting companies beat earnings per share estimates in Q1 2026, while 78.2% exceeded revenue expectations. LSEG data simultaneously showed Q1 2026 earnings growth for the S&P 500 revised upward to a projected 18%, a striking acceleration from the 12.8% estimate that prevailed just one month earlier.
Jeff Buchbinder, Chief Equity Strategist at LPL Financial, attributed much of this earnings strength to technology sector momentum, specifically the sustained buildout of AI infrastructure driving capital expenditure across hyperscalers and enterprise software companies. This creates a genuinely unusual market configuration: energy-sector volatility and equity-market optimism coexisting, driven by the fact that oil prices and technology earnings are currently pulling in opposite directions on investor sentiment.
The Inflation Transmission Problem Central Banks Cannot Solve
There is a structural challenge embedded in sustained $100+ crude prices that goes beyond market volatility: inflation transmission. Historically, crude oil price increases of this magnitude pass through to consumer price indices within approximately six to twelve weeks through fuel, transport, manufacturing inputs, and food production costs.
This creates a particularly difficult environment for central banks. Interest rate policy is an effective tool for managing demand-driven inflation. However, it is a blunt and largely ineffective instrument for managing conflict-driven supply-side inflation, which originates in physical supply constraints rather than excessive monetary demand. Raising rates in response to Hormuz-driven energy inflation risks suppressing economic activity without addressing the underlying supply problem.
The gold market's behaviour during this period adds a further nuance. A temporary decline in gold prices, reportedly reaching approximately a five-week low around the $4,501 per ounce level, reflects a rotation in safe-haven flows toward oil-market hedges. Consequently, investors seeking direct exposure to the geopolitical risk premium moved toward energy commodities and related equities, temporarily reducing demand for traditional safe-haven assets. Strategies around commodity volatility hedging have therefore become increasingly relevant for portfolio managers navigating this environment.
The next major ASX story will hit our subscribers first
Four Pathways Forward: Resolution, Stabilisation, or Escalation
The range of outcomes from this point is genuinely wide. Each pathway carries distinct implications for oil prices, inflation, and global economic momentum.
Pathway 1: Negotiated De-escalation
A credible diplomatic framework between the US and Iran would rapidly compress the geopolitical risk premium embedded in current prices. Historical precedent from previous Gulf crises suggests Brent crude could retreat $15 to $25 per barrel within days of a verified de-escalation signal.
Pathway 2: Sustained Military Convoy Operations
If US military operations, referenced in reporting as Project Freedom, establish a reliable and repeatable convoy system for commercial vessels, markets may partially normalise even without formal conflict resolution. This scenario is consistent with oil prices settling in a $90 to $105 per barrel range as partial supply confidence is restored.
Pathway 3: Escalation and Infrastructure Strikes
Iranian retaliatory actions expanding to Gulf port infrastructure, or a breakdown in diplomatic engagement channels, could push Brent benchmarks toward the $120 to $140 range or beyond. This scenario would trigger coordinated strategic petroleum reserve releases from IEA member nations alongside OPEC's market influence being brought to bear through emergency production discussions.
Pathway 4: Prolonged Stalemate
The most probable near-term scenario based on current conditions: intermittent military escorts, sporadic conflict exchanges, and a sustained risk premium keeping oil above $100 per barrel for an extended period. This environment is most corrosive for inflation-sensitive economies, energy-importing developing nations, and corporate sectors with limited ability to pass fuel costs downstream.
Disclaimer: All scenario projections represent analytical frameworks based on historical precedent and current market conditions. They do not constitute investment advice. Geopolitical developments are inherently unpredictable, and actual price outcomes may differ materially from any scenario described.
What This Crisis Reveals About Energy Market Architecture
The May 2026 Hormuz crisis exposes a structural vulnerability that decades of market sophistication have obscured rather than resolved. Global energy supply security remains anchored to physical geography in ways that financial instruments cannot fully hedge. Furthermore, futures markets, insurance products, and strategic reserves all provide partial buffers, but none of them replace the actual physical flow of crude through 21 miles of contested water.
The market complacency premium that kept pre-crisis oil prices relatively contained despite persistent Gulf tensions has now been stripped away. As detailed analysis at caseforsea.org demonstrates, what is being priced today is a fundamentally revised probability distribution for Gulf supply security — one that treats active conflict as an operational scenario rather than a tail risk. Oil volatility amid Strait of Hormuz tensions has, in effect, permanently rewritten the assumptions underpinning global energy risk models.
For investors, policymakers, and corporate risk managers, the key takeaway is structural rather than tactical. The Hormuz chokepoint was always the linchpin of global energy architecture. The events of May 2026 have simply made that reality impossible to ignore.
For ongoing regional coverage and analysis of Middle East energy developments, Arab News at arabnews.com provides continuing reporting on the evolving Hormuz situation and broader Gulf geopolitical risk.
Want To Position Yourself Ahead Of The Next Major Commodity Shock?
Discovery Alert's proprietary Discovery IQ model delivers real-time alerts on significant ASX mineral discoveries, instantly cutting through market noise to surface actionable opportunities — explore Discovery Alert's discoveries page to understand how historic discoveries have generated substantial returns, and begin your 14-day free trial today to gain a market-leading edge in an increasingly volatile commodity environment.