August 25, 2026
The Hidden Mechanics Behind Oil's War Premium and Why It Fades Fast
Energy markets are psychological as much as they are physical. When conflict threatens a critical artery of global oil supply, traders do not wait for actual barrels to disappear before repricing risk. They front-run the disruption, inflating crude benchmarks with a fear premium that can persist for days or weeks, even when underlying supply fundamentals remain relatively intact. Understanding this dynamic is essential to interpreting what is now unfolding across global oil markets, as oil prices ease as Strait of Hormuz traffic recovers from the disruption caused by renewed U.S.-Iran hostilities.
When big ASX news breaks, our subscribers know first
The Strait of Hormuz: A 33-Kilometre Chokepoint That Moves the World
Understanding the Waterway's Outsized Role in Energy Markets
Geography has concentrated an extraordinary share of the world's energy trade into one of its narrowest maritime passages. The Strait of Hormuz, separating the Arabian Peninsula from Iran, measures roughly 33 kilometres at its narrowest navigable width. Despite its modest dimensions, it functions as the single most consequential oil transit corridor on the planet.
At peak operation, the strait facilitates the passage of approximately 17 to 21 million barrels of crude oil and petroleum products per day, representing close to 20% of total global oil consumption. The countries that depend on this corridor for export revenues include Saudi Arabia, the United Arab Emirates, Kuwait, Iraq, and Iran itself. Any sustained interruption to this flow does not simply inconvenience importers; it structurally tightens global supply in a way that few other single-point disruptions can match.
What Happens to Global Supply When the Strait Is Disrupted?
The strait's importance lies not just in volume but in the absence of viable alternatives at scale. While Saudi Arabia and the UAE have invested in overland pipeline capacity designed to bypass the strait, these alternatives can handle only a fraction of normal export volumes. Furthermore, when conflict or threat of closure materialises, the market's response is almost instantaneous: crude benchmarks spike, freight rates surge, and traders scramble to secure forward contracts as a hedge against supply tightening.
The result is a phenomenon that commodity analysts call the war premium, an above-equilibrium price layer baked into crude benchmarks that reflects perceived rather than confirmed supply loss. The geopolitical and logistical factors at play in such scenarios consistently demonstrate how swiftly markets can reprice risk.
How Geopolitical Conflict Builds and Erodes an Oil War Premium
What Is a War Premium in Crude Oil Markets?
A war premium is the additional price that crude oil commands above its fundamental supply-demand value during periods of elevated geopolitical risk. It is driven by uncertainty rather than confirmed shortages. Markets price in the probability of disruption, not just disruption itself. This distinction matters enormously for investors, because it means prices can fall sharply even when no actual supply restoration has fully occurred.
When geopolitical risk flares around critical shipping lanes, crude benchmarks typically absorb a risk premium above fundamental supply-demand equilibrium. As that risk recedes, even partially, markets can reprice sharply downward, often faster than the original spike formed.
How U.S.-Iran Tensions in 2026 Pushed Brent Above $93 a Barrel
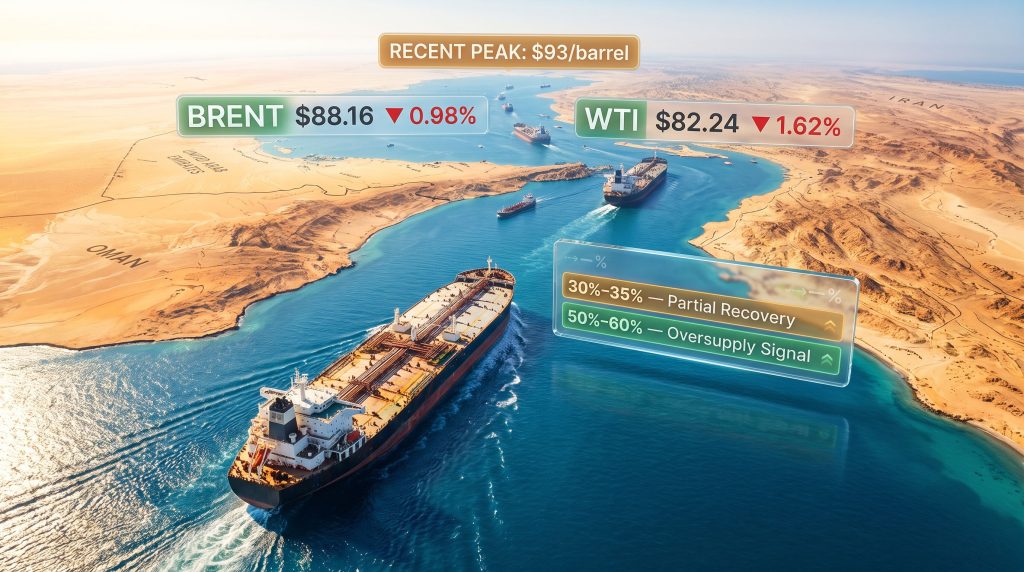
The most recent episode unfolded after a resumption of hostilities between the United States and Iran triggered an immediate reassessment of Hormuz transit risk. At the height of market anxiety, Brent crude briefly surpassed $93 per barrel, reflecting a war premium that condensed months of geopolitical tension into a single price point. Traders factored in everything from potential Iranian retaliatory closures to secondary disruption of tanker insurance and routing. The interplay of oil trade and geopolitics has rarely been more visible in real-time pricing dynamics than during this episode.
Why the War Premium Is Now Deflating
The deflation of this premium has begun not because peace has been declared, but because tanker flow data has started signalling partial normalisation. Commonwealth Bank of Australia, monitoring shipping lane activity, assessed that Hormuz traffic had recovered to approximately 30% to 35% of pre-war baseline levels. That figure is far from full restoration, but it was sufficient to shift market psychology from crisis mode toward cautious recalibration.
Brent crude fell 0.98% to $88.16 per barrel, while WTI futures for September delivery dropped 1.62% to $82.24, reflecting a meaningful but incomplete unwinding of the premium. The speed of this repricing illustrates a well-established market pattern: fear builds slowly, but relief trades fast. According to Marine Insight, oil prices dropped as much as 4% as Hormuz shipping recovered following the U.S.-Iran agreement, underscoring just how rapidly markets responded to early recovery signals.
Decoding the Traffic Recovery Data: What the Numbers Actually Mean
Tanker Flow Metrics and the Recovery Threshold That Matters Most
Measuring Hormuz traffic is not as straightforward as counting ships. Analysts track crude tanker loadings, vessel tracking data, port activity, and forward freight agreements to construct a picture of effective throughput measured in barrels per day. The 30%–35% recovery estimate represents a meaningful but fragile early-stage normalisation, not a return to operational stability.
Commonwealth Bank of Australia's analysis identified a more consequential threshold: if traffic rebounds to 50% to 60% of pre-conflict norms, the global oil market could tip back into oversupply conditions. This is a critical insight, because it means that a market currently interpreting recovery as positive news could ultimately face downward price pressure if that recovery continues at pace.
| Recovery Level | Traffic vs. Pre-War Baseline | Market Implication |
|---|---|---|
| 0%–15% | Near-complete disruption | Maximum war premium; sharp price spike |
| 30%–35% | Partial recovery (current estimate) | Easing supply fears; prices retreating |
| 50%–60% | Functional recovery threshold | Potential oversupply conditions re-emerge |
| 80%–100% | Full normalisation | Pre-conflict pricing dynamics restored |
Why Partial Recovery Should Not Be Confused With Full Normalisation
One of the most common misreads in commodity markets during geopolitical disruption is treating early recovery signals as confirmation of full resolution. At 30%–35% of baseline traffic, the strait remains significantly impaired. Insurance premiums for vessels transiting the corridor likely remain elevated, tanker operators may still be applying conflict-zone surcharges, and the geopolitical conditions that created the disruption have not fundamentally changed.
The more analytically rigorous interpretation is that markets are pricing in a reduction in tail risk, not a return to normalcy. That is a meaningful distinction for anyone making forward-looking energy market assessments.
Have Producers Permanently Rerouted Away From the Strait?
A longer-term question worth examining is whether sustained Hormuz disruption has accelerated structural changes in routing. Some producers with pipeline alternatives may have begun committing more volumes to overland routes, which could create lasting shifts in vessel traffic patterns even after full normalisation. This would complicate future traffic-based recovery assessments, as baseline comparisons could become less reliable indicators of actual supply flow.
The Iran Sanctions and Tariff Debate: Signalling Power vs. Economic Reality
What the Bipartisan Sanctions Bill Proposes
While tanker data drove Friday's price movement, investors were simultaneously processing the political dimensions of a bipartisan U.S. Senate sanctions bill targeting Iran and Russia. The legislation attracted considerable attention, both for the breadth of its economic coercion mechanisms and for the divisions it exposed within U.S. trade policy circles. Indeed, the broader tariff and trade war impact on global energy markets has become increasingly difficult to separate from geopolitical risk assessments.
The bill would impose economic sanctions on Russia, with particular focus on countries that purchase Russian energy exports and assist Moscow in circumventing existing restrictions. It would, furthermore, empower the executive branch to apply targeted tariffs on goods from the top five purchaser nations of Russian energy.
Why Tariffs on Iran Are Largely Symbolic in Dollar Terms
President Trump advocated for adding direct tariffs on Iran to the legislation, arguing it would strengthen the bill's coercive architecture. However, the economic mechanics of this proposal deserve scrutiny.
According to data from the Office of the U.S. Trade Representative, the United States imported just $1.4 million in goods from Iran during 2025. To contextualise that figure: it is negligible by any standard of international trade. The single largest category within those imports was works of art, collectors' pieces, and antiques, which accounted for 55% of total import value according to Trading Economics.
The scale of direct U.S.-Iran trade means tariffs function almost entirely as geopolitical signalling instruments rather than tools of meaningful economic leverage on the U.S. side of the ledger.
Secondary Tariff Mechanisms and Their Real-World Reach
Where tariff-based pressure could carry genuine economic weight is through secondary mechanisms targeting Iran's actual oil customers. Nations that continue purchasing Iranian crude, particularly in Asia, would face a far more consequential calculus if threatened with U.S. tariffs on their own exports. This extraterritorial pressure approach has been a consistent feature of U.S. sanctions architecture and represents the more substantive threat embedded in the legislative framework.
Congressional Dynamics and Policy Fracture
Broad bipartisan support exists for sanctions targeting Iran and Russia in the abstract. Where consensus fractures is on the specific mechanism of tariffs, which a segment of legislators view as economically counterproductive and diplomatically blunt. The intersection of sanctions policy and trade policy creates legislative friction that may delay or dilute the final form of any enacted bill.
Scenario Analysis: Three Price Paths From Here
Scenario 1 – Full Strait Normalisation (60%+ Traffic Recovery)
- Oversupply conditions re-emerge as withheld barrels re-enter the market
- Brent retreats toward the low-to-mid $80s range
- The entire war premium is erased and fundamental supply-demand pricing reasserts itself
- OPEC's market influence becomes a central factor as the cartel faces renewed pressure to cut output to defend price floors
Scenario 2 – Stalled Recovery (Traffic Plateaus at 30%–40%)
- Prices stabilise in the $85–$90 Brent range as residual risk premium persists
- Traders remain highly reactive to weekly tanker flow data and shipping intelligence
- Geopolitical uncertainty continues to suppress investment in long-duration energy assets
- The market enters a prolonged holding pattern awaiting clearer diplomatic signals
Scenario 3 – Renewed Escalation
- A reversal in tanker traffic triggers a fresh supply shock
- Brent re-tests or surpasses the $93 per barrel peak
- Energy equities and safe-haven commodity assets reprice sharply upward
- Freight derivatives and tanker stocks see renewed speculative interest
The next major ASX story will hit our subscribers first
What Investors and Market Watchers Should Monitor Now
The Three Data Points That Will Drive Oil Prices in Coming Weeks
- Weekly Hormuz tanker flow metrics – The most forward-looking indicator of whether the partial recovery is accelerating, stalling, or reversing.
- OPEC+ production decisions – A normalising strait reopens the oversupply debate, putting pressure on the cartel to respond with output adjustments.
- U.S. Congressional progress on the sanctions bill – Legislative momentum, or the lack of it, will shape the Iran risk premium embedded in forward crude curves.
Why Tanker Flow Data Has Become the Most Watched Leading Indicator
In prior geopolitical disruptions, analysts typically focused on inventory data from the U.S. Energy Information Administration or OPEC production reports as primary price drivers. The current episode has elevated real-time vessel tracking to a more prominent analytical role, because the supply disruption is happening in transit rather than at the production level. Barrels exist; the question is whether they can move. That makes shipping data, not production data, the most relevant leading indicator.
Understanding the Brent-WTI Spread in a Disrupted Market
The gap between Brent at $88.16 and WTI at $82.24 represents more than a routine benchmark differential. Brent and WTI futures absorb geopolitical risk premiums in distinct ways, with Brent more directly exposed to Middle Eastern supply dynamics and WTI reflecting North American supply fundamentals more heavily. A widening Brent-WTI spread during Hormuz disruptions is consequently a natural market outcome, and its compression as tensions ease can serve as an additional proxy for war premium deflation.
Frequently Asked Questions: Oil Prices and the Strait of Hormuz
What percentage of global oil passes through the Strait of Hormuz?
Approximately 20% of global petroleum liquids and close to 30% of seaborne-traded crude oil transits the Strait of Hormuz at normal operating capacity, making it the world's most critical oil chokepoint by volume.
Why did oil prices spike above $93 a barrel in mid-2026?
A resumption of direct military hostilities between the United States and Iran raised the probability of Hormuz closure or significant traffic disruption, prompting traders to price in a substantial war premium on top of pre-conflict supply-demand fundamentals.
What level of Hormuz traffic recovery is needed to push oil into oversupply?
According to Commonwealth Bank of Australia's analysis, a recovery to roughly 50%–60% of pre-war traffic levels could be sufficient to reassert oversupply conditions in the global oil market, even without a full return to baseline throughput. The IMF similarly notes that oil prices are set to ease rather than plummet as Hormuz flows resume, suggesting a measured rather than dramatic price correction.
How do U.S. sanctions on Iran affect global crude oil markets?
U.S. sanctions on Iran have historically constrained Iranian oil exports by limiting access to the global financial system, restricting shipping and insurance, and pressuring third-party buyers through secondary sanctions. The practical effect depends heavily on enforcement rigour and the behaviour of major Asian buyers.
Can oil markets fully normalise while geopolitical risk remains elevated?
Partially. Markets can price out war premiums if the probability of supply disruption falls sufficiently, even without full geopolitical resolution. However, a residual risk premium typically persists until there is structural clarity on the underlying conflict's trajectory. As oil prices ease as Strait of Hormuz traffic recovers, this dynamic is playing out in real time across global energy markets.
What is the difference between Brent crude and WTI, and why do both matter here?
Brent crude is the international benchmark priced on North Sea supply dynamics and globally traded volumes, making it more sensitive to Middle Eastern supply risk. WTI reflects U.S. domestic supply conditions and is priced at Cushing, Oklahoma. Both benchmarks fell on Hormuz recovery news, but Brent's sharper absolute exposure to the disruption means it carries and sheds war premiums more visibly than WTI.
Disclaimer: This article is intended for informational purposes only and does not constitute financial or investment advice. Oil price forecasts, scenario analyses, and market projections involve inherent uncertainty and should not be relied upon as the basis for investment decisions. Readers should conduct their own due diligence and consult qualified financial advisers before making any investment commitments.
Want to Stay Ahead of the Next Major Commodity Market Move?
Discovery Alert's proprietary Discovery IQ model delivers real-time alerts on significant ASX mineral discoveries, translating complex market data into actionable investment insights for traders and investors at every level of experience — explore historic discovery returns that demonstrate the potential of being first to market, and begin your 14-day free trial at Discovery Alert to secure your edge before the next major opportunity emerges.