
August 8, 2026
Why Entry Point Discipline Separates Serious Commodity Investors from the Rest
In cyclical commodity markets, the difference between strong long-term returns and frustrating underperformance often comes down to a single, underappreciated variable: when you buy. Not which company, not which commodity, not which jurisdiction. When. Institutional investors who have navigated multiple commodity cycles consistently point to entry point management as the silent multiplier behind outsized returns. It is not glamorous. It does not generate headlines. But it is what separates portfolios that compound from those that churn.
This principle sits at the centre of how Olive Resource Capital approached July 2026, a month defined by geopolitical volatility, commodity-equity divergence, and some of the most structurally attractive accumulation windows the junior resource market has offered this year. The Olive Resource Capital July investment update reveals a firm operating with a clear macro thesis and the tactical patience to act on it systematically.
When big ASX news breaks, our subscribers know first
Portfolio Performance: Reading the Numbers Correctly
Surface-level performance metrics can be misleading in high-volatility environments. A portfolio that declines 1% in a month where commodity equities broadly sold off, geopolitical headlines triggered daily risk-off moves, and summer liquidity drained from junior markets is not a portfolio that underperformed. It is a portfolio that held its ground.
July 2026 Valuation Snapshot
| Metric | Value |
|---|---|
| Portfolio Value at June 30, 2026 | $18.86 million |
| Portfolio Value at July 31, 2026 | $18.65 million |
| Month-over-Month Change | approx. -$210,000 (-1.1%) |
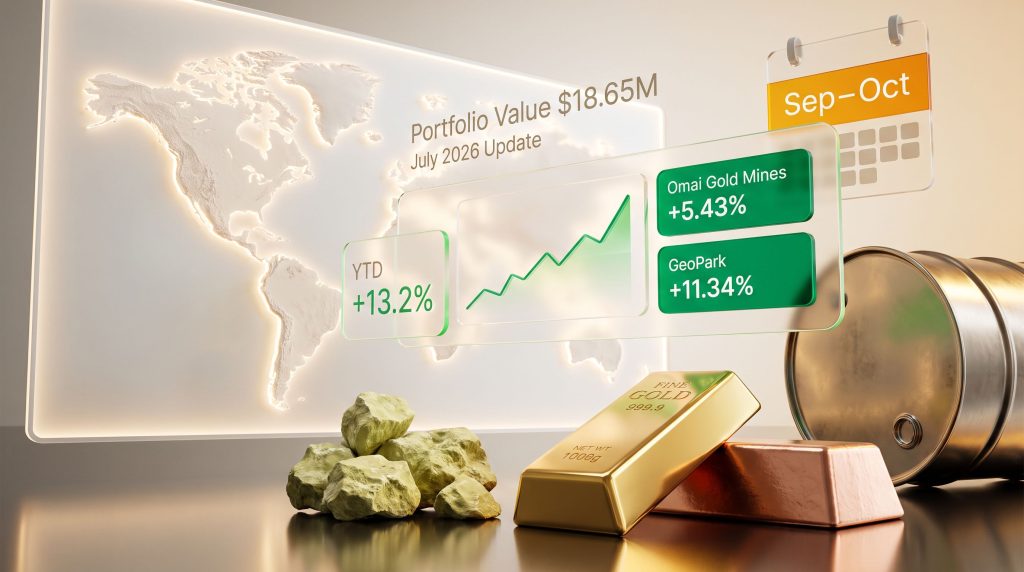
| YTD Growth from Dec. 31, 2025 | +13.2% (from $16.47 million) |
| Primary Growth Driver | Public equity price appreciation |
The year-to-date gain of 13.2% from the December 2025 baseline of $16.47 million tells a more instructive story than the monthly figure. That level of growth across a mixed macro environment reflects portfolio construction discipline rather than momentum chasing. The monthly decline, contextualised against a peer group where precious metals equities dropped while their underlying commodities rose, represents what management characterised as effectively flat performance.
Individual Holdings Performance in July 2026
| Holding | July Valuation | Monthly Change |
|---|---|---|
| Omai Gold Mines | $5.83 million | +5.43% |
| GeoPark | $547,131 | +11.34% |
| West Point Gold | $463,625 | -11.97% |
| Other Liquid Public Equities and Cash | $3.28 million | -18.60% |
| Other Public Equity Fundamental Investments | $2.62 million | -2.19% |
GeoPark recorded the strongest percentage gain at +11.34%, while Omai Gold Mines was the largest absolute contributor at +5.43%, reaching a valuation of $5.83 million. The drag from liquid equities and cash reflects broader sector weakness rather than position-specific deterioration. Understanding commodity prices and miners helps contextualise why this divergence occurs during periods of elevated macro uncertainty.
Commodity Markets in July 2026: A Fragmented Macro Picture
Oil and the Strait of Hormuz Volatility Cycle
Crude oil claimed the title of best-performing commodity in July 2026, driven by renewed tensions in the Strait of Hormuz maritime corridor. US refining margins expanded to approximately four times their historical averages, creating a highly favourable environment for downstream energy processors and refiners specifically.
What is particularly notable from a market microstructure perspective is that the volatility impact of successive Hormuz-related headlines appears to be shrinking. Each new escalation or ceasefire announcement is producing a narrower price response than the last. This pattern suggests markets have collectively concluded that the standoff, while persistent, is structurally unsustainable for all parties involved and is therefore unlikely to produce a catastrophic acute disruption.
The prevailing institutional interpretation is not that the risk has disappeared, but that it has been re-categorised from a tail risk to a structural feature. Markets have shifted from reactive positioning to a base-case assumption of prolonged, contained tension with gradual de-escalation over time.
Olive's energy positioning reflects a more pointed view: that the United States is pursuing a deliberate strategy to consolidate control over global oil and gas supply chains, including key maritime chokepoints. This geopolitical thesis shapes not just commodity selection but jurisdictional selection, with capital directed toward energy supply chains entirely outside the affected region. For broader context on how Olive Resource Capital outperforms mining indices during periods of geopolitical tension, their track record is instructive.
Copper: The Demand-Pull, Supply-Push Convergence
Copper climbed to year-to-date highs during July 2026, driven by a convergence of demand-side and supply-side forces. Chinese warehouse inventories were drawn down at a rate exceeding market consensus expectations, pointing to stronger-than-anticipated underlying demand. On the supply side, production disruptions at major Chilean mines and several other significant global operations have created a compounding deficit dynamic.
Key copper market drivers in July 2026:
- Chinese warehouse inventory drawdowns exceeding consensus forecasts
- Production disruptions at multiple large Chilean mining operations
- Additional supply challenges at major mines across other global jurisdictions
- Combined demand-pull and supply-push creating a constructive short-to-medium-term price environment
Precious Metals: Dollar Reversal as the Catalyst
Gold and silver turned positive in July after several consecutive months of weakness. The mechanism was a US dollar round-trip: the dollar briefly breached key resistance levels before retreating sharply by month-end. The Federal Open Market Committee meeting held in the final week of July produced no rate hike despite a 4% market-implied probability of tightening. The dovish outcome pressured the dollar lower, though a concurrent spike in long-end Treasury yields created a brief, offsetting headwind before the dollar ultimately failed to hold resistance.
The Commodity-Equity Divergence: An Underappreciated Risk
One of the most analytically significant observations from July 2026 is not a portfolio figure. It is a structural market dynamic that has direct implications for how investors should size commodity equity positions during periods of macro uncertainty. Furthermore, understanding this divergence is essential for anyone considering commodity investing diversification across multiple asset classes.
Physical commodity prices rose across most categories in July. Commodity-linked equities broadly did not. In precious metals specifically, equities declined on a net basis even as gold prices moved higher. This is not a new phenomenon, but the magnitude of the gap in July was notable.
In periods of elevated geopolitical uncertainty, institutional capital tends to rotate toward direct commodity exposure through ETFs, futures, and physical holdings rather than equity proxies. This compresses the valuation multiples applied to both producers and developers simultaneously, creating a temporary but real disconnection between asset value and share price.
For active managers like Olive, this divergence is a feature rather than a bug. It creates the very entry point opportunities that their accumulation strategy is designed to exploit.
Portfolio Positioning for H2 2026: Counter-Cyclical Deployment
The Accumulation Framework in Practice
Olive's approach during July centred on using risk-off days as structured entry points rather than treating them as signals to reduce exposure. The long-term commodity thesis, encompassing oil, gas, uranium, copper, and gold, remained unchanged. Short-term volatility was treated as noise within a larger fundamental trend.
This is a psychologically demanding strategy. When geopolitical headlines are triggering daily price swings and liquidity is contracting, buying into weakness requires genuine conviction in the underlying thesis. The discipline to act on a framework rather than react to headlines is what distinguishes systematic commodity investors from the majority of market participants who end up buying strength and selling weakness. In addition, awareness of junior mining risks is equally critical when deploying capital into smaller, less liquid names during these windows.
New and Expanded Positions Added in July
Energy:
- Added exposure to established oil and gas producers, prioritising liquidity depth over junior exploration names
- Expanded uranium holdings, broadening energy transition exposure beyond conventional hydrocarbons
Base Metals:
- Added new copper and base metals positions across North American and Latin American jurisdictions
- Both junior developers and explorers represented in new additions
Gold:
- Increased position sizes in existing gold holdings rather than introducing new names
- Prospector elevated to a top 10 portfolio holding following continued accumulation
- A second Yukon-based gold name added incrementally during the month
The preference for scaling existing positions over introducing new names in gold reflects a common but underappreciated discipline in portfolio management: once a high-conviction position has been established and the thesis validated, incremental capital often generates better risk-adjusted returns than dispersing into unfamiliar names.
Seasonality as a Systematic Edge in Junior Resource Markets
The Commodity Equity Seasonal Calendar
| Period | Typical Market Behaviour | Tactical Response |
|---|---|---|
| July to August | Lower volume, reduced liquidity, price dislocations | Accumulate positions at discounted entry points |
| September to October | Elevated news flow from summer drill programs | Harvest gains from summer accumulation |
| Q4 (October to December) | Junior company refinancing cycle | Re-accumulate at post-financing lows |
| Late November to May | Broad seasonal uptrend | Core holding period with selective profit-taking |
The seasonality pattern in junior resource markets is not widely appreciated by retail investors but is well-understood by institutional managers with multi-cycle experience. The logic is straightforward: junior mining companies typically run their exploration programs over summer, produce results in September and October, and then refinance in Q4 to fund the following year's programmes. Each stage of this cycle creates predictable entry and exit opportunities for investors who map their activity to the calendar.
The August Liquidity Trough: Mechanics and Opportunity
August, particularly its final two weeks, represents the most pronounced liquidity trough of the year in junior resource markets. The mechanics of how this creates opportunity are worth understanding in detail:
- Trading volumes drop significantly as institutional participants take summer leave
- Market-making activity in thinly traded junior names contracts
- A single motivated seller in a low-liquidity stock can produce price declines of 3% to 10% with no change in underlying fundamentals
- These price dislocations are entirely mechanical and disconnected from company-specific news
- Investors with dry powder and a clear watch list can access positions at materially discounted prices
The critical insight here is that these dislocations are repeatable and predictable. They are not random events. They occur every year in the same window for the same structural reasons. Investors who treat them as systematic buying opportunities rather than warning signals compound this edge across multiple cycles.
The next major ASX story will hit our subscribers first
Corporate Actions: Capital Management and New Financing
Normal Course Issuer Bid Activity
| NCIB Metric | Detail |
|---|---|
| Shares Repurchased in July 2026 | 30,000 shares |
| Treasury Shares Held | 4,046,000 shares |
| Total Shares Outstanding (including treasury) | 107,207,209 shares |
Non-Brokered Private Placement
Olive announced a C$3.3 million non-brokered private placement structured as 30 million shares priced at C$0.11 per share, with a targeted closing date of approximately August 7, 2026. The timing of the raise is strategically coherent: capital raised ahead of the September to October opportunity window provides the deployment capacity to act on anticipated news flow catalysts. Full details of this and previous capital actions are available via Olive Resource Capital's news releases.
Key Catalysts to Watch: September to October 2026
The months ahead represent the most event-dense period of the resource equity calendar. Drill results from summer exploration programmes begin to flow in September, refinancing activity picks up in Q4, and investor attention returns following the August lull. For investors tracking the Olive Resource Capital July investment update framework, the specific near-term catalysts include:
- Prospector drill results anticipated in early September 2026, assessed by management as a potential re-rating catalyst
- Broader summer exploration programme results across the junior mining sector expected to elevate news flow from September onward
- Fall financing rounds by junior companies creating additional entry-point opportunities ahead of the 2027 programme cycle
Consequently, the strategic approach for the coming months involves mapping known catalysts against current portfolio positions and assessing sizing relative to expected news flow. Knowing how to approach interpreting drill results ahead of the September reporting window is a key skill for investors seeking to act on these catalysts. This event-driven overlay, applied on top of a core fundamental thesis, is what gives structured commodity investors a systematic advantage over those operating purely on headlines.
FAQ: Olive Resource Capital July 2026 Investment Update
What was Olive Resource Capital's portfolio return in July 2026?
The portfolio declined approximately 1.1%, from $18.86 million to $18.65 million. In the context of broad commodity equity weakness during a high-volatility month, management characterised this as effectively flat performance.
What drove the YTD gain of 13.2%?
Growth from $16.47 million at December 31, 2025 to $18.65 million at July 31, 2026 was primarily driven by public equity price appreciation across core holdings.
Which holding performed best in July 2026?
GeoPark recorded the strongest percentage gain at +11.34%. Omai Gold Mines was the largest absolute contributor, appreciating 5.43% to a valuation of $5.83 million.
Why do commodity equities sometimes underperform physical commodities?
During periods of macro uncertainty, institutional investors often prefer direct commodity exposure through futures and ETFs over equity proxies, which compresses producer and developer valuations even when underlying commodity prices are rising. However, this dynamic also creates the entry point opportunities that structured managers seek to exploit. Being aware of management red flags is equally important when assessing whether a discounted equity represents genuine value or a value trap.
Why is the August liquidity trough considered a buying opportunity?
Reduced summer trading volumes mean a single seller can cause outsized price declines in thinly traded junior names that are entirely disconnected from fundamental value. This creates mechanically predictable entry opportunities for prepared investors.
What new positions did Olive add in July 2026?
The firm added oil and gas producer exposure, expanded uranium holdings, initiated new copper and base metals positions across North America and Latin America, elevated Prospector to a top 10 holding, and incrementally added to a second Yukon-based gold name during the month.
This article is intended for informational purposes only and does not constitute financial advice. Past portfolio performance does not guarantee future results. All forecasts, positioning commentary, and strategic outlooks referenced herein involve uncertainty and should not be relied upon as predictions of future market behaviour. Investors should conduct their own due diligence before making investment decisions.
Want to Catch the Next Major Mineral Discovery Before the Market Moves?
Discovery Alert's proprietary Discovery IQ model delivers real-time alerts on significant ASX mineral discoveries, transforming complex geological data into actionable investment insights for both short-term traders and long-term investors — explore historic discoveries and their extraordinary returns to understand the potential, then begin your 14-day free trial at Discovery Alert to position yourself ahead of the broader market.