June 22, 2026
The Hidden Cost of Owning the Most Popular Stocks on the ASX
There is a widely held belief in investing that the safest place to put money is in the biggest, most recognisable companies. Household names with dominant market positions, decades of earnings history, and blue-chip reputations feel inherently stable. However, this psychological comfort can obscure a fundamental truth: the price you pay for an asset determines almost everything about the return you receive. Holding overvalued ASX stocks in your portfolio is not a safe investment — it is an expensive one.
This distinction matters more than ever when examining the current composition of the Australian sharemarket. Three of the ASX's most widely held stocks — companies that appear in superannuation funds, broad-market ETFs, and direct equity portfolios across the country — are currently trading at significant premiums to independent assessments of their intrinsic worth. Understanding why this matters requires a deeper look at both the valuation mechanics and the structural forces amplifying the risk.
When big ASX news breaks, our subscribers know first
Why the ASX's Structure Creates Invisible Concentration Risk
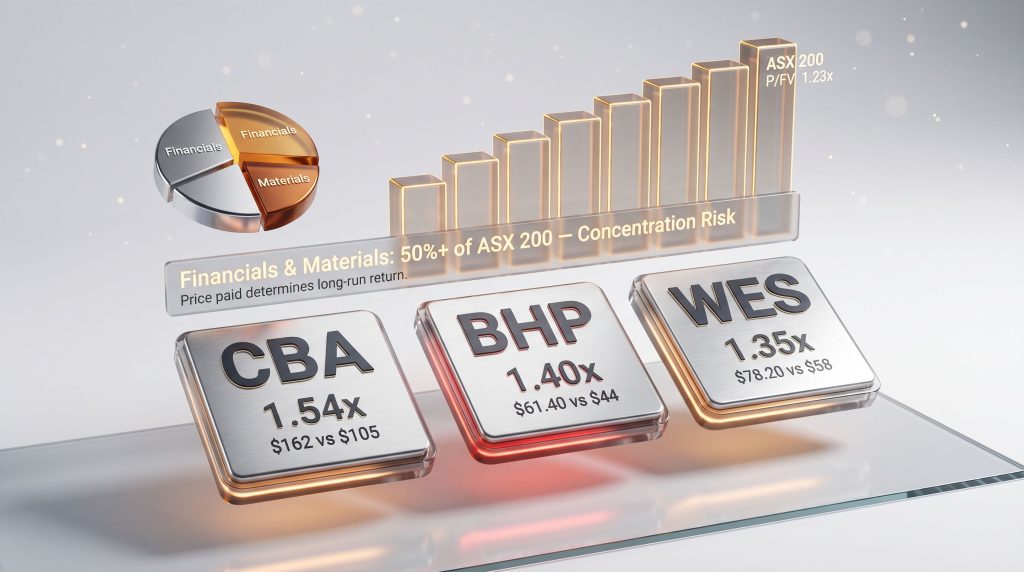
Most Australian investors believe they are diversified. They hold a mix of superannuation, index ETFs, and perhaps a handful of direct share positions. What many do not realise is that these vehicles frequently overlap in their underlying exposures. The ASX 200 index allocates more than 50% of its market capitalisation to the financials and materials sectors combined. For passive investors, a single index ETF is effectively a concentrated bet on the continued dominance of banks and miners.
This structural quirk has an important consequence. Market-cap-weighted indices mechanically increase their weighting toward the most expensive stocks as prices rise. As CBA, BHP, and Wesfarmers have climbed higher, their index weights have grown with them, meaning passive investors have been steadily buying more of the most richly priced assets at exactly the wrong time from a valuation standpoint.
Furthermore, when the same names appear across a superannuation balanced fund, a broad ASX ETF, and a direct share portfolio, the compounding concentration effect can be substantial. Many investors are unknowingly holding three or four layers of exposure to the same overvalued names without realising the depth of that risk.
What Price-to-Fair-Value Actually Measures and Why It Matters
The price-to-fair-value ratio is one of the most practical tools available to retail investors for assessing whether a stock offers good value. It compares the current market price of a share to an independently modelled estimate of what that business is actually worth based on its future cash flows.
A ratio above 1.0 means the market is already pricing in optimistic future outcomes. The further above 1.0 the ratio sits, the more rosy the assumptions embedded in the current share price, and the less room there is for upside surprise. Consequently, the potential for downside if those assumptions prove too optimistic becomes increasingly material.
A stock can be a world-class business and still represent a poor investment when purchased at a significant premium to its intrinsic worth. The price paid is the primary driver of long-run returns, not the quality of the business alone.
This distinction between business quality and investment quality is critical. The economic moat concept, which captures whether a company possesses durable competitive advantages, helps explain why a business deserves a premium valuation. But it does not justify any premium, regardless of size.
How Analysts Determine Fair Value: The Discounted Cash Flow Approach
The Mechanics Behind the Numbers
Institutional equity valuation is built on discounted cash flow modelling rather than simple trailing earnings multiples. Analysts project a company's future free cash flows over a multi-year horizon, apply assumptions about long-run commodity prices, operating margins, and capital expenditure requirements, then discount those cash flows back to a present value using a rate that reflects the riskiness of the business.
For commodity businesses like BHP, long-run price assumptions are particularly consequential. The difference between assuming copper stays at USD $6.00 per pound versus normalising to USD $3.80 per pound over the long run can shift a fair value estimate by tens of percentage points. This is precisely where current market pricing and analyst modelling diverge most sharply.
The Margin of Safety Framework
The margin of safety principle holds that investors should require a meaningful discount to fair value before committing capital. The appropriate discount varies depending on how confident analysts are in their fair value estimate, which is captured in the uncertainty rating.
| Uncertainty Rating | Recommended Margin of Safety | Implication When a Stock Trades Above Fair Value |
|---|---|---|
| Low | ~10-15% below fair value | Even a small premium creates asymmetric downside risk |
| Medium | ~20-30% below fair value | Trading above fair value carries meaningful capital loss potential |
| High | ~30-40%+ below fair value | Premium pricing combined with high uncertainty signals elevated risk |
A 1-star rating in analytical frameworks like Morningstar's system is not a signal to short a stock. It is a clear caution against deploying new capital at current prices, given that the market has already priced in a highly optimistic set of outcomes. For investors exploring overvalued ASX stocks identified by Morningstar, this framework provides a useful starting point.
CBA: When Australia's Favourite Bank Becomes Its Most Dangerous Holding
The Structural Strengths That Justify a Premium
Commonwealth Bank occupies a genuinely privileged position in the Australian financial system. As the largest of the four major banks, it benefits from a wide economic moat built on customer switching costs, cost advantages from scale, and one of the most dominant retail deposit franchises in the country.
The bank's heavy weighting toward home loans — sometimes criticised as a concentration risk — actually provides meaningful protection in the Australian context. The combination of tight underwriting standards, lender's mortgage insurance, low average loan-to-valuation ratios, a high proportion of variable-rate mortgages, and full-recourse lending structures collectively reduces exposure to the kind of systemic mortgage losses seen in other markets during credit downturns.
The Numbers That Are Difficult to Reconcile
Despite these genuine strengths, the current valuation is hard to justify on any reasonable set of forward assumptions.
CBA Valuation Snapshot
- Share Price (as at 28 May 2026): $162.20
- Fair Value Estimate: $105 per share
- Price-to-Fair-Value: 1.54x
- Economic Moat: Wide
- Uncertainty Rating: Medium
- Forward P/E: approximately 24x
- Dividend Yield: approximately 3%
A forward price-to-earnings multiple of approximately 24x for a business with a mid-single-digit earnings growth outlook is a significant mismatch. The dividend yield of roughly 3% is historically low for a major bank and inconsistent with the risk premium an investor is implicitly accepting at these prices.
The Credit Growth Slowdown Already Underway
The tailwinds that drove CBA's recent earnings strength are showing clear signs of deceleration. Housing credit grew at 7.3% in the 12 months to March 2026, with investor lending expanding at 9.6% over the same period. However, recent changes to tax concessions on investment properties, combined with a higher interest rate environment that compresses borrowing capacity, are expected to slow housing credit growth to approximately 3-4% in fiscal year 2027.
This deceleration matters because credit growth is the primary engine of mortgage bank earnings. Slower credit growth means slower net interest income growth, which in turn makes it harder to sustain the earnings trajectory that the current valuation implies. A reversion from $162 toward the $105 fair value estimate would represent approximately a 35% capital loss before accounting for any dividends received during the holding period.
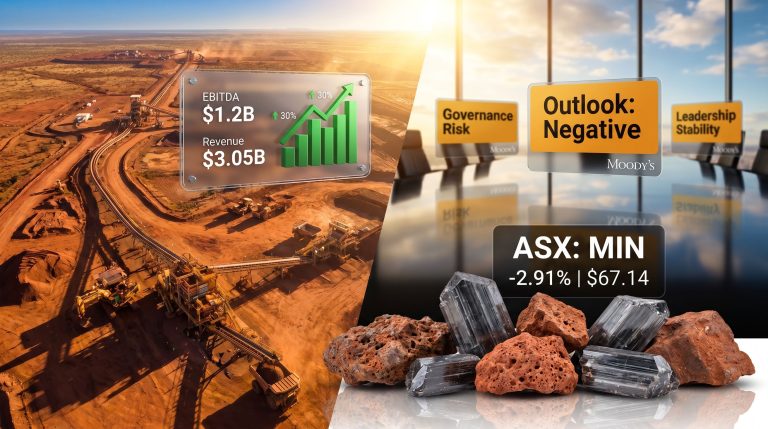
BHP: Has the Copper Boom Already Been Priced In?
Why Copper Captured the Market's Imagination
BHP's extraordinary year-to-date performance of more than 30% reflects genuine structural excitement about copper's role in the global energy transition. The convergence of data centre buildout, electricity grid expansion, renewable energy infrastructure, and electric vehicle adoption has created a near-term supply-demand dynamic that pushed copper prices toward USD $6 per pound, close to historical highs. In addition, understanding broader copper market trends helps contextualise whether this momentum is sustainable or already fully priced in.
Iron ore has also remained resilient at approximately USD $110 per metric ton, supported in part by geopolitical factors that have temporarily insulated demand from the more cautious fundamental outlook.
The No-Moat Problem in Commodity Mining
The critical analytical distinction for BHP is its absence of an economic moat. Unlike banks or retailers that can build switching costs or cost advantages that persist across market cycles, commodity miners are fundamentally price-taking businesses. They cannot influence the price at which they sell their output, and they cannot sustainably earn returns above their cost of capital across a full commodity cycle.
This is not a criticism of BHP's operational excellence. It is an acknowledgement of the structural economics of the industry. Without a moat, there is no analytical justification for a sustained earnings premium, and the appropriate valuation anchor becomes the long-run marginal cost of production rather than current spot prices.
Where Spot Prices and Long-Run Assumptions Diverge
| Commodity | Current Spot Price | Long-Run Analyst Assumption (from 2030) | Implied Normalisation |
|---|---|---|---|
| Copper | ~USD $6.00/lb | ~USD $3.80/lb | ~37% decline |
| Iron Ore | ~USD $110/mt | ~USD $75/mt | ~32% decline |
These long-run price assumptions, grounded in estimates of the marginal cost of production rather than current market sentiment, produce a forecast negative 2% five-year net profit after tax CAGR to fiscal 2030 for BHP. This stands in sharp contrast to the growth narrative currently priced into the stock.
BHP Valuation Snapshot
- Share Price (as at 28 May 2026): $61.40
- Fair Value Estimate: $44 per share
- Price-to-Fair-Value: ~1.40x
- Economic Moat: None
- Uncertainty Rating: Medium
- Year-to-Date Price Appreciation: ~30%+
The China variable adds another layer of complexity. The structural slowdown in Chinese property construction is expected to weigh disproportionately on China iron ore demand over the medium term. China's property sector accounted for a significant share of global steel consumption at the peak of its investment cycle, and the unwinding of that cycle is a multi-year process rather than a short-term dislocation.
The next major ASX story will hit our subscribers first
Wesfarmers: A Premium Retail Conglomerate at a Very Full Price
The Business Behind the Brand
Wesfarmers operates one of Australia's most recognisable collections of consumer-facing businesses. Approximately 80% of group revenue flows through retail channels, spanning hardware and home improvement, discount department stores, and office supplies. The remaining exposure comes from industrial operations.
Bunnings is the jewel in the conglomerate's crown, generating close to two-thirds of group EBIT and benefiting from a near-dominant position in the Australian hardware retailing market. Its wide economic moat is built on scale advantages, supplier relationships, and a format that has proven extremely difficult for competitors to replicate at comparable unit economics.
Kmart Group represents the second-largest earnings contributor at approximately 20% of group midcycle EBIT, but faces a structurally more challenging environment as the traditional department store format continues to lose market share to specialty brick-and-mortar competitors and online pure-play retailers.
The Revenue and Margin Outlook in Context
- Group revenue is forecast to grow at approximately 4% per year over the next five years
- Operating margins are expected to average approximately 10% across that period
- Bunnings midcycle revenue growth is modelled at roughly 5% per year, in line with broader hardware market expansion
- Kmart Group is forecast to deliver a 3% sales CAGR over five years, reflecting ongoing structural headwinds in the department store segment
Why a 37x Forward P/E Is Difficult to Justify
Wesfarmers Valuation Snapshot
- Share Price (as at 28 May 2026): $78.20
- Fair Value Estimate: $58 per share
- Price-to-Fair-Value: ~1.35x
- Economic Moat: Wide
- Uncertainty Rating: Low
- Year-to-Date Price Change: -7%
- 5-Year Revenue CAGR Forecast: ~4%
A forward P/E exceeding 37x for a business growing revenues at approximately 4% per year represents one of the most stretched valuation multiples on the ASX for a consumer-facing conglomerate. Even after a 7% price decline year-to-date, the stock remains materially overvalued relative to its estimated fair value of $58 per share.
The near-term consumer environment adds another headwind. A combination of a prolonged oil price shock and sustained interest rate pressure is expected to weigh on discretionary retail spending. The Bunnings versus Kmart divergence is a nuanced issue that many investors overlook. Those pricing Wesfarmers as essentially a pure Bunnings proxy may be underweighting the structural drag from the department store segment, which faces format-level challenges that are unlikely to reverse regardless of macroeconomic conditions.
What ASX Investors Should Actually Do When Holdings Are Overvalued
A Practical Decision Framework
- Audit your price-to-fair-value exposure across all holdings, using independent research to identify which positions currently trade above intrinsic value estimates.
- Map your concentration risk by calculating the combined weighting of financials, materials, and consumer discretionary across direct shares, ETFs, and superannuation. Applying sound diversification strategies can help reduce unintended sector concentration.
- Revisit your original investment thesis for each overvalued position. Ask whether the fundamentals that justified the initial purchase still hold, or whether price appreciation has been driven primarily by momentum and sentiment.
- Assess the asymmetry of outcomes. At a P/FV of 1.54x, CBA offers structurally limited upside from further re-rating while the downside from mean reversion is quantifiably material.
- Check for duplication across investment vehicles. Investors who hold CBA directly, within an ASX 200 ETF, and within a superannuation balanced fund may have three separate layers of exposure to the same overvalued stock.
When Holding an Overvalued Stock Can Still Be Rational
Not every overvalued position warrants an immediate exit. There are legitimate reasons to maintain exposure in certain circumstances:
- A large embedded capital gain may create a tax liability that outweighs the benefit of rebalancing, particularly for long-term holders
- Income-focused investors relying on dividends may find the yield on their cost basis from legacy holdings attractive despite elevated market prices
- Within a genuinely diversified portfolio, a moderate overweight to overvalued positions carries different risk implications than a concentrated single-stock bet
The Rebalancing Decision in Practice
| Action | When It Makes Sense | Key Consideration |
|---|---|---|
| Full Exit | New capital deployment, no significant tax event | Risk of missing further upside if momentum persists |
| Partial Trim | Reducing concentration while managing CGT exposure | Remaining position still carries downside risk |
| Hold and Monitor | Strong yield on cost, large embedded capital gain | Portfolio gradually drifts further toward overvaluation |
| Redirect New Capital | Avoiding additions to overvalued positions | Gradual rebalancing process, takes time to reduce exposure |
The Aggregate Picture: Where the ASX Sits Right Now
The overvaluation of individual names like CBA, BHP, and Wesfarmers is not an isolated phenomenon. According to Morningstar's coverage universe, the ASX 200's market-cap-weighted price-to-fair-value ratio sits at approximately 1.23x, with the financials and basic materials sectors identified as the two most expensive relative to analyst fair value estimates.
This aggregate overvaluation has a compounding effect on passive investors. Because market-cap-weighted indices increase their allocation to the most expensive stocks as their prices rise, the index itself has become progressively more concentrated in overvalued names over time. A passive ASX 200 ETF purchased today provides less valuation buffer than the same product purchased two or three years ago.
Furthermore, the case for valuation-aware active management — or at least for complementing passive exposure with equal-weight or factor-tilted alternatives — becomes stronger as the gap between price and fair value widens. Reviewing your ETF investing strategy in light of current index concentration risks is a sensible step for any long-term investor. For those seeking alternatives, ASX stocks with overbought signals can also be a useful reference when assessing where momentum may be running ahead of fundamentals.
Frequently Asked Questions
What does a price-to-fair-value above 1 mean for my ASX holdings?
A ratio above 1.0 signals that the current market price exceeds an independently modelled estimate of the stock's intrinsic worth. The premium reflects optimistic assumptions already embedded in the price, reducing the probability of meaningful upside surprise and increasing the potential downside if those assumptions prove too generous.
Can a wide-moat business still be overvalued?
Yes. A wide economic moat confirms durable competitive advantages but does not justify unlimited pricing. Both CBA and Wesfarmers carry wide moat ratings while simultaneously trading well above their estimated fair values. Moat quality affects the range of defensible valuations, not the ceiling.
Is BHP's copper exposure sufficient to justify its current premium?
Analyst modelling suggests the current copper price already reflects a highly optimistic demand scenario. Long-run price normalisation toward approximately USD $3.80 per pound, based on marginal cost of production estimates, would materially compress BHP's earnings base and fair value. Investors buying on the copper narrative may be paying for a scenario that is already fully priced.
How often should I review my portfolio for overvaluation?
A structured valuation review at least quarterly — or following price movements of 15% or more in either direction — provides a reasonable discipline. Earnings forecasts, interest rate assumptions, and commodity price outlooks can shift materially in short periods, altering fair value estimates meaningfully.
What is the most tax-efficient way to reduce overvaluation exposure?
Redirecting new investment capital away from overvalued positions, rather than selling existing holdings, allows investors to gradually rebalance without crystallising capital gains events. This approach is slower but avoids the tax drag associated with realising large embedded gains.
Key Takeaways for Australian Investors
- The ASX's structural concentration in financials and materials means most diversified Australian portfolios carry significant implicit exposure to overvalued index heavyweights
- CBA, BHP, and Wesfarmers are trading at price-to-fair-value ratios of 1.54x, 1.40x, and 1.35x respectively, reflecting material premiums to independent fair value estimates
- Business quality and investment quality are distinct concepts; the price paid relative to intrinsic value is the primary determinant of long-run returns
- Investors should audit their holdings across all vehicles including direct shares, ETFs, and superannuation to understand the true depth of their exposure to these names
- A disciplined valuation framework incorporating fair value estimates, margin of safety principles, and concentration risk assessment is the most effective long-term defence against the silent portfolio drag created by holding overvalued ASX stocks in your portfolio at the wrong price
This article is intended for educational and informational purposes only and does not constitute financial advice. All valuation estimates, forecasts, and fair value figures referenced are based on independent analyst modelling and reflect conditions as at the publication date. Past performance is not indicative of future results. Investors should consider their own financial circumstances, investment objectives, and risk tolerance before making any investment decisions. Where specific price targets or valuation estimates are cited, these represent analyst opinions and may change as new information becomes available.
Want to Spot the Next Major ASX Discovery Before the Market Does?
While avoiding overvalued large-caps is one side of the equation, the other is identifying high-potential opportunities before they become household names — and that's precisely where Discovery Alert delivers its edge, using its proprietary Discovery IQ model to send real-time alerts on significant ASX mineral discoveries the moment they are announced. Explore historic examples of major discoveries and the returns they generated to understand just how transformative early positioning can be, and start your 14-day free trial today to gain a genuine market-leading advantage.