July 22, 2026
The Long Game in Precious Metals: Why PGM Markets Are Entering a New Phase
Precious metals markets move in cycles that can span decades, and within those cycles, the signals that matter most are rarely the ones making headlines. For platinum, palladium, and rhodium, the period from 2025 into 2026 has compressed several years of market evolution into a single, volatile chapter. Supply chains are tightening in different ways for each metal, automotive demand is being reshaped by electrification at a pace that consistently surprises both optimists and pessimists, and investor flows have proven capable of moving prices far beyond what fabrication fundamentals alone would justify. Understanding what has actually happened in these markets, and where they are likely heading, requires separating genuine structural shifts from speculative noise.
When big ASX news breaks, our subscribers know first
CPM Group Platinum Palladium Rhodium Market Outlook: Where Each Metal Stands
The CPM Group platinum palladium rhodium market outlook for 2026 presents a picture that differs meaningfully across all three metals. Rather than a uniform bull or bear case, what emerges is a nuanced set of diverging supply and demand dynamics, each shaped by distinct geological, industrial, and investor-driven forces. Consequently, the platinum and palladium market dynamics at play demand careful, metal-by-metal analysis.
PGM Market Balance Summary (2024–2026)
| Metal | 2024 Balance | 2025 Balance | 2026 Projection |
|---|---|---|---|
| Platinum | Surplus (~215,000 oz est.) | Surplus (~92,000 oz) | Modest surplus, narrowing |
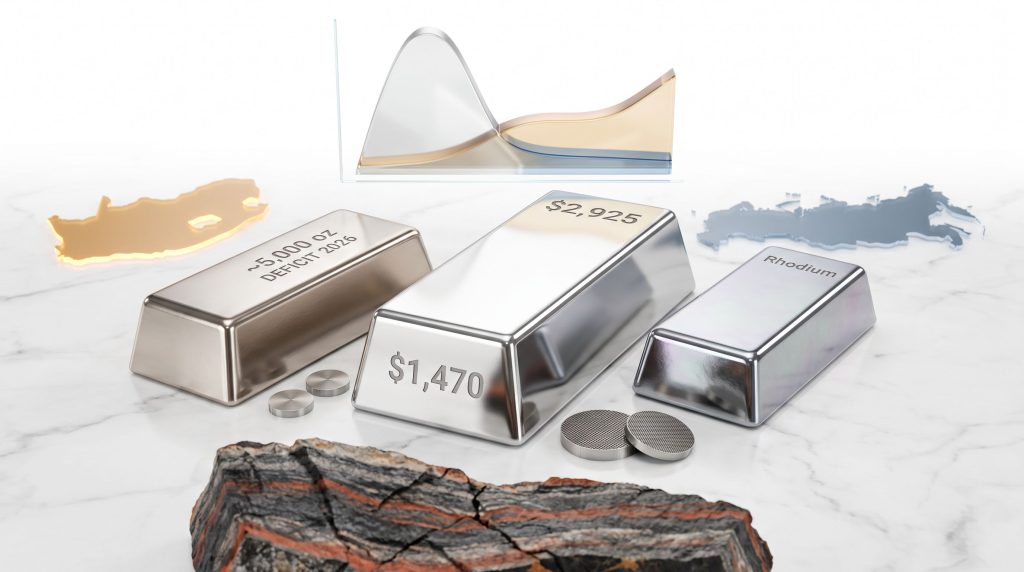
| Palladium | Surplus (~49,000 oz) | Near-balanced | Projected deficit (~5,000 oz) |
| Rhodium | Surplus | Reduced surplus | Slight surplus increase |
Platinum's surplus contracted by approximately 57% in 2025, falling to around 92,000 ounces, its smallest annual surplus in more than a decade. Palladium moved to within a hair's breadth of balance in 2025, with a projected small deficit of roughly 5,000 ounces in 2026. Rhodium's surplus is expected to widen modestly in 2026, providing a ceiling on meaningful price appreciation while offering some downside protection.
Platinum: A Decade of Range-Bound Pricing Disrupted
For roughly ten years from 2015 through mid-2025, platinum traded in a band of approximately $800 to $1,150 per ounce, with the 2024 annual average settling at $961 per ounce. That equilibrium shattered in the second half of 2025, with the annual average rising to $1,296 per ounce, a gain of around 35%. The price continued climbing into early 2026, reaching an intraday high of $2,925 per ounce on 26 January 2026, before retreating sharply to a year-to-date low of approximately $1,470.70 by 25 June 2026.
Platinum Price Performance Timeline
| Period | Price Level | Primary Driver |
|---|---|---|
| 2024 Annual Average | $961/oz | Rangebound fundamentals |
| H1 2025 | ~$950–$1,100/oz | Sideways consolidation |
| H2 2025 | Rising sharply | Investment demand surge |
| 26 January 2026 | $2,925/oz (intraday high) | Peak speculative positioning |
| 25 June 2026 | $1,470.70/oz (YTD low) | ETF liquidation, sentiment reversal |
The central question now facing platinum market participants is whether prices will revert to that prior $800–$1,150 range or whether the metal has found a new, higher base. Historically, platinum demonstrated exactly this kind of step-change repricing between 2002 and 2008, when prices rose from around $300 per ounce to over $2,100 before settling into a new floor near $800. Whether 2025–2026 represents a comparable structural shift or a purely speculative overshoot remains the defining analytical debate.
Palladium: The Tightest Balance in Years
Palladium's price trajectory through 2025 and into 2026 followed a similar arc to platinum, though its fundamental drivers differ in important ways. The 2024 annual average of $982 per ounce gave way to a 2025 average of approximately $1,170 per ounce, a gain of roughly 19%, with intraday prices briefly touching $2,000 during the year. By mid-2026, the average price had risen a further ~60% year-on-year in the first half, before retreating sharply as speculative positioning unwound.
The palladium market's fundamental condition is considerably tighter than platinum's. With a projected deficit of around 5,000 ounces in 2026, the supply-demand balance alone provides investors with a more compelling structural argument for holding the metal. Furthermore, platinum group metal supply constraints are reinforcing this tightness across the sector.
Rhodium: A Cyclical Recovery With a Clear Ceiling
Rhodium prices averaged approximately $6,288 per ounce in 2025, up around 36% from the 2024 average of $4,600. Prices reached as high as $12,250 in early 2026, with the first-half average coming in at approximately $7,526. However, with rhodium's surplus expected to widen modestly in 2026, the market structure does not support sustained price appreciation at those elevated levels.
What Actually Caused the 2025 PGM Price Spike?
Investment Demand as the Primary Accelerant
The most important insight from analysing 2025 PGM price behaviour is that investment demand, not fabrication fundamentals, drove the bulk of the price movement. A marketing document circulated during London Platinum Week in late May 2025 contained certain data points that were interpreted by investors as signals of tightening supply and surging Chinese demand. The timing was critical: gold and silver had already reached record levels through the first five months of 2025, and short-term tactical investors were actively seeking momentum in adjacent precious metals.
Platinum, palladium, and rhodium became secondary beneficiaries of a gold and silver rally, with investors rotating into PGMs seeking further upside from a momentum-driven precious metals trade rather than from fundamental conviction specific to the PGM sector.
Net ETF additions in the second half of 2025 were approximately 60–70% higher than in the first half of the year. A substantial portion of those positions have since been unwound in the first half of 2026, which explains the sharp price retracement.
Why Chinese Import Data Was Misread
One of the key speculative triggers in 2025 was a spike in Chinese platinum imports during April and May of that year. What appeared to be strong end-consumer demand growth was actually fabricator inventory restocking. Chinese fabricators had allowed inventories to run low during a period of weak imports in late 2024 and simply rebuilt those positions when prices stabilised in early-to-mid 2025.
Key points on the Chinese import dynamic:
- Platinum imports into China for full-year 2025 were actually down approximately 6% compared to 2024
- The April–May spike reflected raw material restocking, not genuine demand growth
- Second-half 2025 Chinese platinum demand fell sharply as prices rose and economic conditions softened
- Chinese EV market share continues to grow, limiting the upside for PGM-intensive gasoline autocatalyst demand
The Above-Ground Inventory Factor: The Overhang That Defines PGM Pricing
Decades of Accumulated Platinum Surpluses
One of the most under-appreciated aspects of PGM market structure is the sheer volume of metal held in above-ground refined inventories accumulated over decades of market surpluses. Systematic supply-demand data compiled since 1976 provides a long-run view of this accumulation. Estimated above-ground refined platinum inventories as of 1976 were approximately 4 to 4.5 million ounces, much of it held by the Soviet government at the time.
Two major accumulation cycles stand out:
-
1984–1992: South African producers, anticipating European catalytic converter adoption, scaled output aggressively. A single major producer acted as the marginal buyer and seller of platinum during this era, absorbing surpluses in a model similar to how De Beers managed the diamond market. When that model was abandoned following political changes in South Africa, the price remained broadly flat around $300–$500 per ounce as those inventories were gradually released.
-
2002–2011: Investor buying became the dominant force, pushing prices from approximately $300 per ounce to around $2,100 per ounce. This was not fabrication demand; it was pure investor accumulation, and when those investors partially retreated, prices found a new floor significantly above pre-accumulation levels.
Critically, these long-term investors have demonstrated significant price resilience. They treat platinum as a portfolio diversifier rather than a trading position, which means large above-ground inventories do not automatically translate into persistent selling pressure.
Palladium's Even Larger Inventory Overhang
The palladium above-ground inventory situation is even more pronounced. Estimated refined palladium inventories in the late 1970s and early 1980s exceeded 10 million ounces, with the bulk residing in Soviet government stockpiles. A fascinating historical footnote is that additional millions of ounces of palladium were held by private investors in Switzerland dating back to transactions conducted in the early 1980s. Some of those original investors, or their descendants, are believed to still hold those positions today.
The Soviet-era Norilsk Nickel operation was internally oriented toward employment generation rather than economic efficiency, producing metal surpluses as a structural byproduct. This legacy continues to shape global palladium supply dynamics today.
Key Investment Insight: The existence of large above-ground inventories does not mechanically suppress prices. The decisive variable is investor holding behaviour and willingness to sell, not the size of the inventory itself.
Approximately half of current above-ground palladium inventories are estimated to be held by long-term investors, reinforcing the point that this metal's price behaviour is more a function of investment psychology than raw supply arithmetic. In addition, safe-haven investment flows into precious metals more broadly have amplified these dynamics in recent years.
Supply-Side Dynamics: Mine Output, Costs, and Structural Risks
Platinum Supply: Bushveld Geology Shapes the Disruption Pattern
Total platinum supply declined to approximately 6.6 million ounces in 2025. Mine supply was the primary drag, with scrap supply rising roughly 6% to 1.2 million ounces. The pattern of South African mine disruptions in 2025 disproportionately affected platinum and rhodium rather than palladium, because the affected mines were located on the western limb of the Bushveld Igneous Complex, an ore body that is inherently platinum and rhodium-rich relative to its palladium content. This geological characteristic is a critical and often overlooked variable in PGM supply analysis.
A notable structural headwind to platinum scrap recovery relates to autocatalyst composition during the late 2000s to approximately 2020. During that period, manufacturers reduced platinum loadings in gasoline autocatalysts to minimal levels or eliminated them entirely, favouring palladium. As those catalysts now return to the recycling stream, they yield negligible platinum, creating a multi-year constraint on scrap recovery volumes.
Despite projected increases in both mine and scrap supply in 2026, total platinum supply is still expected to remain below 2024 levels. For further context on these structural pressures, the CPM Group's PGM outlook provides a detailed analytical framework.
The Cost Structure Problem for South African Miners
Production-weighted cash costs for the global PGM mining industry reached a record high of approximately $1,000 per ounce in 2025, driven by three concurrent pressures:
- Higher prices incentivising the processing of lower-grade ores, which inherently raises per-ounce costs
- Declining global PGM production volumes, which reduce the fixed-cost denominator in cost-per-ounce calculations
- US dollar weakness against South African rand and Russian ruble, inflating US dollar-denominated cash costs
South African PGM mining capital expenditure declined for a second consecutive year in 2025. The composition of that spending is instructive: stay-in-business capex increased while project development capex contracted, a pattern consistent with an industry managing decline rather than investing in growth. With the exception of one company funding two organic growth projects, this trend was broadly consistent across the sector.
Palladium Supply: Russia's 10% Production Decline Is the Critical Variable
Total palladium supply rose modestly to approximately 9.3 million ounces in 2025, up roughly 0.3% from 2024. Scrap supply drove the entire gain, with mine supply declining due to reduced US output and South African operational issues.
The inverse relationship between platinum and palladium scrap recovery deserves emphasis: the same autocatalyst manufacturing period (late 2000s to ~2020) that reduced platinum loadings simultaneously increased palladium loadings in gasoline catalysts. As those high-palladium catalysts return to recyclers, palladium scrap recovery benefits while platinum scrap recovery is constrained.
For 2026, total palladium supply is projected to decline, driven by an approximately 10% reduction in Russian mine output. Norilsk Nickel has guided for lower palladium production due to changes in ore mix and declining palladium grades at its primary operation. Given that Russia accounts for roughly 40% of global palladium mine supply, this is a high-impact variable regardless of any geopolitical overlay.
Rhodium Supply: South Africa's 80%-Plus Concentration Creates Vulnerability
Rhodium mine supply declined approximately 4% in 2025 to around 967,000 ounces total supply, with over 80% of global rhodium mine production concentrated in South Africa. The western limb Bushveld disruptions weighed heavily on rhodium output given the ore body's composition. An 8% increase in scrap supply partially offset mine weakness, but given scrap's smaller share of total supply, the offset was insufficient to prevent an overall decline.
For 2026, rhodium supply is projected to rise on higher South African mine output, with scrap supply broadly flat as positive factors are offset by weaker new vehicle sales reducing the volume of new catalysts entering the future scrap pipeline.
Fabrication Demand: Automotive Headwinds Across All Three Metals
The EV Transition in Realistic Terms
The automotive sector remains the dominant fabrication demand driver for platinum, palladium, and rhodium, making the trajectory of vehicle sales and powertrain mix the most consequential demand variable for all three metals. The energy transition demand picture, however, is considerably more nuanced than headline EV adoption figures suggest.
Global EV Market Share Trajectory
| Period | BEV Market Share | Key Development |
|---|---|---|
| 2022–2024 | Growth slowed | Post-incentive demand normalisation |
| 2025 | ~20% in Europe | EU ICE ban reversal announced |
| Q1 2026 | ~21% in Europe | Continued BEV growth |
| 2030 (projected) | Below earlier consensus | Revised industry projections |
| 2050 (long-term model) | Majority still ICE/hybrid | Petroleum fuel persistence |
The European Union reversed its proposed ban on internal combustion engine vehicles in late 2025, removing a key bearish demand overhang for PGMs. The US federal government eliminated EV purchase incentives in September 2025, a development expected to further reduce BEV market share in the US. Long-term modelling indicates that more than half of the global vehicle fleet will still use petroleum-derived fuels, whether ICE or hybrid, by 2050.
A cautionary historical parallel is worth noting. Approximately eight to ten years ago, a widely held view among auto industry analysts was that 2017 represented peak global vehicle production and that output would never again reach those levels. That prediction proved incorrect as strong demand from emerging and developing economies drove global production beyond 2017 levels in subsequent years, demonstrating the risk of applying developed-market consumption trends to global forecasts.
Platinum Fabrication: Second Consecutive Year of Decline
Total platinum fabrication demand fell to approximately 6.5 million ounces in 2025, down 1.2% from 2024 levels. The primary source of weakness was the European auto sector, which registered a net decline of approximately 284,000 internal combustion engine vehicles in 2025 versus 2024. Contributing factors included declining diesel passenger vehicle market share, weak commercial vehicle sales, and a general reduction in ICE vehicle volumes.
Partial demand offsets included:
- Jewellery demand growth in the US (affluent consumer segment), India (advertising-driven growth), and China (H1 2025 only)
- Electronics demand growth driven by hard disk drive demand from AI data centre buildout and broader PC sales recovery
- Note that platinum is used alongside ruthenium in hard disk drive manufacturing, linking its electronics demand to data infrastructure growth
Palladium Fabrication: 2025 Growth Giving Way to 2026 Contraction
Total palladium fabrication demand rose to approximately 9.3 million ounces in 2025, up around 0.8% from 2024. The US passenger vehicle market was the primary driver, supported by record light-duty truck market share of approximately 83% of US auto sales. Trucks carry larger autocatalysts and therefore higher PGM loadings per vehicle, amplifying the demand contribution per unit sold.
For 2026, palladium fabrication demand is projected to decline as lower global passenger vehicle sales and continued BEV market share growth outweigh expected growth in electronics sector demand.
Rhodium Fabrication: Euro 7 as a Partial Offset
Rhodium fabrication demand reached approximately 965,000 ounces in 2025, up around 1.5% from 2024. A notable demand driver was the glass industry's cyclical recovery, with manufacturers restocking rhodium after years of net selling during the post-COVID destocking period.
For 2026, the key demand support will be the phasing-in of Euro 7 emissions standards, which are applicable to the 2027 model year. Vehicles for that model year typically appear on dealer lots from H2 2026 onward. Euro 7 focuses specifically on NOx emission reductions, and rhodium is the only PGM in autocatalysts capable of reducing NOx. Tighter standards are therefore expected to require higher rhodium loadings per vehicle, providing fabrication demand support that partially offsets general automotive sector weakness.
The next major ASX story will hit our subscribers first
Geopolitical Risk: Russia, South Africa, and US Supply Vulnerability
Russia: Financial Incentives Argue Against Export Restrictions
The prospect of Russia restricting PGM exports has attracted investor attention, particularly given the broader sanctions environment since 2022. The economic reality, however, argues strongly against such a policy. Russian government finances have been under increasing pressure, with the central bank consistently selling gold reserves to fund government operations. PGM exports represent a meaningful share of Russian export revenue, creating a direct financial disincentive to restrict supply.
Furthermore, no meaningful sanctions targeting Russian PGM exports have been imposed by the EU, US, Japan, or South Korea, all of which depend on Russian palladium and platinum for automotive and electronics manufacturing. A Ukraine-Russia conflict resolution, if it occurs, is likely to affect PGM markets primarily through broader economic and financial implications rather than through direct supply changes.
Norilsk's own operational guidance projects approximately 10% lower PGM production in 2026, an entirely operational decline driven by ore mix changes and declining palladium grades, independent of any geopolitical scenario.
South Africa: Structural Decline With Ongoing Disruption Potential
South African PGM mine output has been in structural decline for over a decade, shaped by labour unrest, electricity supply constraints, political instability, and declining ore grades. While new mine development is occurring, notably with two organic growth projects at one major producer, these additions are insufficient to reverse sector-wide output trends on a net basis. Capital expenditure contraction for two consecutive years signals limited near-term production growth capacity across most of the industry.
US Supply Chain Vulnerability
The United States meets most of its PGM requirements through imports, including metal that is refined domestically from scrap but often requires offshore final processing before reimportation. The US military previously held strategic stockpiles of platinum and palladium, which were liquidated in the 1980s and 1990s. Some government agencies currently classify PGMs as strategic or critical materials, though no formal government stockpile rebuilding programme has been publicly confirmed. Domestic refining of spent industrial, petroleum, and chemical catalysts does occur within the United States, providing partial supply chain resilience.
The Minor PGMs: Ruthenium, Iridium, and Osmium
Ruthenium and Iridium: Industrial Demand Collides With Depleted Inventories
Ruthenium and iridium have both experienced sharp price increases in recent years, driven by a combination of genuine industrial demand growth and a critical structural dynamic that took decades to develop. For much of the history of PGM mining, ruthenium, iridium, and osmium were byproducts of mining operations primarily targeting platinum, palladium, and rhodium. Demand for the minor PGMs was insufficient to justify full refinement, so large quantities of semi-refined or unrefined material accumulated at producers and refiners over decades.
Those inventories have been drawn down dramatically over the last twenty years. Current estimates suggest those stockpiles have reached critically low levels, a development directly reflected in rising ruthenium and iridium prices.
Ruthenium demand has been significantly supported by:
- Hard disk drive manufacturing, where ruthenium is used alongside platinum in recording layers, benefiting directly from the data centre buildout driven by AI infrastructure expansion
- Chemical catalyst applications, particularly with alkaline processes
- Emerging applications across high-technology sectors
Iridium's price behaviour tells a particularly instructive story about the dangers of demand speculation. Between roughly 2021 and 2022, significant iridium buying occurred from refiners, traders, and manufacturers anticipating massive demand from platinum-iridium electrodes used in water electrolysis for green hydrogen production. The logic was straightforward: green hydrogen would require large-scale electrolysers, which would consume substantial volumes of platinum-iridium alloy.
The reality diverged sharply from the projection. The International Energy Agency estimates that something in the range of 58 gigawatts of electrode manufacturing capacity has been developed, against approximately 5 gigawatts of actual electrolyser deployment, implying capacity utilisation of roughly 9%. Several manufacturers have encountered financial difficulties and sold their manufacturing capacity to competitors. The consequence was a period of iridium selling from 2024 into 2025 as those overinvested positions were unwound, depressing prices. That selling pressure appears to have largely cleared, and iridium prices have since recovered, most recently surpassing $7,000 per ounce.
The green hydrogen electrolyser narrative mirrors a pattern seen repeatedly in the PGM sector: South African producers projected platinum fuel cell demand for vehicles would reach 400,000 to 1 million ounces annually by the late 1980s. That projection was first made in 1979 and has been revised and extended forward ever since without materialising at scale. Investors benefit from distinguishing between long-run potential uses and near-term demand realities.
For those seeking further analysis on PGM fundamentals, the SFA Oxford biannual PGM market outlook offers an independent research perspective worth consulting alongside other sources.
Osmium: The Exception to the Minor PGM Tightness Story
Osmium occupies a distinct position among the minor PGMs. Unlike ruthenium and iridium, osmium supply remains well supported by metal stored in tank house slimes, a byproduct of the smelting and refining process that, depending on the beneficiation method used, can yield osmium relatively early in the refining chain. As a result, osmium prices have traded in a narrow range of approximately $350 to $400 per ounce since the late 1980s, providing a degree of price predictability that makes it an attractive option for industrial users seeking cost certainty.
A wave of marketing for crystalline osmium at dramatically elevated prices, reportedly as high as $5,000 per gram in some European markets, created short-term noise but has not fundamentally altered the underlying osmium market structure. For industrial end-users, osmium's stable pricing and available supply represent a meaningful advantage compared to the tightening and increasingly expensive ruthenium and iridium markets.
The CPM Group platinum palladium rhodium market outlook for 2026 ultimately underscores that each of these metals operates within its own distinct supply, demand, and investor psychology framework. However, as the Kitco PGM market outlook commentary highlights, all three remain linked by common themes of geopolitical risk, above-ground inventory dynamics, and the evolving pace of automotive electrification. Investors who grasp these distinctions are better placed to navigate a sector that rewards analytical rigour over headline-driven positioning.
Disclaimer: This article is intended for informational purposes only and does not constitute financial or investment advice. Forecasts, projections, and price outlooks discussed herein involve inherent uncertainty and should not be relied upon as the basis for any investment decision. Past price performance of platinum group metals is not indicative of future results. Readers should conduct their own due diligence and consult a qualified financial adviser before making any investment decisions.
Want to Stay Ahead of the Next Major ASX Mineral Discovery?
While PGM markets reward those who act on structural shifts before the broader market catches on, Discovery Alert's proprietary Discovery IQ model delivers real-time alerts on significant ASX mineral discoveries — translating complex data into actionable opportunities the moment they're announced. Explore how historic discoveries have generated substantial returns on Discovery Alert's dedicated discoveries page, and begin your 14-day free trial today to position yourself ahead of the market.