July 17, 2026
When the Factory Floor Becomes a Fed Signal: Understanding Gold's Vulnerability to Economic Strength
Most investors instinctively assume that a thriving economy is universally good news. Employment is up, factories are humming, and consumer confidence is climbing. Yet for gold holders, a burst of economic strength can function as a direct headwind, triggering price declines that seem counterintuitive on the surface. Understanding why this happens requires a clear grasp of a mechanism that operates mostly out of sight: the relationship between real yields, Federal Reserve expectations, and the opportunity cost of holding a non-yielding asset.
On July 16, 2026, that mechanism played out with unusual force. The catalyst was the Philadelphia Fed manufacturing index gold price drop that followed a data release so far above consensus that markets had little choice but to reprice their expectations for monetary policy almost immediately.
When big ASX news breaks, our subscribers know first
What the Philadelphia Fed Manufacturing Index Actually Measures
Before examining the market reaction, it helps to understand exactly what this index is and why traders treat it with such urgency.
The Philadelphia Fed Manufacturing Business Outlook Survey polls approximately 250 manufacturers operating across eastern Pennsylvania, southern New Jersey, and Delaware. Released monthly by the Federal Reserve Bank of Philadelphia, it is structured as a diffusion index, which means it measures the breadth of change rather than absolute output levels. A reading above zero signals that more firms are reporting expansion than contraction. A reading below zero signals the reverse.
What makes this survey particularly influential is its timing. It is one of the earliest regional factory-sector readings published each month, arriving before the national ISM Manufacturing PMI and before most other comparable surveys. This positions it as a leading proxy for broader US industrial conditions, giving traders a first look at where the national manufacturing picture may be heading. Furthermore, understanding gold and bond dynamics is essential context for appreciating how these survey results ripple through asset classes beyond equities.
Why the Philly Fed Index Moves Gold Before National Data Does
The transmission from survey result to gold price operates through a sequence of repricing events:
-
A strong regional reading arrives ahead of national data, shifting trader expectations.
-
Elevated economic strength reduces the probability that the Federal Reserve will cut interest rates.
-
With rate cuts less likely, nominal yields hold elevated or rise.
-
Real yields, calculated as nominal rates minus inflation expectations, move higher.
-
The opportunity cost of holding gold, which pays no yield, increases relative to interest-bearing assets.
-
Institutional and speculative gold positions are unwound, pushing prices lower.
The Philly Fed index does not set monetary policy. It reshapes the probability of what the Fed will do at its next meeting, and that probability shift is sufficient to move billions of dollars in precious metals positioning within hours of publication.
The July 2026 Data: A Statistical Outlier That Repriced Gold
The scale of the July 2026 Philadelphia Fed reading was not just surprising; it was historically anomalous.
| Metric | Consensus Estimate | Actual Reading | Prior Month |
|---|---|---|---|
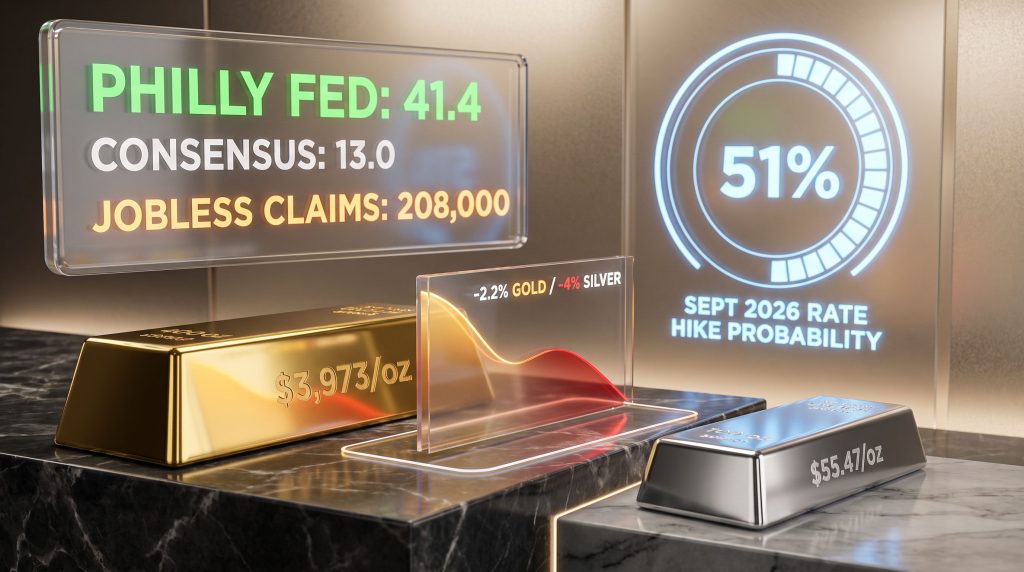
| Philadelphia Fed Manufacturing Index | 13.0 | 41.4 | 10.3 |
| Initial Jobless Claims (week ending July 11) | 217,000 | 208,000 | — |
| June Retail Sales (month-over-month) | — | +0.2% | — |
The jump from 10.3 in June to 41.4 in July represents a surge of more than 31 points in a single month, a rate of acceleration that ranks among the sharpest on record for this survey. The consensus forecast of 13.0 was exceeded by more than 218%, placing the result well outside the range of normal estimation error. Sub-indexes for new orders and shipments climbed to levels not recorded in nearly five years.
Compounding the signal further, initial jobless claims for the week ending July 11 came in at 208,000, below the expected 217,000. A labour market still operating under demand pressure, alongside a manufacturing sector accelerating at this pace, left the Federal Reserve with an extremely narrow justification for any easing action at its July 28-29 FOMC meeting.
By late afternoon on July 16, the CME FedWatch tool showed the probability of a September 2026 rate hike at approximately 51%, a dramatic shift from where expectations had been sitting in the days prior.
How Gold Responded: A 2.2% Decline in a Single Session
Gold opened on July 16 at approximately $4,060 per ounce. Within hours of the 8:30 AM ET data release, the metal had surrendered nearly $90 from its open, with the bulk of selling concentrated in the two to four hours immediately following publication. By the close, gold settled at approximately $3,973 per ounce, representing a decline of 2.2%.
This placed gold at its lowest level since November 2025 and extended its correction from the January 28, 2026 all-time high of $5,589 per ounce to approximately 29%. Consequently, any updated gold price forecast must account for this kind of data-driven volatility when projecting near-term direction.
The World Gold Council's historical research on gold and real yields provides a useful quantitative anchor here. According to that body of documented analysis, a 25-basis-point move in real yields has historically corresponded to a $40 to $60 per ounce movement in gold prices. July 16 did not produce an actual rate change. However, the repricing of rate probabilities was sufficient to produce a price reaction consistent with that historical relationship.
Why Silver Fell Even Harder: The Dual-Engine Problem
Silver's session loss of approximately 4%, falling to $55.47 per ounce, was steeper than gold's decline, and the reason is structural rather than coincidental. In addition, reviewing gold-silver ratio analysis helps clarify why the two metals diverge so markedly during periods of rate repricing.
| Driver | Gold | Silver |
|---|---|---|
| Monetary safe-haven demand | Primary | Partial |
| Industrial and manufacturing demand | Minimal | Significant |
| Sensitivity to real yield changes | High | High |
| Sensitivity to manufacturing survey data | Low | Elevated |
Silver occupies an unusual position in the commodity spectrum because it responds to two separate demand narratives simultaneously. As a monetary metal, it shares gold's sensitivity to real yield movements and Fed policy expectations. As an industrial commodity, it has meaningful exposure to manufacturing, electronics, and solar energy consumption.
When strong factory data is released, one might expect this industrial dimension to be supportive for silver. In practice, the monetary channel dominates in the short term. Strong manufacturing data signals a Fed on hold, which elevates real yields, which suppresses the monetary component of silver demand. Simultaneously, the industrial narrative, while theoretically positive, cannot overcome the weight of rate expectations repricing in the near term. The result is that silver gets hit on both fronts simultaneously.
The May 2026 Contrast: When Weak Data Also Failed to Help Gold
A critical analytical point that is often missed in coverage of the Philadelphia Fed manufacturing index gold price relationship is that weak manufacturing data does not automatically benefit gold either, at least not in 2026's policy environment.
In May 2026, the Philly Fed index collapsed from 26.7 to -0.4, a contraction that fell well below the consensus estimate of 18. Despite this dramatic deterioration in factory conditions, gold still declined during this period, falling approximately 2% to $4,556.46 per ounce on May 15 before suffering what became its largest monthly decline since late 2008 in June, an 11.3% fall.
This outcome reveals something important about the current market structure:
-
Gold's primary driver in 2026 has been monetary policy expectations, not manufacturing performance in isolation.
-
Whether factory conditions are accelerating or contracting, if the dominant signal is that the Fed will maintain elevated rates, gold faces persistent headwinds.
-
The consistent variable has been Fed Chair Kevin Warsh's hawkish posture, an emphasis on data dependency and inflation reduction that has kept rate-cut expectations suppressed across a wide range of economic conditions.
This is a subtle but important distinction for gold investors: the metal is not simply an inverse of economic conditions. It is primarily an inverse of real yields, and real yields are shaped by the intersection of economic data and central bank reaction functions.
The next major ASX story will hit our subscribers first
Gold's Full 2026 Price Trajectory: Context for the July Selloff
The July 16 decline does not occur in isolation. It is one episode in a year defined by extreme price swings tied to geopolitical events and shifting policy expectations.
-
January 28, 2026: Gold reached its all-time high of $5,589 per ounce, driven by geopolitical risk premiums and monetary debasement concerns.
-
June 15, 2026: Gold spiked to $4,300 following an Iran ceasefire announcement, a textbook geopolitical risk-off reversal.
-
June 17, 2026: Gold dropped sharply to approximately $3,948 after a hawkish FOMC meeting eliminated near-term rate-cut expectations.
-
Early July 2026: Gold partially recovered to approximately $4,155 as broader macro uncertainty persisted.
-
July 16, 2026: Gold fell to $3,973 following the Philly Fed data release, extending the correction from the all-time high to approximately 29%.
Throughout this trajectory, central bank influence on gold pricing has remained a persistent undercurrent, shaping the baseline from which these data-driven moves occur.
How the Philly Fed Compares to Other Manufacturing Indicators Watched by Gold Markets
| Indicator | Coverage | Release Timing | Gold Market Sensitivity |
|---|---|---|---|
| Philadelphia Fed Manufacturing Index | Regional (PA, NJ, DE) | Mid-month | High — early signal |
| ISM Manufacturing PMI | National | First business day of month | Very High |
| Empire State Manufacturing Index | New York region | Mid-month | Moderate |
| S&P Global US Manufacturing PMI (Flash) | National | Late month | Moderate to High |
| Durable Goods Orders | National | Around 25th of month | Moderate |
The Philly Fed's elevated market sensitivity stems directly from its release timing. Because it arrives before the national ISM PMI, it functions as an early warning system for the broader industrial picture. A reading that deviates sharply from consensus, as the July 2026 figure did, carries amplified market impact because it arrives into an information vacuum that other indicators have not yet filled.
The Structural Case for Gold Remains Separate from the Cyclical Reaction
Short-term price pressure driven by strong economic data and the real-yield mechanism is a real and well-documented phenomenon. However, conflating this cyclical dynamic with the structural investment thesis for gold is a category error that long-term investors should avoid. For those still drawn to gold as a safe haven, these cyclical dips may in fact represent strategic entry opportunities rather than signs of permanent reversal.
The fiscal arithmetic behind the structural case has not changed:
-
The US government ran a federal deficit of $1.8 trillion in fiscal year 2025.
-
Annual interest payments on the national debt reached $970 billion in fiscal 2025, the largest in US history and on track to exceed $1 trillion in fiscal year 2026, according to Congressional Budget Office projections.
-
The money supply must continue expanding to service sovereign obligations of this scale.
| Time Horizon | Primary Gold Price Driver | Directional Implication |
|---|---|---|
| Intraday to Weekly | Real yield movements, rate probability repricing | Volatile, data-dependent |
| Monthly | FOMC decisions, inflation prints, labour data | Trend-driven |
| Annual | Fiscal deficits, money supply growth, geopolitical risk | Structurally supportive |
| Multi-decade | Sovereign debt trajectory, currency debasement | Historically bullish |
A survey of 250 factory managers in Pennsylvania does not alter the trajectory of sovereign debt accumulation, money supply expansion, or the long-run purchasing power of fiat currency. These are the forces that underpin the multi-decade case for physical gold as a monetary reserve asset.
Upcoming Catalysts: What Gold Investors Should Track Next
Following the July 16 data release, several near-term events carry significant potential to shift gold pricing:
-
University of Michigan Consumer Sentiment and Inflation Expectations (July 17, 2026): Long-run inflation expectations have remained above 3% since geopolitical tensions escalated in late February 2026. A further increase would add additional pressure on the Fed to maintain its current stance.
-
FOMC Meeting (July 28-29, 2026): A rate hold is the strong consensus, but the language of the accompanying policy statement and any press conference commentary will be examined closely for signals about September.
-
CME FedWatch Tool: With September rate hike probability sitting at approximately 51% following July 16's data, this figure represents the most direct real-time gauge of gold price pressure and should be monitored with each subsequent data release. The CME FedWatch tool is publicly accessible and updated in real time, making it an indispensable resource for active precious metals participants.
A Step-by-Step Framework for Reading the Philly Fed as a Gold Signal
-
Compare the headline reading to consensus — the magnitude of the surprise matters more than the absolute number.
-
Examine new orders and shipments sub-indexes — these are the most forward-looking components of the survey.
-
Cross-reference with simultaneous jobless claims — a strong combination amplifies the rate-hold signal for gold.
-
Monitor CME FedWatch within hours of release — probability shifts are the direct transmission mechanism to precious metals pricing.
-
Assess the prevailing inflation expectations context — if long-run inflation expectations are already elevated, strong economic data creates a more acutely hawkish environment.
-
Distinguish cyclical price reaction from structural positioning — a single-session decline does not negate a multi-year allocation thesis built on fiscal and monetary fundamentals.
Frequently Asked Questions
Does a high Philadelphia Fed reading always cause gold to fall?
Not necessarily. The relationship is contingent on the prevailing interest rate environment. In a period of already-elevated real yields with no rate cuts expected, strong manufacturing data reinforces the higher-for-longer narrative and pressures gold. In an active rate-cutting cycle, strong data may slow the pace of cuts without reversing them, producing a more muted impact on precious metals.
How quickly does gold typically respond to the Philly Fed release?
Market reaction is typically immediate, with the index released at 8:30 AM ET alongside initial jobless claims. Significant surprises like the July 2026 Philadelphia Fed manufacturing index gold price reading can produce measurable gold price movements within minutes of publication, with most of the repricing complete within two to four hours.
Is gold's 29% decline from its January 2026 all-time high a structural reversal?
A structural reversal would require a fundamental change in the fiscal and monetary conditions that drove the original rally. With US debt interest payments approaching $1 trillion annually and the money supply continuing to expand, the conditions underpinning the structural case for gold remain intact even as cyclical data creates near-term price headwinds.
Disclaimer: This article is for informational and educational purposes only and does not constitute financial or investment advice. Gold and silver prices are volatile and can decline as well as rise. Past performance is not indicative of future results. Readers should consult a qualified financial adviser before making any investment decisions. Probability estimates derived from tools such as the CME FedWatch tool reflect real-time market sentiment and are subject to rapid change.
Want to Stay Ahead of the Next Major Mineral Discovery on the ASX?
While gold and silver prices navigate complex macroeconomic forces, Discovery Alert's proprietary Discovery IQ model delivers real-time notifications on significant ASX mineral discoveries, translating complex geological and market data into clear, actionable opportunities — explore the historic returns major discoveries have generated and begin your 14-day free trial to position yourself ahead of the broader market.