
June 30, 2026
The Hidden Mechanics Behind the World's Most Counterintuitive Oil Market
There is a category of market event that confounds even experienced commodity traders: a moment when the severity of a supply disruption and the direction of prices appear to point in completely opposite directions. Students of energy markets learn early that supply shortfalls drive prices higher. Yet the current oil market is delivering a masterclass in why that relationship is far more conditional than it appears.
The physical crude premiums collapse despite the Hormuz crisis is not a pricing anomaly born from faulty data or irrational markets. It is the product of deeply rational, individually defensible decisions made by buyers, refiners, and sovereign reserve managers, each optimising for their own risk horizon. The aggregate result, however, is a market that is systematically underpricing a supply catastrophe of historic proportions, and that mismatch cannot persist indefinitely.
When big ASX news breaks, our subscribers know first
What Physical Crude Premiums Actually Measure, and Why the Current Signal Is So Alarming
Most market coverage focuses on futures prices, the Brent or WTI benchmarks that flash across trading screens and make headlines when they cross round-number thresholds. But futures prices are agreements to buy or sell oil at a future date. They are, by construction, sentiment instruments, absorbing diplomatic headlines, production forecasts, and macroeconomic data.
Physical crude premiums operate in an entirely different dimension. They represent the dollar-per-barrel markup that a buyer must pay above the futures benchmark to actually receive a physical cargo of crude oil. These premiums reflect the real-world balance between cargo supply and buyer demand at specific locations and delivery windows. When physical premiums spike, it means buyers are competing aggressively for available barrels. When they collapse, it means buying activity has withdrawn, regardless of what the underlying supply picture looks like.
Furthermore, understanding geopolitical oil market dynamics is essential here, because the premium is not a supply signal — it is a buying behaviour signal.
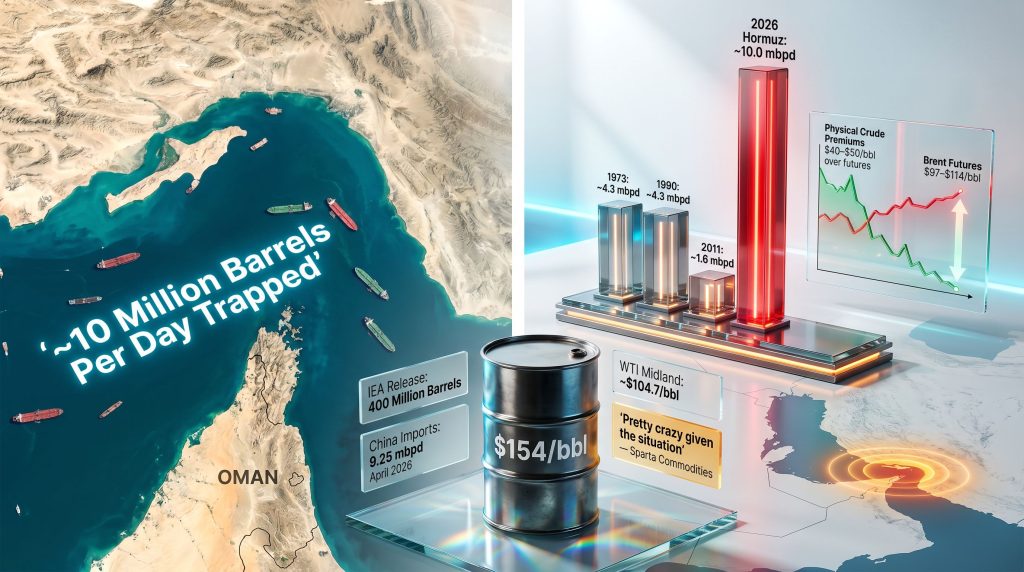
This distinction frames everything that follows. The Strait of Hormuz remains effectively closed. Approximately 10 million barrels per day of crude supply remains trapped. Yet physical crude premiums have fallen from more than $30 per barrel above Brent in early April 2026 to near-parity or small discounts during the May buying cycle, according to reporting by Reuters on spot crude premiums. The market is not telling us the crisis has eased. It is telling us that buyers have, for now, stepped back.
A Disruption Without Historical Precedent
To understand why the physical crude premiums collapse despite the Hormuz crisis is so significant, it helps to appreciate the scale of what has actually occurred to the upstream supply chain.
Before the blockade took effect in late February 2026, the Strait of Hormuz carried between 20 and 20.3 million barrels per day of crude oil and condensate, making it the single most consequential chokepoint in global energy infrastructure. No alternative route exists with comparable throughput capacity. When the strait is closed, that volume does not reroute. It simply disappears from available supply.
The scale of the current disruption dwarfs every prior geopolitical supply shock on record:
| Disruption Event | Estimated Volume Affected | Approximate Futures Impact | Physical Premium Spike |
|---|---|---|---|
| 1973 Arab Oil Embargo | ~4.3 mbpd | +70% over several months | Moderate |
| 1990 Gulf War | ~4.3 mbpd | +$15 to $20/bbl | Limited |
| 2011 Libya Uprising | ~1.6 mbpd | +$15/bbl | Minimal |
| 2026 Hormuz Blockade | ~10.0 mbpd | +$40 to $50/bbl at peak | $40 to $50/bbl over futures |
The 2026 disruption is roughly 2.3 times larger than either the 1973 or 1990 events, which themselves were considered defining crises of their respective eras. The initial price response reflected this severity: Brent futures surged to $114 per barrel at their peak, North Sea Forties blend reached approximately $147 per barrel in early April, and projections for Dated Brent under extended closure scenarios pointed toward $154 per barrel. U.S. retail gasoline prices climbed by more than $1 per gallon within seven weeks of the crisis beginning.
Then, during the May buying cycle, physical premiums collapsed. That collapse is what demands explanation.
The Four Structural Forces Suppressing Physical Crude Prices
The near-parity physical premium environment has been produced by four concurrent forces, each individually significant, but collectively capable of temporarily masking a supply emergency of unprecedented scale.
Strategic Reserve Releases Absorbing Immediate Demand Pressure
The International Energy Agency coordinated what it describes as the largest emergency reserve release in its institutional history: a 400 million barrel drawdown across member nations. For context, the IEA's 2022 reserve release, which was itself considered a major intervention, totalled approximately 182 million barrels, less than half the current deployment.
At a consumption offset rate of roughly 2 to 3 million barrels per day, this volume provides an estimated four to six months of partial cushioning. However, that clock started running weeks ago, and the United States entered this crisis with Strategic Petroleum Reserve levels already at multi-decade lows, limiting the depth of the American contribution to the coordinated release.
The mechanism is straightforward: by injecting pre-stored crude directly into the spot market, the IEA release reduces the urgency for refiners to chase prompt physical cargoes at elevated premiums. Why pay $147 per barrel for a Forties cargo when reserve-release volumes are available at lower delivered cost?
China's Demand Withdrawal Removing the World's Largest Buyer
China's behaviour in the April buying window produced data points that would have seemed implausible in any prior planning scenario. Official customs data registered crude oil imports of 9.25 million barrels per day in April 2026, representing a 20% year-on-year decline equivalent to approximately 2.4 million barrels per day of lost import volume. This was the lowest monthly import figure since July 2022, when pandemic-era lockdowns were still actively suppressing Chinese economic activity.
The behavioural signals accompanying this volume decline were equally significant. In a move described by market observers as highly unusual for the country's largest state-owned refiners, Chinese oil majors began reselling previously contracted crude cargoes for May loadings rather than taking delivery. This is not the action of a buyer experiencing temporary logistics delays. It is a deliberate strategic withdrawal from the physical market.
Independent refiners, the so-called teapot refineries that account for a substantial portion of China's total refining throughput, responded to compressed margins and constrained Middle Eastern feedstock access by slashing run rates. When China, which absorbs roughly one-fifth of global crude supply, simultaneously reduces imports, draws down onshore inventories, resells contracted cargoes, and cuts production, the effect on physical cargo competition is profound.
Vortexa Chief Economist David Wech identified this combination of reduced Chinese imports and rising domestic inventory drawdowns as one of the central mechanisms through which the market has maintained a semblance of balance during the worst supply crisis in its history. However, Wech was explicit that this dynamic has a finite duration and cannot be sustained much longer, according to Vortexa's published market analysis from late April 2026.
Refinery Maintenance Cycles Compressing Near-Term Buying Requirements
A third factor operating simultaneously is the convergence of scheduled and accelerated spring maintenance windows across a significant portion of global refining capacity. Refiners who would normally conduct maintenance later in the second quarter pulled forward their programmes in response to elevated feedstock costs and constrained Middle Eastern supply availability.
The arithmetic is direct: a refinery undergoing maintenance is not purchasing crude. When a meaningful proportion of global capacity enters maintenance simultaneously, the aggregate effect on physical cargo demand is substantial, and premiums fall accordingly. This is a temporary dynamic, and it inverts sharply when maintenance concludes and refiners return to purchasing for peak summer production requirements.
Record U.S. Crude Exports Providing Atlantic Basin Supply Alternatives
The fourth force operating in the current market is the surge in American crude exports to an all-time high, with WTI Midland barrels being redirected toward both Asian and European markets. WTI Midland was trading at approximately $104.7 per barrel during the relevant period, providing buyers with an accessible, non-Hormuz-linked alternative to Middle Eastern grades.
The availability of American crude at scale has given refiners an alternative sourcing option that reduces competitive pressure for the spot cargoes that do remain available from Atlantic Basin producers. This diversification of physical supply reduces the premium that any individual cargo can command, even against a backdrop of catastrophic Gulf supply loss. Consequently, the trade war oil markets dynamic has further complicated how buyers assess sourcing risk.
The Behavioral Economics of the Bare Minimum Strategy
Beneath the four structural forces lies a behavioural dynamic that market intelligence firm Sparta Commodities has identified as perhaps the most consequential driver of the physical premium collapse. Analysts at Sparta describe Asian buyers as operating on a deliberate "bare minimum" supply strategy, drawing down onshore inventories to continue operations rather than restocking at elevated spot prices.
The individual logic of this approach is compelling. A refiner who purchases expensive physical cargoes in the $130 to $150 per barrel range faces catastrophic mark-to-market losses if diplomatic progress between the United States and Iran produces a rapid Strait reopening and a consequent collapse in premiums. The rational response is to defer purchases, extend existing buffers as long as possible, and wait for either a clear diplomatic resolution or clear evidence that the strait will remain closed long enough to justify re-entry at elevated prices.
This is a textbook example of a market coordination failure at the systemic level. Every individual refiner is making the correct decision for their own balance sheet. The aggregate of those decisions, however, creates a market that is systematically underbidding for supply during a historic shortage, building fragility that will release violently when buffers deplete simultaneously.
Helima Croft, Head of Global Commodity Strategy and MENA Research at RBC Capital Markets, identified a specific mechanism amplifying this dynamic in a research note published in May 2026. Repeated diplomatic headlines suggesting potential U.S.-Iran conflict resolution have provided buyers with ongoing justification to defer purchases. Croft's analysis noted that while positive ceasefire headlines have kept futures prices contained, they have simultaneously been preventing the degree of demand curtailment that the underlying supply situation would actually require to achieve genuine market balance ahead of summer peak demand.
Neil Crosby, Senior Oil Market Analyst at Sparta Commodities, captured the market's current mispricing with unusual directness in a published market outlook, noting that physical crude premiums had collapsed to levels below 2024 and 2025 historical averages. Crosby further identified what he described as an arbitrage setup, noting that Brent-linked physical crude appeared undervalued relative to the underlying supply reality and that conditions were set for a premium rebound once the market accepted that the Strait of Hormuz would remain closed through the summer.
Paper Markets Versus Physical Reality: A Dangerous Divergence
One of the defining features of the current market structure is the growing disconnect between what futures prices are signalling and what physical market dynamics actually reflect.
| Market Layer | Current Signal | Primary Driver |
|---|---|---|
| Brent Futures | Volatile; ranging $97 to $114/bbl | Diplomatic sentiment; reacts to ceasefire headlines |
| Physical Spot Premiums | Collapsed from $30+ to near-parity or discounts | Buyer restraint, inventory drawdowns, IEA releases |
| Delivered Physical Price (Asia) | Still elevated, approximately $130+/bbl | Freight, insurance, and rerouting costs embedded |
| Dated Brent Differential | Below 2024/25 historical averages | Described by Sparta Commodities as anomalous given the crisis |
Futures markets are, by nature, forward-looking and sentiment-driven. When a ceasefire headline emerges, algorithmic and discretionary futures traders bid prices down, pricing in a probability of imminent resolution. Physical markets, operating on two to six week cargo delivery cycles, are slower-moving but ultimately more fundamental, as they reflect the actual competition for real barrels.
The current divergence means paper prices are discounting diplomatic resolution while physical prices are discounting buyer restraint. These two signals must eventually converge. The direction and speed of that convergence — whether through a diplomatic breakthrough that collapses prices or a buffer depletion event that forces buyers back into the market simultaneously — is the defining risk facing energy markets through the summer of 2026. For a broader view, the current crude market overview provides additional context on how benchmarks are behaving across different timeframes.
The next major ASX story will hit our subscribers first
The Buffer Depletion Timeline: A Race Against the Seasonal Calendar
Morgan Stanley's assessment, published in the week prior to this analysis, is unambiguous: the market's current equilibrium is a race against time, with strategic buffers potentially exhausting before the Strait of Hormuz reopens.
The key buffer dimensions to track include:
- IEA strategic reserve deployment: At a consumption offset of 2 to 3 million barrels per day, the 400 million barrel coordinated release has a theoretical maximum duration of roughly 4 to 6 months, and drawdowns have been ongoing since the crisis began
- Chinese onshore inventory drawdowns: China's combination of reduced imports and continued refinery operations at reduced rates is accelerating depletion of domestic crude stockpiles at a pace Vortexa characterises as unsustainable beyond the near term
- Seasonal demand inflection: Global refinery throughput typically increases materially in May and June as refiners prepare summer fuel production, creating a structural increase in crude purchasing requirements precisely as existing buffers approach depletion
The intersection of these three dynamics creates a narrow but critical vulnerability window in the late May to July 2026 timeframe. If the Strait of Hormuz remains closed through this period, the conditions for a violent physical premium reversal accumulate with each passing week.
Global Trade Flow Restructuring: The Geography of Crisis Adaptation
While physical premiums for traditional benchmarks have compressed, the global trade flow disruption has produced significant geographic winners and losers.
Supply beneficiaries from Atlantic Basin and alternative origin pivots:
- Brazilian crude exports to China have approximately doubled as buyers pivot to Atlantic Basin alternatives
- Japan received its first Central Asian crude cargo since the crisis began, reflecting urgent diversification strategies among Asian importers
- West African grades, including Nigerian Bonny Light, are commanding elevated premiums relative to pre-crisis norms as substitutes for unavailable Middle Eastern supply
- Canadian oil sands producers have identified a strategic opportunity, though pipeline infrastructure constraints limit near-term export growth
Refinery and downstream stress points:
- OPEC market influence has been severely curtailed, with OPEC output falling to a 26-year low amid the crisis, compounding the primary Hormuz supply constraint
- India's state-owned fuel retailers are absorbing substantial losses as the government maintains retail price freezes to protect consumers from the full inflationary impact of the crude price surge
- Japan and South Korea have pivoted toward increased coal consumption as LNG markets simultaneously tighten, with both countries identified in separate reporting as having turned to coal as Asia's major LNG import alternative
These trade flow adjustments represent the market's emergency adaptation mechanism. However, they come with material cost premiums embedded in freight, insurance, and routing inefficiencies that do not appear in headline benchmark prices.
Scenario Analysis: Three Paths for Physical Crude Premiums Through Summer 2026
Disclaimer: The following scenarios represent analytical projections based on available market data and expert assessments as of mid-May 2026. They are not investment advice. Energy markets are subject to rapid, unpredictable change driven by geopolitical, diplomatic, and military developments that cannot be reliably forecast.
| Scenario | Strait Status | Physical Premium Trajectory | Brent Futures Range | Primary Risk |
|---|---|---|---|---|
| 1 – Early Resolution | Open by July 2026 | Rapid normalisation toward historical norms | $80 to $90/bbl | Demand rebound speed exceeds supply re-entry rate |
| 2 – Extended Closure | Closed through July 2026 | Sharp spike; $40 to $60/bbl over futures | $110 to $154/bbl | Buffer exhaustion triggers simultaneous buyer re-entry |
| 3 – Prolonged Disruption | Partially restricted beyond Q3 2026 | Structurally elevated; new risk premium established | $130 to $160+/bbl | Embedded demand destruction and recession feedback loops |
Scenario 2 carries the most immediate risk weight. Morgan Stanley's explicit warning that buffers could deplete before the strait reopens, combined with Vortexa's assessment that China's import reduction is approaching its sustainable limit, and Sparta Commodities' identification of an imminent arbitrage setup for physical re-entry, all point toward this scenario as the relevant risk case for market participants managing exposure through the summer. In this context, revised OPEC demand forecasts will be closely watched as a leading indicator of how quickly the balance may shift.
Key Metrics for Monitoring Physical Market Re-Entry Timing
For traders, risk managers, and investors tracking when the physical crude premium rebound may materialise, the following indicators provide the most direct signal:
- Dated Brent differential relative to front-month Brent futures: the primary gauge of physical market tightness
- Chinese crude import volumes via monthly customs data: the single most influential demand variable in the current market
- IEA strategic reserve drawdown rate and remaining coordinated release capacity
- U.S. crude export volumes from weekly EIA data: measures the availability of non-Hormuz supply alternatives
- Refinery utilisation rates in Asia and Europe: the clearest signal of when buyers must re-enter the physical market
- Frequency and specificity of U.S.-Iran diplomatic communications: the primary driver of the buyer restraint cycle; as peace prospects fade, the justification for deferred purchasing diminishes
Frequently Asked Questions
What is a physical crude premium and why does it matter?
A physical crude premium is the dollar-per-barrel markup that a buyer pays above a benchmark futures price to receive actual delivery of crude oil. It is distinct from futures prices in that it reflects real-world competition for available barrels rather than sentiment about future supply and demand. When physical premiums rise sharply above futures, it signals intense competition for prompt supply. When they fall, as now, it signals buyer withdrawal regardless of the underlying supply picture.
Why are physical crude premiums falling when the Strait of Hormuz is still closed?
The decline reflects deliberate buyer restraint rather than improved physical supply. Refiners are drawing down existing onshore inventories, operating at reduced run rates, and waiting to observe whether diplomatic negotiations produce a resolution before committing to expensive spot purchases. Strategic reserve injections from the IEA and reduced Chinese import activity have temporarily reduced competitive pressure on available cargoes.
How long can the current buffer strategy sustain the market?
Based on the IEA's 400 million barrel coordinated release timeline and China's inventory drawdown trajectory, most market analysts assess the current buffer period as extending into late May or June 2026. The convergence of depleting buffers with seasonal peak demand requirements creates a critical vulnerability window in the late May to July 2026 timeframe.
What triggers the physical premium rebound?
Physical premiums are likely to surge once the market becomes convinced that the Strait of Hormuz will remain closed through the summer and that buyers must secure volumes for peak-season refinery runs. The trigger could be a clear deterioration in U.S.-Iran diplomatic prospects, a visible depletion of inventory buffers at major storage hubs, or a refinery throughput ramp-up signal in Asia or Europe.
A Temporary Equilibrium Built on Exhaustible Foundations
The physical crude premiums collapse despite the Hormuz crisis represents one of the most instructive episodes in energy market history, demonstrating how rational individual behaviour can produce collectively irrational market outcomes.
Four forces — the IEA's record reserve release, China's import withdrawal, accelerated refinery maintenance, and record U.S. export volumes — have created a temporary equilibrium that has compressed physical premiums to below 2024 and 2025 historical averages even as the world's largest oil supply disruption continues unresolved. This is not a market that has found balance. It is a market in managed delay.
The window before the next physical price shock is narrowing. Strategic reserve drawdowns are progressing. Chinese onshore inventories are depleting. Refinery maintenance windows are closing. Summer demand is approaching. When buyers must re-enter the physical market simultaneously, the arbitrage setup that analysts at Sparta Commodities have already identified will close rapidly and potentially violently.
The market is not currently pricing catastrophic tightness. When it does, the adjustment is unlikely to be gradual.
Want to Stay Ahead of the Next Major Resource Discovery Amid the Chaos?
While oil markets grapple with historic supply dislocations and the ripple effects of the Hormuz crisis reshape commodity flows globally, Discovery Alert's proprietary Discovery IQ model delivers real-time alerts on significant ASX mineral discoveries — cutting through the noise to surface actionable opportunities before the broader market reacts. Explore how major discoveries have historically generated extraordinary returns on Discovery Alert's dedicated discoveries page, and begin your 14-day free trial today to position yourself ahead of the next market-moving find.