July 18, 2026
When Supply Cannot Follow Price: The Structural Logic Behind Platinum's Multi-Year Deficit
In most commodity markets, a sustained price signal above the cost of new production triggers a supply response. Capital flows toward development, new mines advance through permitting, and within a decade the market corrects. Platinum is demonstrating that this mechanism has a breaking point. Four consecutive annual deficits have not produced a meaningful wave of new mine development, and the South Africa platinum deficit continues to widen the gap between what the market needs and what it can realistically produce. Understanding why that feedback loop has failed is the starting point for any credible analysis of where platinum prices, supply volumes, and investment opportunities are heading.
When big ASX news breaks, our subscribers know first
The Numbers Behind the South Africa Platinum Deficit
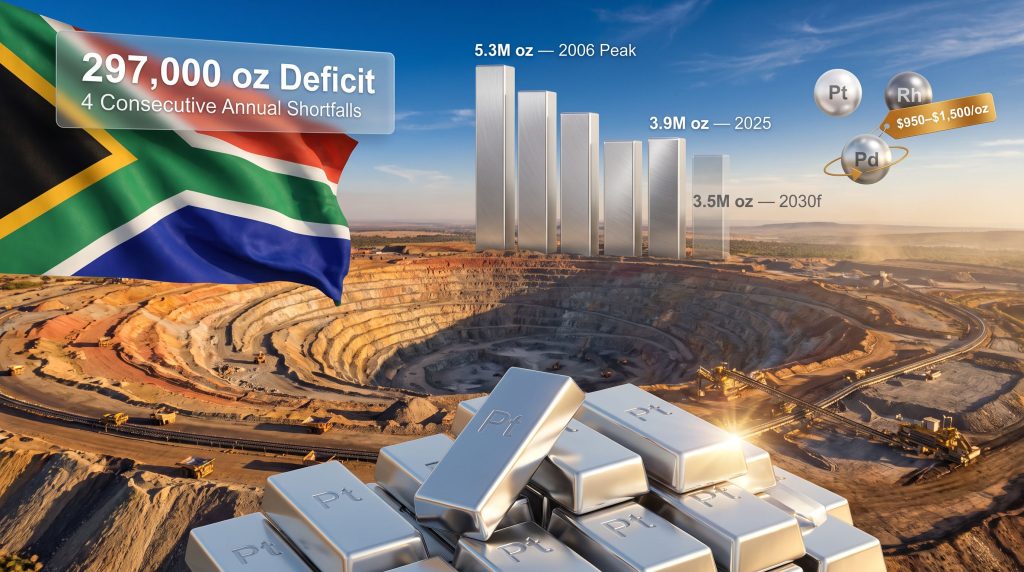
The World Platinum Investment Council (WPIC) revised its 2026 platinum deficit forecast upward to 297,000 ounces in its Q1 2026 Platinum Quarterly, climbing from an earlier estimate of 240,000 ounces published just one quarter prior. That revision within a single reporting cycle is not a minor statistical adjustment. It signals that the forces compressing supply are moving faster than forecasters had modelled.
The cumulative effect of four consecutive shortfalls is visible in one particularly telling metric: above-ground stock cover is now expected to fall below three months of global demand by the end of 2026, with total inventories sitting at approximately 3.1 million ounces. When inventories decline to this level, the buffer that normally absorbs short-term mismatches between mine output and consumption becomes dangerously thin.
| Metric | Value |
|---|---|
| 2026 Projected Annual Deficit (WPIC, May 2026) | 297,000 oz |
| Previous 2026 Deficit Forecast (WPIC, Q1 2026) | 240,000 oz |
| Above-Ground Stock Cover | Less than 3 months of global demand |
| Current Above-Ground Inventories | ~3.1 million oz |
| South Africa's Share of Global Platinum Supply | ~70-80% |
| South African Output (2006 Peak) | ~5.3 million oz |
| South African Output (2025) | ~3.9 million oz |
| Production Decline Over Two Decades | ~26% |
| WPIC Structural Deficit Forecast (Through 2029) | 500,000-700,000 oz annually |
Physical tightness is also registering in two market-specific technical signals. Elevated lease rates, which represent the cost of borrowing physical platinum, have risen as near-term availability contracts. Simultaneously, the platinum forward curve has moved into backwardation, meaning buyers are willing to pay a premium for immediate delivery over future delivery. Both indicators reflect real supply stress rather than speculative positioning. Furthermore, according to Mining Weekly, the platinum deficit has worsened beyond initial forecasts, reinforcing the severity of these market signals.
A deficit revised upward by 57,000 ounces within a single quarterly cycle suggests that supply constraints are accelerating, not stabilising.
The Bushveld Complex: Why Geological Abundance Is Not Translating Into Production
South Africa hosts approximately 91% of global platinum group metal reserves, yet national output has contracted by roughly 26% over two decades, falling from a peak of approximately 5.3 million ounces in 2006 to around 3.9 million ounces in 2025. This contradiction sits at the core of the South Africa platinum deficit problem: the world's most reserve-rich nation is progressively producing less of the metal it dominates.
Several structural factors explain this divergence between reserve size and production capacity:
- Shaft age and infrastructure decay: Many of the Bushveld Complex's primary operations are multiple decades old. Refurbishing or replacing shaft infrastructure requires capital commitments measured in billions of rand, at economics that are increasingly difficult to justify given declining ore grades at depth.
- Increasing mining depth: As shallower, higher-grade portions of reef systems are exhausted, operations must pursue ore bodies at greater depths, where extraction costs rise sharply per ounce produced.
- Eskom grid instability: Chronic electricity supply disruptions from South Africa's state utility continue to increase operating costs and reduce throughput predictability, eroding margins even at elevated metal prices.
- Mine closures since 2016: A series of operational suspensions and permanent closures has removed meaningful production capacity from the market without equivalent replacement volumes being developed elsewhere.
The Western Limb region of the Bushveld Complex, which holds approximately 39% of underground platinum stock, is projected to contribute only around 47% of national production in 2025 as its most productive shaft infrastructure approaches end-of-life. The directional trend is firmly downward, and the trajectory through 2030 reinforces that position.
| Year | Estimated SA Platinum Output |
|---|---|
| 2006 (Peak) | ~5.3 million oz |
| 2025 | ~3.9 million oz |
| 2030 (Projected) | ~3.5 million oz |
| Cumulative Decline (2006-2030f) | ~34% |
The Inelasticity Problem: Supply That Cannot Respond to Price
One of the less widely appreciated dynamics in the platinum market is how structurally inelastic primary supply has become. Primary mine production of platinum has been declining over recent years even as the metal price has risen substantially over the same period. That combination — falling output alongside rising prices — is a hallmark of a market where supply constraints are geological and operational rather than economic.
The implication is significant: if above-ground inventories decline to critically low levels and a major operational disruption occurs in South Africa, there is no readily deployable reserve of unproduced but economically viable supply waiting to fill the gap. The market would face a physical squeeze with no near-term resolution pathway. The metals and mining geopolitics surrounding South Africa's dominant position only amplify this vulnerability.
Brownfield Expansion: Production Stability Without Supply Diversification
South African producers are not standing still in the face of declining output. The primary strategic response has been to advance brownfield extensions of existing operations, developing adjacent ore bodies using established shaft infrastructure, processing facilities, and workforce capabilities. This approach offers several genuine advantages over greenfield mine development:
- Lower capital intensity per ounce of new production
- Shorter permitting timelines due to existing operational licences
- Established metallurgical processing and logistics infrastructure
- Reduced technical execution risk compared to developing entirely new deposits
Sibanye-Stillwater illustrates the scale and timeline of this approach. The company is advancing seven mechanised UG2 reef projects across its Rustenburg and Marikana operations, targeting first production for March 2027. Its K4 brownfield extension project is currently 77% complete, underpinned by a capital budget of approximately R4.4 billion, with R964 million specifically allocated across 2026 and 2027. Critically, however, steady-state production from these projects is not expected until 2033, highlighting that even brownfield development within established operational footprints carries extended lead times.
Brownfield expansion solves the production volume problem in the near term. It does not solve the geographic concentration problem at all.
If South African output declines by a further 10% over the next five years as current trajectories suggest, the market would need to source an additional 390,000 ounces annually from alternative jurisdictions. No credible supply pipeline currently exists to meet that volume requirement.
| Development Type | Timeline to Production | Capital Intensity | Geographic Diversification | Supply Risk Profile |
|---|---|---|---|---|
| Brownfield (SA) | 3-7 years | Moderate | None | High concentration risk |
| Greenfield (SA) | 10-15 years | Very High | None | High concentration risk |
| Greenfield (Outside SA) | 10-15 years | Very High | Significant | Lower systemic risk |
Platinum, Rhodium, and Palladium: Three Metals, Three Distinct Frameworks
One of the most consequential analytical errors investors can make in the PGM space is treating platinum, rhodium, and palladium as a unified commodity category. Each metal is driven by fundamentally different supply and demand dynamics, and their medium-term outlooks diverge sharply. In addition, understanding these distinctions is essential for navigating the broader platinum and palladium dynamics that are reshaping PGM investment strategies.
Platinum: Deficit-Supported With Growing Demand Vectors
Platinum's demand base is genuinely diversifying beyond its traditional autocatalyst role. While gasoline and diesel vehicle catalytic converters remain the largest demand segment, growing applications in hydrogen fuel cell technology, industrial chemistry, and jewellery provide additional demand floors. The critical minerals demand driven by the energy transition is increasingly placing platinum at the centre of clean technology supply chains. The WPIC projects structural deficits of 500,000 to 700,000 ounces annually through 2029, a volume that would represent an extreme draw on an already depleted above-ground inventory base.
Rhodium: Illiquid, Volatile, and Highly Concentrated
Rhodium presents perhaps the most extreme supply concentration risk of any traded commodity. South Africa accounts for the overwhelming majority of global rhodium output, a dependency even more pronounced than platinum. What makes rhodium uniquely vulnerable is the absence of a formal futures market. Without standardised hedging instruments, producers and consumers cannot manage price exposure through conventional financial mechanisms. The result is that operational disruptions in South Africa can produce sharp, rapid price spikes that neither buyers nor sellers can hedge against. Limited secondary supply from recycling adds further rigidity to the supply structure.
Palladium: A Structurally Weaker Outlook
Palladium operates under a fundamentally different set of conditions. It is expected to remain in market surplus through the medium term, driven by two converging demand headwinds. First, automakers are actively substituting platinum for palladium in gasoline catalytic converters, directly eroding palladium's primary demand base. Second, the accelerating adoption of battery electric vehicles is reducing total autocatalyst demand across all PGMs, with palladium absorbing a disproportionate share of that decline given its concentration in gasoline applications. Heraeus's 2026 Precious Metals Forecast projects palladium to trade within a range of $950 to $1,500 per ounce, reflecting the combination of adequate supply and weakening structural demand.
| Metal | Market Position | Primary Demand Driver | Key Risk | Price Outlook |
|---|---|---|---|---|
| Platinum | Structural deficit | Autocatalysts, hydrogen, industrial | SA supply concentration | Supported |
| Rhodium | Deficit, illiquid | Gasoline autocatalysts | No futures hedge, SA concentration | Volatile, upside risk |
| Palladium | Surplus expected | Gasoline autocatalysts | BEV substitution, demand erosion | Capped, $950-$1,500/oz range |
Currency Dynamics and Monetary Policy: The Cost Equation for South African Producers
The rand-dollar exchange rate functions as a natural cost management tool for South African platinum producers. Because operating costs are denominated primarily in rand while platinum revenues are earned in US dollars, a weaker rand mechanically reduces the dollar-equivalent cost of producing each ounce. The rand traded at approximately R16.49 per US dollar in mid-July 2026, following a period of currency depreciation that provided some margin relief to producers operating in a high-cost environment.
However, the South African Reserve Bank (SARB) has signalled continued monetary tightening in response to inflation expectations that remain above its target range. Higher interest rates increase financing costs across capital-intensive mining operations and apply upward pressure to operating expenses. The net operating environment for South African producers is therefore one of partial offsets: currency weakness supports margins while monetary policy tightening partially erodes them. Consequently, the broader transition toward renewable energy in mining may offer some producers a pathway to reduce their exposure to Eskom-related cost volatility.
The next major ASX story will hit our subscribers first
The Global Development Pipeline: Where Will New Supply Come From?
Outside the established Southern African mining districts, the global pipeline of advanced-stage PGM development projects is notably thin. Economically significant PGM mineralisation is geologically concentrated in a small number of regions:
- Southern Africa (Bushveld Complex in South Africa, Great Dyke in Zimbabwe)
- Russia (Norilsk region, where geopolitical risk adds supply uncertainty)
- North America (Montana's Stillwater Complex, Ontario)
- Brazil (Ceará State and associated geological terranes)
Brazil is increasingly attracting attention as an alternative PGM jurisdiction, partly because of its established mining industry infrastructure. The country ranks among the world's top ten gold-producing nations, generating approximately $3.8 billion annually in gold output and targeting revenues exceeding $6 billion by 2030. This existing mining industry depth translates into available engineering workforce capability, functional regulatory frameworks, and processing infrastructure that can be leveraged for PGM development at lower incremental cost than establishing operations in entirely new mining regions.
ValOre Metals is advancing the Pedra Branca PGE project in Ceará State, Brazil, as an exploration-stage example of geographically diversified PGM supply potential. The project hosts a 2022 NI 43-101 Inferred Resource of 2.2 million ounces of platinum, palladium, and gold within 63.3 million tonnes grading 1.08 grams per tonne across seven near-surface resource zones. The near-surface nature of the mineralisation is a meaningful technical advantage, as it reduces the stripping ratios and infrastructure depth requirements that drive cost escalation in South Africa's ageing deep-shaft operations.
The combination of real structural supply constraints and continued or growing demand, alongside primary mine production that has been declining even as metal prices rise, tells investors something important about the inelasticity of supply and the difficulty of bringing new metal to market. (ValOre Metals CEO Nick Smart, as reported by Crux Investor)
Project Valuation: How Development Stage Drives Market Capitalisation
Among TSX-listed PGM developers, market capitalisation varies substantially based on the stage of project advancement rather than resource size alone. This divergence has direct implications for investors evaluating entry points in the development-stage PGM space. For instance, advancing toward a definitive feasibility study represents one of the most significant value-inflection milestones a project can achieve.
| Development Stage | Approximate Market Capitalisation Range |
|---|---|
| Mineral Resource (Inferred) | ~$27 million |
| Preliminary Economic Assessment (PEA) | ~$440 million |
| Definitive Feasibility Study (DFS) | ~$389 million |
The PEA stage represents a critical value inflection point because it is the first point at which a project's economics can be evaluated on a standardised, comparable basis. Projects sitting at the inferred resource stage with no economic study completed trade at a deep discount relative to PEA-stage peers, regardless of their underlying geological potential. Furthermore, as reported by Ecofina Agency, the South Africa platinum deficit is now extending into its fourth consecutive year, adding further urgency for investors to identify projects approaching economic study milestones.
Three Scenarios for the Platinum Market Through 2030
Scenario 1: Managed Decline (Base Case)
South African output contracts gradually toward approximately 3.5 million ounces by 2030. Brownfield projects deliver incremental supply from 2027 onward, partially offsetting mine closures and depletion. Annual deficits persist in the 300,000 to 500,000 ounce range. Above-ground inventories continue their decline, and the price floor strengthens progressively. The supply crisis remains structurally unresolved.
Scenario 2: Accelerated Disruption (Bear Case for Supply)
A major operational disruption, whether from an energy crisis, industrial action, or regulatory intervention, reduces South African output beyond projected levels. Annual deficits approach the WPIC's upper structural forecast of 700,000 ounces. Physical market stress intensifies sharply, lease rates spike, and backwardation deepens as buyers compete for available metal.
Scenario 3: Diversification Breakthrough (Bull Case for Supply)
One or more geographically diversified PGM projects outside South Africa advances through feasibility and attracts project financing within the decade. New supply from Brazil, North America, or Zimbabwe begins supplementing South African production before 2032. Annual deficits narrow as diversified supply enters the market, partially mitigating the systemic concentration risk that currently underpins the entire supply structure.
What Investors Should Monitor Over the Next Two Quarters
Several specific developments will test the frameworks outlined above and provide leading indicators of which scenario trajectory the market is entering:
- Whether Sibanye-Stillwater's South African brownfield projects maintain their March 2027 first production target schedules
- Whether any geographically diversified PGM projects outside South Africa publish preliminary economic assessments establishing comparable economic benchmarks for the first time
- Whether the WPIC's 2026 deficit forecast is revised further upward in subsequent quarterly publications
- Whether US Section 232 trade policy negotiations produce formal price floors or binding trade measures for platinum, palladium, and rhodium, which remains an unresolved variable with the potential to alter market dynamics materially
- Whether CME platinum inventory levels, which reached 624,000 ounces in recent reporting periods, continue to reflect active stockpiling behaviour in response to supply concentration concerns
Disclaimer: This article is provided for informational purposes only and does not constitute financial or investment advice. Forecasts, projections, and scenario analyses involve inherent uncertainty, and actual market outcomes may differ materially from those discussed. Readers should conduct their own due diligence and consult a qualified financial adviser before making investment decisions. Past performance of commodity markets is not indicative of future results.
Want to Stay Ahead of the Next Major Mineral Discovery?
Discovery Alert's proprietary Discovery IQ model instantly identifies significant ASX mineral announcements across 30-plus commodities — translating complex data into clear, actionable investment opportunities for both short-term traders and long-term investors. Explore historic discoveries and the returns they generated, then begin your 14-day free trial at Discovery Alert to position yourself ahead of the market.