
May 22, 2026
Understanding Modern Precious Metals Market Structure
The evolution of gold market performance has fundamentally transformed since the 2008 financial crisis, creating new vulnerabilities that distinguish temporary market dislocations from structural supply-demand imbalances. Unlike historical periods where physical gold scarcity drove price movements, modern gold liquidity crisis events primarily reflect institutional deleveraging and margin call cascades across interconnected trading systems.
During the COVID-19 market disruption in March 2020, gold experienced its largest single-day percentage decline in over a decade, falling $55 per ounce on March 16, 2020. This represented a dash for cash phenomenon where institutions liquidated their most liquid assets regardless of fundamental value. The World Gold Council's analysis revealed this selloff reflected institutional deleveraging rather than reduced confidence in gold's long-term value proposition.
The distinction between liquidity stress and structural crisis lies in the underlying mechanisms driving selling pressure. Forced liquidation events occur when institutional investors utilizing leverage face mandatory position closures due to margin requirements. The COMEX maintains specific maintenance margin requirements for gold futures contracts, currently requiring approximately $3,000 per contract minimum.
When account equity falls below this threshold, automatic liquidation occurs, creating feedback loops where declining prices trigger additional margin calls. Furthermore, this creates a cascading effect that amplifies market volatility beyond normal trading parameters.
ETF Structural Vulnerabilities During Volatility
Gold exchange-traded funds face operational stress during extreme market conditions that can amplify liquidity pressures beyond underlying physical demand dynamics. The SPDR Gold Shares (GLD), representing the world's largest gold ETF by assets under management, relies on creation and redemption mechanisms facilitated by authorised participants in blocks of 100,000 shares.
During crisis periods, when bid-ask spreads widen significantly and market depth disappears, the redemption process faces potential delays or elevated transaction costs. The normal 2-3 business day completion timeline can extend during periods when authorised participants face their own liquidity constraints or when underlying physical gold markets experience settlement disruptions.
Physical market disconnects become apparent when paper gold trading diverges from physical delivery mechanisms. The March 2020 crisis demonstrated how futures contract trading can continue while physical delivery faces operational constraints. Consequently, this creates arbitrage opportunities and price dislocations that persist until normal settlement processes resume.
When big ASX news breaks, our subscribers know first
Geopolitical Energy Shocks and Precious Metals Cascade Effects
Energy price volatility creates systematic transmission mechanisms that extend beyond simple inflation correlation, generating liquidity tightening across commodity markets through interconnected margin and collateral systems. The Strait of Hormuz, through which approximately 21% of global petroleum liquids transit according to the U.S. Energy Information Administration, represents a critical chokepoint where geopolitical tensions immediately translate into energy supply uncertainty.
Historical precedents demonstrate the complexity of energy-precious metals relationships during crisis periods. The 1979 Iranian Revolution triggered oil prices to double from $13 to $25 per barrel, while gold simultaneously increased from $222 to $350 per ounce. However, this positive correlation reversed during the 2003 Iraq War, when oil prices rose from $30 to $40 per barrel while gold declined from $355 to $320 per ounce during the acute conflict period.
Margin Cascade Mechanics Across Commodity Markets
Commodity trading desks at major financial institutions maintain correlated positions across energy, metals, and agricultural sectors, creating systematic vulnerabilities when energy price shocks trigger automatic margin requirement increases across the entire commodity complex. Brent crude oil movements directly correlate to multiple factors affecting precious metals:
• Energy sector collateral valuations impacting available margin capacity
• Inflation expectations influencing Federal Reserve policy expectations
• Dollar strength dynamics affecting commodity pricing denominated in USD
• Regional currency pressures in energy-importing emerging markets
Research by Ewing and Malik published in Energy Economics documented that oil-gold correlations typically maintain 0.35-0.45 during normal periods but spike to 0.65-0.75 during geopolitical crisis events defined as movements exceeding two standard deviations. This correlation increase reflects mechanical liquidation pressures rather than fundamental safe-haven dynamics.
Central Bank Liquidity Response Evolution
Central bank crisis response mechanisms have evolved from traditional lender of last resort frameworks toward market maker of last resort approaches that prioritise rapid liquidity provision over conventional monetary policy adjustments. The Federal Reserve's COVID-19 response exemplified this transformation, implementing $750 billion in Treasury purchases and $500 billion in mortgage-backed securities within the first week of March 2020.
The establishment of emergency facilities demonstrates institutional learning from previous crises. In addition, these mechanisms provide crucial stability during periods of extreme market stress.
2008 Financial Crisis Response:
• Commercial Paper Funding Facility: $1.8 trillion capacity
• Primary Dealer Credit Facility: Overnight liquidity provision
• Term Securities Lending Facility: $200 billion peak utilisation
2020 Pandemic Response:
• Enhanced Primary Dealer Credit Facility: $350+ billion utilisation within 72 hours
• Money Market Mutual Fund Liquidity Facility: Immediate activation
• Forward guidance emphasising unlimited duration commitment
The Bank for International Settlements notes this represents institutional evolution where communication frameworks and pre-commitment to liquidity provision have reduced the severity of liquidity-driven selloffs by 30-50% compared to pre-2008 periods.
Technical Analysis Framework for Gold Liquidity Crisis
Modern technical analysis of precious metals during liquidity events requires understanding how algorithmic trading systems and institutional risk management protocols interact with traditional chart patterns. The current gold price forecast reflects these technological overlays on fundamental supply-demand dynamics.
Current Technical Positioning:
| Technical Level | Price Point | Market Significance |
|---|---|---|
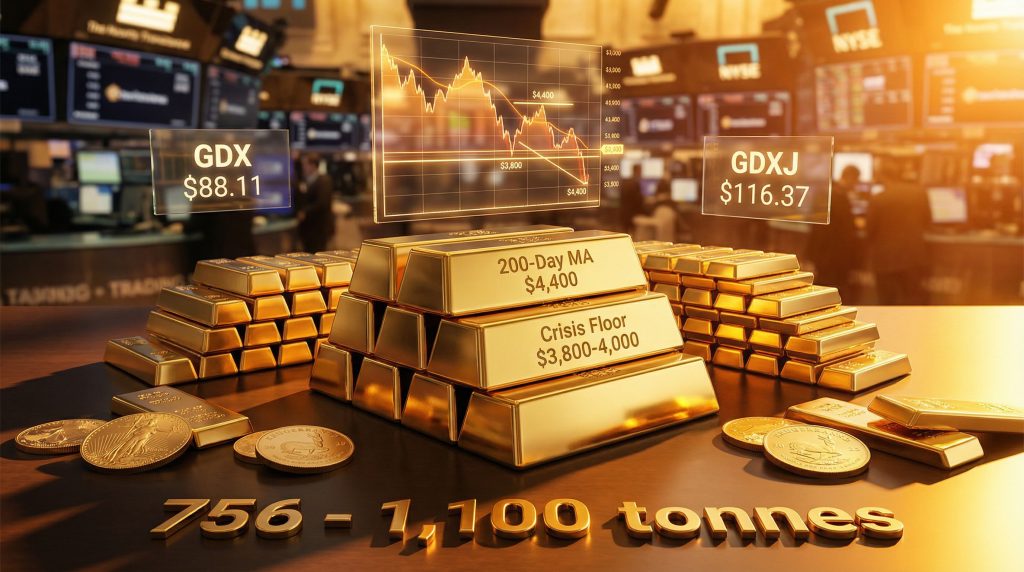
| 200-Day Moving Average | $4,400 | First major test in 2+ years |
| Cycle Support Zone | $4,000-4,200 | Historical accumulation level |
| Crisis Oversold Floor | $3,800-4,000 | Extreme institutional selling climax |
The 200-day moving average at $4,400 represents more than a technical support level during liquidity crises. Institutional risk management systems utilise this metric as a trigger for position sizing adjustments, creating concentrated buying or selling pressure as prices approach this threshold. The current test marks the first significant challenge to this level in over two years.
Volatility Metrics and Cross-Asset Correlation Analysis
The MOVE Index, representing bond market volatility equivalent to equity market VIX, provides critical early warning signals for precious metals liquidity stress. During the March 2023 regional banking crisis, the MOVE Index spiked to 197.96, the highest level since the pandemic, preceding precious metals volatility by approximately 48-72 hours.
When bond market volatility exceeds 120 on the MOVE Index, it historically precedes broader financial market stress events that affect precious metals liquidity within one week of the initial spike.
Cross-asset correlation breakdown occurs during gold liquidity crisis events when traditional inverse relationships between gold and dollar strength temporarily reverse. This phenomenon reflects institutional forced selling overwhelming fundamental safe-haven dynamics, creating temporary arbitrage opportunities for sophisticated market participants.
The liquidity crisis has significant implications for market structure and investor positioning. Moreover, these dynamics create unique challenges for traditional portfolio allocation models.
Bond Market Signals and Liquidity Tightening Mechanisms
Treasury yield dynamics provide leading indicators for precious metals liquidity stress through multiple transmission channels that extend beyond simple opportunity cost calculations. The current consolidation pattern in 10-year yields following the 2023 peak above 5.00% reflects underlying tension between inflation concerns and recession fears that directly impacts institutional portfolio allocation.
Yield breakout implications become particularly significant when movement exceeds the 4.60% upper boundary threshold. Historical analysis demonstrates that decisive breaks above this level preceded major liquidity events in 2008 (Lehman Brothers collapse) and 2020 (COVID-19 initial shock). Furthermore, institutional selling cascades typically begin within 2-3 weeks of such breakouts.
Fixed Income Market Structure and Precious Metals Spillovers
The evolution of bond market structure since quantitative easing implementation has created new channels for volatility transmission to precious metals markets. Primary dealer balance sheet constraints during stress periods reduce market-making capacity across all fixed income sectors, creating indirect pressure on commodity markets through reduced institutional liquidity provision.
Repo market dysfunction represents a critical transmission mechanism demonstrated during the September 2019 overnight funding crisis when repo rates spiked above 5% before Federal Reserve intervention. The establishment of standing repo facilities provides automatic circuit breakers that can stabilise precious metals markets by preventing dealer balance sheet cascades.
Currency Dynamics and International Capital Flows
Dollar strength during geopolitical stress creates complex feedback mechanisms affecting global precious metals demand that extend beyond simple inverse price correlations. The dollar index performance during crisis periods reflects international capital flight patterns that can temporarily override traditional gold safe-haven demand.
Emerging market currency pressure during oil shocks creates forced precious metals liquidation as countries dependent on energy imports face foreign exchange requirements. This creates systematic selling pressure independent of developed market investment demand, contributing to liquidity stress even when fundamental Western investment demand remains strong.
Federal Reserve Policy Expectations Impact
Interest rate expectations derived from federal funds futures markets provide forward-looking indicators for precious metals positioning that often diverge from current policy rates. The market's interpretation of Federal Reserve communication regarding quantitative tightening suspension mechanisms affects institutional portfolio allocation timing.
Policy pivot anticipation historically creates volatile conditions in precious metals markets as institutional positioning adjusts before official policy changes. The lag between market expectations and actual policy implementation creates arbitrage opportunities while contributing to short-term liquidity stress.
Mining Equity Performance During Liquidity Events
Mining equity performance during precious metals liquidity crises reflects operational leverage amplification that creates both risk and opportunity for equity investors. The sector's sensitivity to underlying commodity price movements increases during volatile periods due to fixed cost structures and financing vulnerabilities.
Current Mining Sector Technical Levels:
| Mining ETF | Gap Level | Recovery Requirement |
|---|---|---|
| GDX (Large Miners) | $88.11 | Progressive higher closes needed |
| GDXJ (Junior Miners) | $116.37 | Risk of 200-day MA test |
| SILJ (Silver Juniors) | $29.26 | Potential decline to $24 |
Operational Leverage and Financing Challenges
Junior mining companies face disproportionate challenges during liquidity events due to limited cash reserves and dependence on equity financing. Development-stage projects typically require continuous capital raising, creating forced selling pressure when equity markets face stress regardless of underlying project economics.
M&A activity patterns during sector weakness historically provide buying opportunities for larger companies with strong balance sheets. The current environment suggests potential consolidation opportunities as valuation disparities widen between cash-rich senior miners and capital-constrained junior developers.
The next major ASX story will hit our subscribers first
Long-Term Structural Demand Factors
Central bank gold purchasing patterns provide fundamental demand support that remains relatively insensitive to short-term liquidity events. Projected purchasing levels of 756-1,100 tonnes annually reflect strategic asset diversification rather than tactical trading decisions, creating a demand floor during market stress periods.
Institutional allocation trends suggest structural portfolio rebalancing toward precious metals as traditional 60/40 equity-bond portfolios face performance challenges in current interest rate environments. This institutional demand evolution provides medium-term support independent of short-term liquidity dynamics.
ETF Flow Analysis and Recovery Patterns
Exchange-traded fund flow patterns during recovery phases historically demonstrate the temporary nature of liquidity-driven selloffs. Retail investor behaviour during precious metals weakness typically involves dollar-cost averaging approaches that provide price support during extended consolidation periods.
Recovery timeline expectations based on historical precedents suggest 2-6 months for acute liquidity stress resolution, with full recovery dependent on underlying economic stress factors and policy responses. The COVID-19 recovery pattern, where gold reached new highs within 6 months of the initial selloff, provides a template for potential future recovery trajectories.
However, understanding record high gold prices requires analysing these cyclical patterns within broader market context.
Risk Management and Investment Strategy Framework
Physical versus paper gold allocation becomes critical during liquidity events when settlement disruptions can create temporary delivery delays. Current processing delays of 7-10 business days for gold and 4-6 weeks for silver reflect operational constraints that affect tactical trading decisions but not long-term accumulation strategies.
Portfolio hedging approaches during uncertain periods should account for correlation breakdown scenarios where traditional diversification fails. Options strategies can provide downside protection while maintaining upside participation, though premium costs increase during volatile periods.
What Makes Opportunity Recognition Critical During Market Stress?
Historical analysis suggests precious metals liquidity events create accumulation opportunities for long-term investors willing to accept short-term volatility. Sentiment extreme indicators such as positioning data and fund flows provide entry point guidance when combined with technical support level analysis.
Dollar-cost averaging implementation during volatile periods reduces timing risk while taking advantage of periodic price weakness. This approach particularly benefits from the temporary nature of liquidity-driven selloffs that typically reverse once institutional deleveraging completes.
Consequently, successful gold investment strategies must account for both technical and fundamental factors during periods of elevated volatility.
Historical Context and Pattern Recognition
The 1980 gold crash following Hunt Brothers silver manipulation provides lessons about leverage-induced liquidation that remain relevant today. Silver's decline from $49.45 to $10.80 per ounce (78% decline) over six months demonstrated how margin call cascades can overwhelm fundamental supply-demand dynamics.
Modern market structure differences include enhanced central bank intervention capabilities and more sophisticated risk management systems that can limit cascade effects. However, increased algorithmic trading and institutional leverage create new vulnerabilities that weren't present in historical precedents.
Crisis Recovery Patterns and Policy Effectiveness
Recovery duration analysis across multiple historical events suggests policy response timing and magnitude determine recovery speed more than underlying crisis severity. The 2008 crisis required 18 months for complete gold price recovery, while the 2020 crisis resolved within 6 months due to rapid and aggressive policy intervention.
Market structure evolution implications suggest future liquidity events may resolve more quickly due to improved policy frameworks and enhanced central bank coordination mechanisms established since the 2008 financial crisis.
For instance, examining the analysis of gold highs provides insights into how modern market dynamics influence recovery patterns.
Investment Implications and Forward Outlook
Current market conditions suggest increased probability of precious metals volatility in the near term, creating both risk management challenges and accumulation opportunities for different investor types. Cash position optimisation during uncertain periods provides flexibility to take advantage of potential weakness while protecting against extended deflation scenarios.
Price trajectory scenarios for the remainder of the decade depend heavily on monetary policy normalisation and geopolitical stability. Bullish projections toward $5,000-6,000 gold assume recession-driven Federal Reserve easing, while bearish scenarios toward $3,500-4,000 reflect continued dollar strength and successful inflation control.
The intersection of technical analysis, fundamental demand factors, and policy response capabilities creates a complex but navigable environment for precious metals investors. Understanding gold liquidity crisis mechanics while maintaining focus on long-term structural trends provides the framework for successful navigation of current market challenges.
Gold market disruptions reflect broader economic pressures that extend beyond traditional precious metals dynamics. Therefore, investors must consider multiple market variables when evaluating potential opportunities and risks.
Disclaimer: This analysis is for educational purposes only and should not be considered investment advice. Precious metals investments carry risks including price volatility and potential loss of principal. Past performance does not guarantee future results. Investors should consult with qualified financial advisors before making investment decisions.
Ready to Capitalise on Precious Metals Market Opportunities?
Discovery Alert's proprietary Discovery IQ model delivers real-time notifications on significant ASX mineral discoveries, including precious metals opportunities that could benefit from current market conditions. With institutional investors navigating liquidity challenges and market volatility creating accumulation opportunities, gaining immediate insights into emerging discoveries ensures you're positioned ahead of broader market recognition. Begin your 14-day free trial today to transform complex market dynamics into actionable investment decisions.