July 24, 2026
The Market Cycle Logic That Most Precious Metals Investors Miss
Understanding precious metals markets requires a counterintuitive starting point: the most structurally bullish periods for gold and silver often feel the worst to live through. Capital rotates. Momentum stalls. Headlines turn negative. Investors who anchor their decisions to short-term price action rather than long-cycle structural forces routinely exit positions at the worst possible moments, precisely when the foundational thesis is most intact.
This is the analytical context that frames precious metals projections in May 2026. Not a story about one metal or one forecast, but a comprehensive reckoning with where we are in the cycle, what the technical architecture is telling us, and where capital is actually flowing right now versus where it is likely to flow next.
When big ASX news breaks, our subscribers know first
Where Gold and Silver Actually Stand Heading Into May 2026
Following one of the most explosive multi-month rallies in modern precious metals history, gold and silver entered a technical correction phase as April 2026 drew to a close. Gold breached $4,500/oz earlier in the year before rolling over, while silver delivered extraordinary gains of approximately 148% through 2025, establishing a dramatically higher base from which current projections are calculated.
The central analytical question for investors right now is not whether prices have fallen. They have. The question is whether this constitutes a structural trend reversal or a time-based consolidation within an intact long-cycle bull market. Historical precedent across commodity super-cycles consistently shows that parabolic advances resolve through time and volatility, not necessarily through catastrophic price destruction.
As technical analyst Christopher Muan of The Technical Traders noted in early May 2026, the precious metals market has entered a phase where the excitement of the prior advance has concluded, and the chart needs time to heal, stabilise, and construct a new launch pad. The comparison he draws to prior consolidation phases, specifically the 2015–2016 trough and the 2020–2022 sideways grind, is instructive: both of those periods felt discouraging in real time and both preceded explosive advances.
A key principle from technical cycle analysis: the longer a high-quality asset consolidates in a tight range following a parabolic advance, the more energetically compressed the subsequent breakout tends to be. Investors who understand this dynamic seek to accumulate during the consolidation, not abandon their positions because of it.
The Macro Architecture Supporting the Long-Term Case
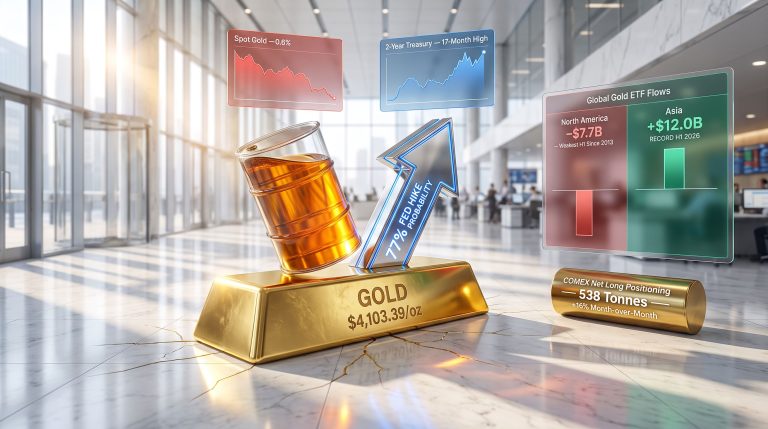
Structural demand drivers for precious metals have not weakened during the current correction. Central bank demand has continued at a pace that represents a fundamental shift in gold's price discovery mechanism. Combined central bank and ETF demand running at approximately 585 tonnes per quarter creates a demand floor that simply did not exist in previous decades.
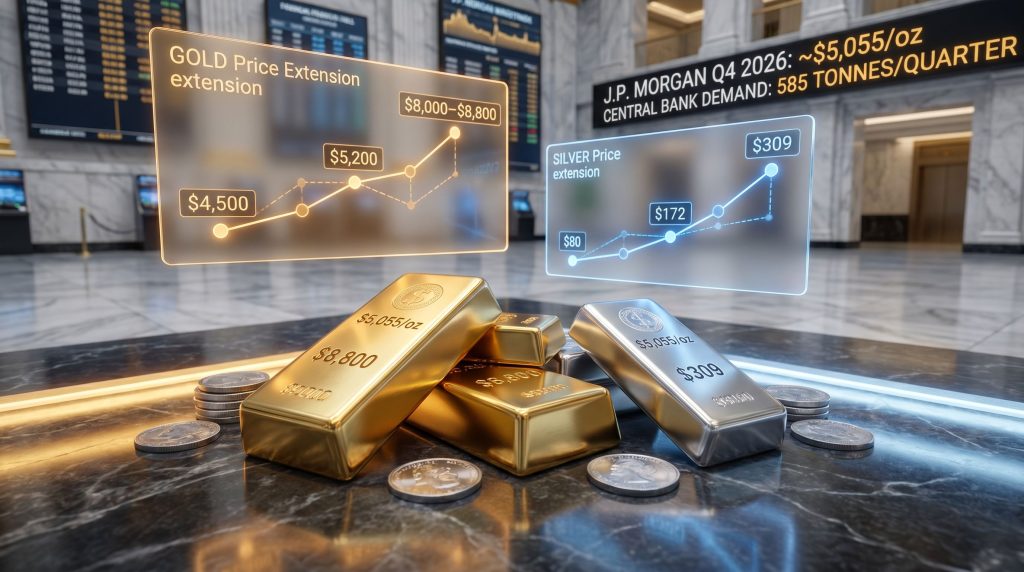
J.P. Morgan's commodities research projects gold averaging approximately $5,055/oz through Q4 2026, a forecast underpinned by persistent institutional and sovereign accumulation rather than speculative retail flows. The fiscal expansion trajectories across major economies, combined with sovereign debt levels that make genuine monetary tightening politically difficult over multi-year horizons, remain the foundational tailwinds.
The Federal Reserve leadership transition occurring in May 2026 introduces an additional layer of monetary policy uncertainty, a historically favourable environment for hard asset allocation. When investors cannot reliably model the path of interest rates and dollar policy, gold's role as a non-correlated store of value becomes more pronounced.
Precious Metals Price Projections in May 2026: The Full Forecast Landscape
Gold Price Targets: $4,060 to $5,200 Per Ounce
The consensus range for gold across institutional research and commodities analysis for May 2026 spans a wide but revealing band:
| Forecasting Source | Gold Forecast Range (USD/oz) |
|---|---|
| AI Consensus Range (Multiple Models) | $4,060 – $5,200 |
| Gemini Analysis | $4,350 – $4,700 |
| Perplexity / Meta AI / CoPilot | $4,350 – $5,050 |
| J.P. Morgan Q4 2026 Average | ~$5,055 |
| BullionVault / LBMA Consensus | $4,300 – $4,700 |
The current corrective phase has drawn gold back toward the $4,500/oz level, which represents the approximate position of the 150-day moving average and a technically critical support zone. A deeper retracement, which technical analysis suggests is plausible, targets the $3,500–$3,600/oz zone, the original breakout point where the prior euphoric advance began.
On the upside, a confirmed close above $4,900–$5,000/oz would technically signal the resumption of the primary bull trend, opening a pathway toward the long-cycle Fibonacci extension target of $8,500–$8,800/oz. Furthermore, the gold market outlook for the broader cycle continues to support a structurally bullish position for patient, long-term investors.
Disclaimer: Price forecasts represent analytical projections based on technical and fundamental methodologies. They are not guarantees of future performance. All investment decisions carry risk, and investors should conduct independent due diligence before making any capital allocation decisions.
Silver's Extraordinary Range: $40 Stress Scenario to $309 Upside Case
Silver presents one of the widest forecast distributions of any major commodity in May 2026, reflecting both its dual industrial-monetary demand profile and its historically amplified volatility relative to gold.
| Scenario | Silver Price Target | Key Driver |
|---|---|---|
| Technical Stress Case | ~$40/oz | Broad asset liquidation, USD strength, mass deleveraging |
| Base Case (LBMA/BullionVault) | ~$80/oz | Continued industrial and investment demand |
| Bank of America Base Case | Up to $150/oz | Ongoing supply deficit, industrial acceleration |
| Bank of America Stress Upside | Up to $309/oz | Gold-silver ratio compression, deficit escalation |
The structural underpinning for silver's upside case is its estimated 67 million ounce annual supply deficit, a figure that compounds over time as industrial applications expand. Silver supply deficits are further deepened by energy transition infrastructure, AI hardware manufacturing requiring silver-intensive components, and traditional electronics demand, collectively differentiating silver's demand profile from gold in ways that support higher long-term price floors.
Technical analysis from Christopher Muan identifies two scenarios for silver's next major move. If the metal has already established its correction low, the primary upside target sits near $172/oz. If a broader asset liquidation event forces a flush toward $40/oz, driven by a strengthening US dollar and mass portfolio deleveraging, the subsequent recovery target adjusts to approximately $151/oz. Both outcomes represent significant long-term upside from current levels.
Platinum and Palladium: The Overlooked Metals
| Metal | May 2026 Forecast Range | LBMA End-2026 Target |
|---|---|---|
| Platinum | $1,415 – $2,075/oz | $2,222/oz |
| Palladium | Recovering from multi-year lows | ~$1,739/oz |
Platinum recorded fresh record highs in early 2026, driven by inflationary repricing and supply concentration risks. Palladium's recovery trajectory remains geopolitically sensitive given the primary geographic concentration of global mine supply, making it one of the precious metals most exposed to geopolitical risk scenarios.
Technical Analysis Framework for May 2026
Why Monthly Charts Reveal What Daily Charts Hide
One of the most important analytical insights from the May 2026 technical review is the critical distinction between what short-term charts are showing and what the monthly chart structure reveals. Monthly candlestick analysis filters out the noise that distorts daily and weekly decision-making, providing a clearer picture of where the structural trend actually sits.
On the monthly chart, gold's structure shows a classic post-parabolic consolidation, a pattern that has appeared repeatedly in commodity cycle history and that has consistently preceded the next major impulsive advance. The trend itself remains intact on this timeframe. The short-term daily chart, however, is telling a different story: moving averages stacked bearishly, with the 50-day declining, the 20-day below it, and the 5-day below that, with price trading beneath all of them.
This divergence between timeframes is not contradictory. It is exactly how long-cycle bull markets operate. The secular structure remains bullish while the intermediate correction runs its course.
The 150-Day Moving Average: Gold's Current Battleground
Rather than relying exclusively on the widely watched 200-day moving average, technical analysis of the current gold market places particular emphasis on the 150-day moving average, which responds to price changes slightly faster while still filtering out short-term noise.
As of late April 2026, this indicator sits at approximately $4,500/oz, and gold has returned to test it after a prior successful test and bounce roughly one month earlier. Christopher Muan identifies this zone not as a precise line but as a support range requiring significant room for price to breathe around it.
The moving average interpretation framework applied to current conditions:
| Moving Average Condition | Market Environment Signal |
|---|---|
| Sloping upward, price consistently above | Confirmed bullish trend environment |
| Sloping downward, price consistently below | Confirmed bearish trend environment |
| Upward-sloping MA, price retesting from above | Critical support test defining next directional move |
| Bearishly stacked short-term MAs (20/50-day) | Short-term downtrend confirmed despite long-term structure |
The current configuration, where the long-term 150-day MA remains upward-sloping while shorter-term averages are stacked bearishly, confirms that gold is in an intermediate correction within a primary bull market. This is precisely the setup that rewards patient accumulation strategies over reactive selling.
Bull Flag or Distribution Top: The $3,500 Question
Two competing technical interpretations exist for gold's current price structure, and the outcome carries dramatically different implications for investment strategy:
-
Bull flag scenario: Gold consolidates in a tight range near current levels for weeks to months, then breaks higher, targeting $8,500–$8,800/oz on the next impulsive advance. This is the more constructive scenario because it preserves momentum and compresses the recovery timeline.
-
Distribution top with deeper retracement: Gold drifts toward $3,500–$3,600/oz over the next three to six months before establishing a new base. This scenario would still represent a historically significant entry opportunity but would extend the timeline to new highs considerably and result in a somewhat lower long-cycle target of approximately $8,000/oz.
Muan is explicit about what investors should hope for: a tight bull flag pattern, because the tighter the consolidation, the more explosive and directional the subsequent breakout. A deeper retracement would technically resolve the move, but it would reduce the momentum driving the next advance.
A critical precedent that reinforces the bull case: gold fell approximately $1,000 in March 2026 when the yield curve shifted upward by 50 basis points, the US dollar rallied three points, and Turkey reportedly dumped 100 metric tons of gold. Despite this multi-factor headwind, price briefly violated the 200-day moving average and then immediately recovered sharply, a signal of underlying demand strength that should not be overlooked.
Capital Flows in May 2026: Where the Money Is Actually Going
The Equity Rally and Its Implications for Metals Investors
The single most important near-term dynamic for understanding precious metals projections in May 2026 is the capital rotation context. Technical money flow analysis confirms that institutional and retail capital is currently moving away from precious metals and into equities, particularly technology and semiconductor sectors.
The NASDAQ has delivered approximately 10% gains from its April correction entry point, with Fibonacci extension analysis projecting a potential run toward ~32,800, representing approximately a 20% advance from the correction low. The S&P 500's equivalent Fibonacci extension target sits near ~8,500, also roughly a 20% move.
The sector rotation hierarchy in May 2026 reflects a clear risk-appetite environment:
| Asset Class / Sector | Technical Status | Investor Signal |
|---|---|---|
| Semiconductors | +41% from recent lows | Dominant momentum sector |
| Large Cap Technology | Strong trend, positive money flows | Long bias confirmed |
| Small and Micro Cap Equities | Emerging participation | Early rotation phase |
| Bitcoin / Blockchain | Bullish structure intact | Active speculative allocation |
| Clean Energy / Lithium | Recovering, trend improving | Building watchlist position |
| Gold | Short-term downtrend, long-term bull intact | Accumulate on confirmed weakness |
| Silver | Volatile, awaiting base formation | Strategic accumulation zone |
| Gold Miners (GDX) | Trendless, base-building potential | Patience required before entry |
The AI-driven semiconductor resurgence deserves specific attention as a contextual factor. Equipment manufacturers supplying the physical infrastructure for AI computation, particularly semiconductor companies, are being repriced as essential infrastructure rather than cyclical technology. This capital concentration in semiconductors is drawing institutional flows that might otherwise participate in a precious metals rally.
Strategic note for portfolio construction: holding long-term precious metals conviction while acknowledging that near-term capital efficiency currently favours equities is not a contradiction. These positions serve different roles in a portfolio and operate on different time horizons. Forcing a binary choice between them reflects timing anxiety rather than strategic thinking.
Why This Rotation Is Temporary and What Reverses It
Precious metals corrections following parabolic advances are a recurring and predictable feature of long-cycle bull markets. The 2015–2016 trough appeared devastating to participants living through it. The 2020–2022 sideways consolidation generated widespread frustration. Both episodes, in retrospect, were optimal accumulation windows.
The fundamental forces that drove the prior advance have not weakened. If anything, they are strengthening. A demand-driven global recession scenario, should it materialise, would likely trigger an aggressive central bank monetary response. The Federal Reserve's balance sheet expanded by approximately $3 trillion during the acute phase of the 2020 pandemic response, and the policy tools available for the next major liquidity crisis are no smaller. Such a response would be powerfully bullish for gold and silver.
The factors that could invalidate the bull case over a multi-year horizon include:
- A sustained, meaningful reduction in central bank gold purchasing programmes
- An aggressive Fed tightening cycle driving a prolonged US dollar rally
- Rapid de-escalation of geopolitical tensions removing the safe-haven premium
- Extended equity market strength continuing to absorb capital that would otherwise rotate into metals
None of these scenarios can be ruled out entirely, which is why risk management frameworks remain essential even within a structurally bullish investment thesis.
Long-Cycle Price Targets: The Path to $8,000–$8,800
Gold's Super-Cycle Architecture
Long-cycle Fibonacci analysis anchored to the 2015–2016 structural low projects a full-cycle gold target in the $8,000–$8,800/oz range, with the specific outcome dependent on the depth and duration of the current consolidation. In addition, reviewing the gold-silver ratio analysis provides important context for understanding how each metal is likely to perform relative to the other throughout this cycle.
| Pathway | Near-Term Behaviour | Long-Cycle Target |
|---|---|---|
| Tight Bull Flag | Consolidates near current levels, breaks higher within weeks to months | ~$8,800/oz |
| Deep Retracement to Support | Pulls back to $3,500–$3,600/oz over three to six months | ~$8,000/oz |
The distinction between these outcomes is not just the final price level. The bull flag pathway would produce a more rapid, momentum-driven advance that creates a dramatically different investment experience than a slow recovery from a deeper low. For investors thinking about optimal positioning, this distinction matters enormously for position sizing and entry timing.
Silver's Long-Cycle Upside
Silver's long-cycle targets present an asymmetric risk-reward profile that is difficult to replicate elsewhere in financial markets:
- If the correction low is already in place: primary technical target near $172/oz
- If a broader liquidation flush to $40/oz occurs: subsequent recovery target near $151/oz
- Bank of America's stress scenario projects silver as high as $309/oz under conditions of accelerating supply deficit and gold-silver ratio compression
The gold-silver ratio, which measures how many ounces of silver are required to purchase one ounce of gold, historically compresses during strong precious metals bull cycles as silver outperforms gold on a percentage basis. According to Kitco's analysis, if this compression plays out against a $5,000+ gold price, the implied silver price targets become significantly larger than most mainstream forecasts suggest.
The next major ASX story will hit our subscribers first
Strategic Positioning: How to Navigate the May 2026 Environment
The Accumulation Framework for Long-Term Holders
The most practically useful insight from the technical analysis of May 2026 conditions is the identification of specific price zones that represent high-value accumulation opportunities for long-term investors:
- Gold: $3,500–$3,600/oz represents deep structural support and the original breakout point; the $4,500/oz zone is the current 150-day moving average test
- Silver: $70–$75/oz represents the current corrective range; $40/oz represents the stress-scenario flush target for investors who want to define worst-case accumulation zones
Dollar-cost averaging into physical gold and silver during technically weak periods aligns with the long-cycle bull thesis and removes the psychological burden of trying to identify the precise bottom of the correction.
Attempting to time the exact bottom of a precious metals correction has historically cost investors more in missed upside than any savings achieved by waiting for the perfect entry. The more productive strategic framework involves defining a target allocation, establishing accumulation price zones in advance, and executing systematically regardless of short-term noise.
Mining Equities: Patience Before Leverage
Gold and mining equities currently occupy the most technically ambiguous position in the precious metals complex. Muan's characterisation of miners as sitting in territory where the priority is to let the sector unfold and build a launch pad, rather than aggressively adding exposure, reflects sound cycle management.
Mining equities offer leveraged exposure to the eventual metals recovery because their profitability expands non-linearly as metal prices rise above operating cost levels. However, that leverage cuts both ways during corrections. The appropriate strategy is to monitor for a confirmed new uptrend in the monthly chart structure before committing significant position size, rather than attempting to bottom-fish a sector that remains technically trendless.
Frequently Asked Questions: Precious Metals Projections in May 2026
What is the gold price forecast for May 2026?
Consensus forecasts from institutional research and commodities analysts place gold in the $4,060–$5,200/oz range for May 2026. J.P. Morgan's full-year 2026 average projection sits near $5,055/oz for Q4. The current corrective phase has drawn prices back toward the $4,500/oz technical support zone, which represents a critical near-term test of the 150-day moving average.
Is silver a buy in May 2026?
Silver presents a high-risk, high-reward profile in May 2026. The base case from LBMA and BullionVault research projects prices above $80/oz, with Bank of America's stress scenario reaching $309/oz by end-2026. However, a broad market liquidation event could temporarily push silver toward $40/oz before the next major advance. Long-term investors with multi-year horizons may view current levels as a strategic accumulation opportunity, while short-term traders face a technically trendless environment.
Why are precious metals falling while equities are rising?
Capital rotation is a normal feature of market cycles. When equity markets enter strong trending phases, particularly in high-momentum sectors like technology and semiconductors, institutional and retail capital tends to rotate out of defensive and commodity assets including gold and silver. This dynamic is consistent with historical patterns from previous precious metals consolidation phases and does not alter the long-term structural bull case.
What is the long-term gold price target?
Long-cycle Fibonacci analysis anchored to the 2015–2016 structural low projects a full-cycle gold target of $8,000–$8,800/oz, depending on the depth and duration of the current consolidation. The tighter the current consolidation pattern, the higher and faster the projected breakout advance toward $8,800/oz. A deeper retracement toward $3,500/oz would shift the target slightly lower, toward $8,000/oz.
What is the $4,500 gold level and why does it matter?
The $4,500/oz level represents the approximate position of gold's 150-day moving average in late April and early May 2026. Gold successfully tested this level approximately one month prior, staged a sharp recovery, and is now retesting it. How price behaves at this zone will provide important signals about whether the current correction is nearing exhaustion or has further downside toward the $3,500–$3,600/oz zone to resolve.
Precious Metals Projections Summary: May 2026 Data Table
| Metric | Key Data Point |
|---|---|
| Gold May 2026 Forecast Range | $4,060 – $5,200/oz |
| Gold Long-Cycle Target (Bull Flag) | ~$8,800/oz |
| Gold Long-Cycle Target (Deep Retracement) | ~$8,000/oz |
| Gold Key Support Zone | $3,500 – $3,600/oz |
| Gold 150-Day Moving Average | ~$4,500/oz |
| Gold Breakout Confirmation Level | $4,900 – $5,000/oz |
| Silver Base Case (LBMA/BullionVault) | ~$80/oz |
| Silver Stress Upside Case (Bank of America) | Up to $309/oz |
| Silver Deep Support (Stress Scenario) | ~$40/oz |
| Silver Long-Cycle Target (From Current Base) | $172/oz |
| Silver Long-Cycle Target (From $40 Low) | $151/oz |
| Platinum End-2026 Target (LBMA) | $2,222/oz |
| Palladium End-2026 Target (LBMA) | ~$1,739/oz |
| Central Bank and ETF Quarterly Demand | ~585 tonnes/quarter |
| J.P. Morgan Q4 2026 Gold Average | ~$5,055/oz |
| Silver Annual Supply Deficit Estimate | ~67 million oz |
| Silver 2025 Cumulative Performance | ~148% |
This article presents technical and fundamental analysis for informational purposes only. It does not constitute financial advice. Precious metals markets are volatile and forward-looking price projections involve significant uncertainty. Past performance of any asset class does not guarantee future results. All investment decisions should be made in consultation with a licensed financial adviser and based on individual risk tolerance and financial circumstances.
Want to Capitalise on the Next Major Mineral Discovery Before the Broader Market Catches On?
While long-cycle precious metals analysis reveals where patient capital should be positioned, Discovery Alert's proprietary Discovery IQ model ensures subscribers receive real-time notifications the moment significant ASX mineral discoveries are announced — turning complex data across 30-plus commodities into clear, actionable opportunities for both traders and long-term investors. Explore how historic discoveries have generated extraordinary returns on Discovery Alert's dedicated discoveries page, and begin your 14-day free trial today to secure a genuine market-leading edge.