May 19, 2026
What Makes Precious Metals Different from Traditional Asset Classes?
The fundamental mechanics governing precious metals operate on entirely different principles than conventional securities markets. While equity analysts debate earnings multiples and bond traders focus on yield curves, precious metals respond to forces that traditional financial models cannot capture or quantify effectively. Protection against currency debasement and financial system stress requires understanding these unique characteristics that set monetary assets apart from conventional investments.
The Fundamental Distinction Between Monetary Assets and Financial Securities
Traditional investment valuation relies on predictable income streams, management competency, and terminal value calculations. Corporate stocks generate dividends, bonds provide coupons, and real estate produces rental income. These assets derive value from their ability to produce cash flows that can be discounted to present value using established financial formulas.
Precious metals function as monetary assets rather than income-generating securities. Gold produces no earnings statements, silver issues no quarterly guidance, and platinum generates no cash flow projections. Instead, these metals serve as stores of purchasing power that respond to macroeconomic conditions, monetary policy changes, and systemic confidence levels.
| Characteristic | Stocks/Bonds | Precious Metals |
|---|---|---|
| Earnings/Coupon | Yes | No |
| Terminal Value | Yes | No |
| Valuation Models | DCF, P/E Ratios | Real Rates, Confidence Metrics |
| Supply Response | Elastic (new issuance) | Inelastic (mining constraints) |
| Counterparty Risk | Yes (issuer default) | Minimal (physical) |
| Monetary Properties | No | Yes |
This distinction becomes critical during periods of financial stress. When corporate earnings collapse and bond issuers face default risk, precious metals often appreciate because they lack counterparty exposure. Furthermore, they maintain intrinsic value independent of institutional performance.
Historical Performance During Currency Devaluation Events
Historical analysis reveals consistent patterns of precious metals performance during major currency crises. During Germany's Weimar Republic hyperinflation of 1923, the German mark collapsed from approximately 4.2 marks per US dollar in January to 4.2 trillion marks per dollar by November. Citizens who held physical gold maintained purchasing power while mark-denominated financial assets became worthless.
Zimbabwe's currency devaluation between 2000-2009 demonstrated similar dynamics. The Zimbabwean dollar depreciated by over 99.9% against the US dollar during this period. Local residents who possessed physical gold and silver preserved wealth while bank deposits and government bonds denominated in local currency lost virtually all value.
Venezuela's ongoing currency crisis since 2013 provides a contemporary example. The Venezuelan bolívar has depreciated approximately 99.9% since crisis onset. Gold market performance in local currency terms increased dramatically, serving as essential protection against currency debasement for those with access to precious metals markets.
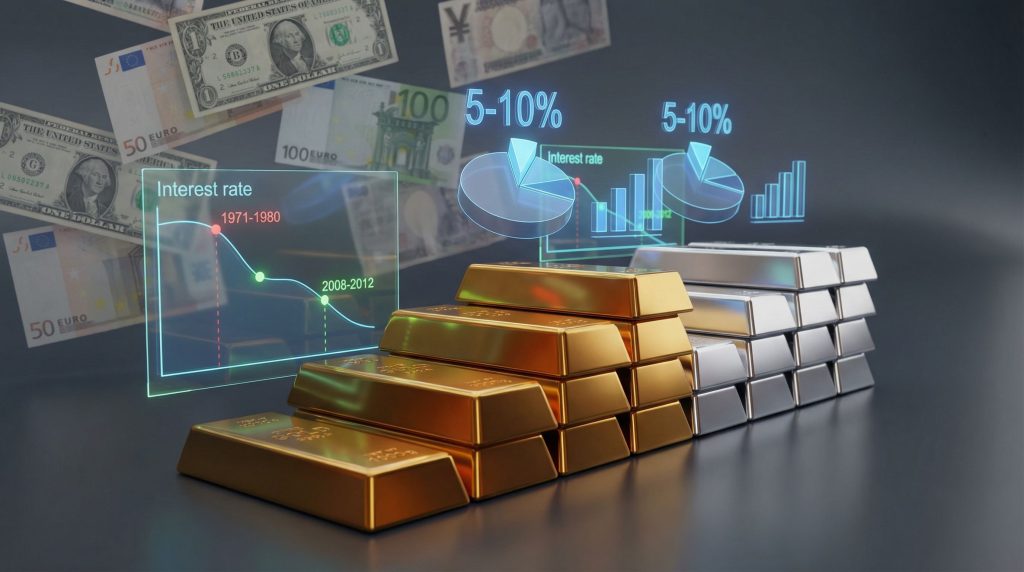
During the 1970s stagflation period (1971-1980), gold appreciated from the fixed Bretton Woods price of $35 per troy ounce to $850 by January 1980. This represented a 2,328% increase over the decade, while real interest rates averaged -2% to -4% annually. Consequently, this created negative opportunity costs for holding non-yielding monetary assets.
Key Performance Data:
• 2008-2012 Financial Crisis Recovery: Gold increased from $869.75 per ounce (January 2008) to $1,664.58 (January 2012), a 91.4% gain
• 2020-2024 Monetary Expansion: Gold rose from $1,770.30 per ounce (January 2020) to approximately $2,680, a 51.4% increase
• Banking Crisis Response (2023): Gold rallied 3.8% in the 30 days following Silicon Valley Bank's collapse
• Geopolitical Stress (2022): Following Russia's invasion of Ukraine, gold rallied from $1,865 to $1,973 (+5.8%) within two weeks
When big ASX news breaks, our subscribers know first
How Do Macroeconomic Shocks Drive Precious Metals Repricing?
Modern precious metals markets demonstrate extreme sensitivity to discrete policy announcements and geopolitical developments rather than gradual economic deterioration. Research indicates that 70-80% of major precious metals price movements occur in response to specific policy shocks or crisis events. In addition, these movements happen rather than following predictable economic cycles.
Policy-Driven Market Disruptions That Trigger Metal Rallies
Emergency monetary stimulus programs create immediate repricing pressures in precious metals markets. During the 2008 financial crisis, the Federal Reserve's balance sheet expanded from $884 billion in August 2008 to $2.29 trillion by December 2008. This represented a 159% increase in four months, while gold increased 25% in the 12 months following crisis onset as real interest rates collapsed.
The 2020 COVID-19 pandemic response triggered even more dramatic policy interventions. The Federal Reserve implemented multiple emergency facilities simultaneously:
• Primary Dealer Credit Facility (PDCF)
• Commercial Paper Funding Facility (CPFF)
• Money Market Mutual Fund Liquidity Facility (MMLF)
• Primary Market Corporate Credit Facility (PMCCF)
• Secondary Market Corporate Credit Facility (SMCCF)
The Federal Reserve's balance sheet expanded from $4.2 trillion in February 2020 to $7.4 trillion by June 2020. Subsequently, gold as an inflation hedge appreciated 24.6% during this six-month period as real yields turned deeply negative.
Banking sector stress indicators provide early warning signals for precious metals rallies. The 2023 regional banking crisis demonstrated these dynamics when Silicon Valley Bank's collapse ($209 billion in assets seized) and First Republic Bank's failure ($213 billion in assets) triggered immediate precious metals appreciation. However, gold reached all-time highs above $2,080 within weeks of the banking stress escalation.
The Unpredictability Factor in Precious Metals Markets
Traditional economic forecasting models demonstrate limited predictive power for precious metals prices during crisis periods. Statistical analysis shows that standard macroeconomic models explain less than 30% of crisis-period metal price variance. In contrast, these models explain 60-80% variance for equity markets during normal conditions.
Bank for International Settlements research demonstrates that gold's correlation with equity markets inverts during financial crises. Normal market conditions show gold-to-equity correlation of approximately -0.15 to +0.10 (weak negative or near-zero). However, crisis periods demonstrate correlation of -0.40 to -0.70 (strongly negative). This indicates precious metals provide diversification precisely when traditional portfolio diversification fails.
The March 2020 "dash for cash" episode illustrates the complexity of crisis-period metal behaviour. Gold initially declined 5% as leveraged institutional investors liquidated all liquid assets for cash requirements. Nevertheless, following Federal Reserve policy announcements, gold rallied 16.3% between March 16 and April 15, 2020. The historic gold surge explained ultimately led to all-time highs above $1,800 by June.
Geopolitical Risk Transmission Mechanisms:
• Sanctions Regimes: Russia-Ukraine conflict sanctions triggered palladium price surges of 40%+ due to Russian supply concerns (Russia produces approximately 40% of global palladium)
• Trade Route Disruptions: Nickel market dysfunction during the conflict caused 250% single-day price increases, forcing London Metal Exchange trading halts
• Currency War Scenarios: Competitive devaluation policies among major economies typically drive 5-15% precious metals appreciation within 1-3 months
What Role Do Real Interest Rates Play in Precious Metals Valuation?
Real interest rates, calculated as nominal yields minus inflation expectations, represent the primary valuation framework for precious metals. This relationship exists because real rates determine the opportunity cost of holding non-yielding monetary assets relative to income-generating alternatives.
Understanding the Opportunity Cost Framework
The inverse relationship between real yields and gold prices demonstrates mathematical consistency across multiple decades. Research indicates that approximate gold price changes equal -1.5x to -2.5x the change in real 10-year US Treasury yields. However, this relationship strengthens during crisis periods and weakens during stable economic conditions.
Historical analysis of real rate peaks provides context for metal price cycles. During the 1980s real rate peak, real 10-year US Treasury yields reached +8.5% (nominal yield 15.21%, inflation 6.86%) in October 1981. Gold prices simultaneously peaked at $850, then declined to $275 by 2001. Furthermore, real rates remained elevated through the 1980s-1990s.
The 2008-2012 period demonstrated the opposite dynamic as negative real rates drove sustained precious metals appreciation:
• 2008: Real 10-year yields fell to -2.3% (nominal 3.65%, CPI inflation 5.96%)
• 2010: Real yields reached -2.8% (nominal 3.32%, inflation 6.16%)
• 2012: Real yields fell to -1.8% (nominal 1.80%, inflation 3.60%)
Over this four-year period, gold appreciated from $869 to $1,664, representing a 91.4% gain that correlated strongly with declining real yield trends.
Federal Reserve policy transmission affects precious metals through multiple channels beyond direct interest rate adjustments. Forward guidance regarding future policy paths influences breakeven inflation rates, which directly impact real yield calculations. When the Federal Reserve signals extended low rate policies, inflation expectations typically rise faster than nominal yields. Consequently, this creates negative real rate conditions favourable to precious metals.
Inflation Expectations Versus Actual Inflation Impact
Breakeven inflation rates, derived from the spread between nominal Treasury securities and Treasury Inflation-Protected Securities (TIPS), serve as leading indicators for precious metals performance. When five-year breakeven rates exceed 3.0%, historical data shows gold outperforming broad equity indices by 5-12% annually.
The relationship between actual inflation and precious metals proves more complex than commonly understood. Core Consumer Price Index components most correlated with gold performance include shelter costs, energy prices, and medical care services rather than headline inflation figures. This occurs because these components reflect structural inflationary pressures rather than temporary supply shocks.
Central bank inflation targeting credibility significantly affects precious metals valuations. When inflation expectations become "unanchored" from Federal Reserve targets, meaning market expectations persistently exceed 2.5-3.0% despite policy responses, precious metals typically appreciate 10-20% within 6-12 months. For instance, the 2021-2022 inflation surge demonstrated these dynamics as inflation expectations reached 40-year highs while gold price outlook remained elevated despite nominal rate increases.
International Interest Rate Differential Effects:
• Cross-Currency Flows: When US real rates decline relative to European or Asian alternatives, dollar-denominated gold becomes more attractive to international investors
• Carry Trade Unwinding: Negative real rate environments often coincide with carry trade liquidations, driving safe-haven demand for monetary assets
• Currency Debasement Competition: When multiple central banks simultaneously pursue negative real rate policies, precious metals benefit from reduced opportunity costs across all major currencies
How Should Investors Approach Portfolio Protection Strategies?
Strategic precious metals allocation requires understanding that these assets serve portfolio insurance functions rather than growth investment purposes. Effective protection against currency debasement and financial system stress demands allocation frameworks that acknowledge precious metals' unique risk-return characteristics.
Strategic Allocation Models for Currency Debasement Protection
Academic research supports precious metals allocations of 5-10% in diversified portfolios, though optimal percentages vary based on macroeconomic conditions and individual risk tolerance. During periods of negative real interest rates, elevated debt-to-GDP ratios, or banking sector stress, allocations toward the higher end of this range provide enhanced portfolio protection.
Risk parity approaches offer sophisticated frameworks for incorporating monetary assets. Rather than using traditional market capitalisation weightings, risk parity models allocate based on volatility-adjusted contributions to portfolio risk. Since precious metals often exhibit negative correlation with equity markets during crises, their volatility-adjusted allocation may justify 7-15% portfolio weights during stressed market conditions.
Rebalancing strategies during volatile market conditions require disciplined approaches that resist emotional decision-making. Research indicates that quarterly rebalancing schedules work effectively for precious metals allocations, though crisis periods may warrant more frequent monitoring. When precious metals appreciate 20%+ above target allocations, systematic rebalancing captures gains whilst maintaining protection capacity for future shocks.
Portfolio Construction Principles:
• Core Holdings: 3-5% allocation for baseline monetary diversification
• Crisis Alpha: Additional 2-7% allocation during periods of systemic risk indicators
• Rebalancing Triggers: 25% deviation from target allocation warrants rebalancing consideration
• Time Horizon: Minimum 3-5 year holding periods to capture full cycle benefits
Physical Versus Paper Precious Metals Exposure
Physical precious metals ownership eliminates counterparty risk that exists with exchange-traded funds, mining equities, and futures contracts. During systemic financial stress, paper alternatives may face liquidity constraints, tracking errors, or institutional failures that compromise their effectiveness as portfolio protection.
Exchange-traded fund structures, whilst convenient for trading and storage, introduce counterparty exposures that defeat the purpose of precious metals ownership during extreme scenarios. Major precious metals ETFs typically hold physical metals in allocated storage, but shareholders own beneficial interests rather than direct metal ownership. Furthermore, during crisis scenarios involving financial system breakdown, legal complexities could delay or prevent redemption access.
Storage and liquidity considerations for physical holdings require advance planning and cost analysis. Professional storage facilities provide security and insurance, typically charging 0.5-1.5% annually of metal value. Home storage eliminates ongoing costs but requires appropriate security measures and insurance coverage. Liquidity for physical metals depends on local dealer networks and premium variations, which can vary significantly during high-demand periods.
Mining equity exposure provides leveraged precious metals sensitivity but introduces operational risks, management decisions, and equity market correlations that compromise pure monetary asset characteristics. During the 2008 financial crisis, major gold mining companies declined 30-50% despite rising gold prices due to credit constraints and operational difficulties.
Physical Ownership Considerations:
• Storage Costs: Professional storage typically costs 0.5-1.5% annually
• Insurance Requirements: Adequate coverage for stored value essential
• Liquidity Access: Local dealer networks and premium considerations
• Tax Implications: Capital gains treatment and reporting requirements
What Are the Key Risk Indicators for Financial System Stress?
Monitoring specific financial system metrics provides early warning signals for conditions that historically drive precious metals outperformance. These indicators help investors identify periods when protection against currency debasement and financial system stress becomes particularly valuable.
Early Warning Signals for Monetary Debasement
Debt-to-GDP ratios approaching 100% historically correlate with increased precious metals demand as investors anticipate monetary solutions to fiscal problems. The United States debt-to-GDP ratio exceeded 100% in 2012 and reached 127% by 2020. These levels are historically associated with currency debasement pressures in other developed economies.
Central bank balance sheet expansion rates provide direct indicators of monetary debasement risk. When major central bank balance sheets expand faster than nominal GDP growth, excess liquidity typically flows into alternative stores of value including precious metals. Federal Reserve balance sheet expansion from $4.2 trillion to $9 trillion peak (2020-2021) created conditions for sustained precious metals appreciation.
Currency volatility indices and cross-rate instability signal confidence breakdowns in monetary systems. The DXY Dollar Index volatility exceeding 12% on an annualised basis typically coincides with 10-25% precious metals appreciation within 6-12 months. Similarly, when major currency pairs (EUR/USD, USD/JPY, GBP/USD) exhibit daily volatility exceeding 150 basis points for sustained periods, precious metals benefit from safe-haven demand.
Quantitative Monitoring Framework:
• TED Spread: Levels exceeding 100 basis points signal financial stress
• Credit Default Swaps: Bank CDS spreads above 150 basis points indicate systemic concern
• Yield Curve Inversions: 3-month/10-year inversions preceding precious metals rallies by 6-18 months
• FDIC Problem Bank List: Counts exceeding 20-30 institutions correlate with metal outperformance
Monitoring Government Policy Response Patterns
Emergency lending facility activation by central banks serves as direct indicators of financial system stress requiring precious metals protection. Federal Reserve facilities including the Term Auction Facility, Primary Dealer Credit Facility, and Commercial Paper Funding Facility activate only during crisis conditions. Moreover, they historically precede significant precious metals appreciation.
Regulatory changes affecting banking sector stability often signal underlying systemic problems that support precious metals demand. Emergency modifications to capital requirements, stress test parameters, or deposit insurance coverage indicate policymaker concerns about banking sector resilience. The 2023 regional banking crisis prompted regulatory discussions about increasing FDIC coverage limits, signalling systemic confidence issues.
International coordination mechanisms during crisis periods provide macro indicators for global financial stability concerns. Federal Reserve swap line activations with foreign central banks, G7 coordinated policy responses, or International Monetary Fund special drawing rights allocations indicate stress levels that typically benefit precious metals demand. Additionally, these mechanisms highlight the broader concerns about structural vulnerabilities in fiat currency systems that precious metals can help address.
Which Economic Scenarios Favor Precious Metals Performance?
Specific economic environments create optimal conditions for precious metals outperformance relative to traditional asset classes. Understanding these scenarios helps investors time allocation adjustments and position portfolios for protection against currency debasement and financial system stress.
Stagflation Environments and Precious Metals Dynamics
Stagflation combines economic growth deceleration with persistent inflation, creating conditions where precious metals typically outperform all other major asset classes. During the 1970s stagflation period, gold appreciated 2,328% whilst real GDP growth averaged only 2.8% annually and inflation peaked above 13%.
Energy price shocks often trigger stagflationary conditions through cost-push inflation mechanisms that reduce economic growth whilst raising price levels. The 1973 oil embargo and 1979 Iranian revolution created energy-driven stagflation that drove substantial precious metals appreciation. Contemporary energy transition policies and geopolitical tensions create similar risk scenarios for future stagflationary episodes.
Labour market disruptions and wage-price spiral risks characterise stagflationary environments that favour precious metals. When unemployment remains elevated whilst inflation expectations become unanchored, central banks face policy dilemmas that typically resolve through monetary accommodation rather than economic contraction. These conditions create negative real interest rates supportive of precious metals performance.
Stagflation Indicators:
• Phillips Curve Breakdown: When unemployment and inflation rise simultaneously
• Real GDP Growth: Below 1% annually combined with inflation above 4%
• Productivity Decline: Output per hour worked falling below historical trends
• Supply Chain Constraints: Persistent delivery delays and input cost inflation
Financial System Confidence Breakdowns
Bank run scenarios and deposit insurance limitations create immediate precious metals demand as investors seek alternatives to banking system exposure. FDIC insurance covers only $250,000 per depositor per institution, leaving substantial wealth exposed to banking sector risks during systemic crises. The 2023 Silicon Valley Bank collapse demonstrated how quickly depositor confidence can evaporate despite regulatory safeguards.
Credit market freezes and liquidity crunch indicators signal conditions where precious metals provide portfolio liquidity when traditional markets fail. During September 2008, normally liquid corporate bond markets experienced complete trading cessation for days. However, physical precious metals markets continued functioning despite elevated volatility.
Sovereign debt crisis contagion effects create global financial instability that drives safe-haven demand for monetary assets. European sovereign debt crises (2010-2012) demonstrated how quickly confidence crises spread between interconnected financial systems. These events support precious metals demand even in countries not directly affected by fiscal problems. In addition, the silver market squeeze during these periods often amplifies the protective value of precious metals portfolios.
The next major ASX story will hit our subscribers first
How Do Global Trade Disruptions Affect Precious Metals Demand?
International trade instability creates multiple transmission channels for precious metals demand through supply chain vulnerabilities, currency war scenarios, and central bank reserve diversification efforts.
Supply Chain Vulnerabilities and Safe Haven Demand
International trade route disruptions affecting critical commodity flows historically drive safe-haven demand for stores of value including precious metals. The 2021 Ever Given Suez Canal blockage demonstrated how quickly global trade can face constraints. Furthermore, this created broader economic uncertainty that supports precious metals demand.
Currency war scenarios involving competitive devaluation policies among major economies create conditions where precious metals benefit from being neutral monetary assets. When countries attempt to boost exports through currency debasement, precious metals provide protection against purchasing power erosion. This occurs because precious metals affect all fiat currencies involved in devaluation competition.
Regional conflict impacts on global financial stability extend beyond direct participants to affect worldwide trade flows and financial market confidence. Russia-Ukraine conflict effects included commodity price volatility, energy supply disruptions, and payment system restrictions. Consequently, these increased demand for alternative stores of value and settlement mechanisms.
Central Bank Reserve Diversification Trends
Official sector gold purchases by central banks reached multi-decade highs during 2022-2024, with net purchases exceeding 1,000 tonnes annually. This represents a significant shift from the 1990s-2000s when central banks were net sellers of gold reserves. Countries including China, Russia, India, and Turkey substantially increased official gold holdings as part of reserve diversification strategies.
Dedollarisation efforts and alternative reserve asset adoption create structural demand for precious metals as countries seek to reduce dependence on US dollar-denominated reserves. Central bank policies promoting bilateral trade settlement in national currencies often include precious metals components for international transaction settlement. Furthermore, these efforts reflect broader concerns about the stability of traditional currency systems and de-dollarisation trends.
Bilateral trade settlement mechanisms bypassing traditional correspondent banking systems increasingly incorporate precious metals for international transactions. These arrangements provide alternatives to SWIFT-based payment systems and reduce exposure to potential financial sanctions. Moreover, they create ongoing structural demand for monetary metals.
What Investment Mistakes Should Be Avoided in Precious Metals?
Understanding common precious metals investment errors helps investors implement effective strategies for protection against currency debasement and financial system stress whilst avoiding counterproductive approaches.
Common Timing and Allocation Errors
Attempting to trade precious metals like growth stocks represents a fundamental category error that leads to poor investment outcomes. Precious metals function as monetary assets providing long-term purchasing power protection rather than short-term trading opportunities based on earnings growth or valuation metrics.
Overconcentration in single metal exposure creates unnecessary risks when diversification across multiple precious metals provides better protection. Gold, silver, platinum, and palladium each respond to different supply-demand dynamics and industrial applications. Therefore, multi-metal exposure proves more robust than single-metal concentration.
Neglecting storage and insurance cost considerations can significantly erode long-term returns from physical precious metals ownership. Professional storage costs typically range 0.5-1.5% annually, whilst home storage requires adequate security measures and insurance coverage that many investors underestimate.
Common Allocation Mistakes:
• Market Timing Attempts: Trying to "buy low, sell high" rather than strategic allocation
• Excessive Concentration: More than 25% portfolio allocation in precious metals
• Inadequate Diversification: Single metal exposure rather than multi-metal allocation
• Cost Ignorance: Failing to account for storage, insurance, and transaction costs
Understanding Market Structure and Liquidity Dynamics
Futures market influence on spot pricing mechanisms creates temporary disconnects between paper and physical precious metals prices during stressed market conditions. The March 2020 gold market dysfunction demonstrated how futures-based price discovery can break down when physical delivery becomes constrained. However, this creates arbitrage opportunities for knowledgeable investors.
Physical delivery constraints during high-demand periods can create significant premiums for physical metals over paper alternatives. The COVID-19 pandemic created temporary shortages of retail precious metals products, with premiums exceeding 10-15% above spot prices for common coins and bars. Understanding these dynamics helps investors anticipate liquidity challenges during crisis periods.
Regional premium variations and arbitrage opportunities exist between different geographic markets for precious metals. London, New York, Shanghai, and Mumbai markets can exhibit price differentials during periods of capital controls, trade restrictions, or local demand surges. These variations affect optimal sourcing and storage decisions for international investors.
Building a Comprehensive Financial Resilience Framework
Effective protection against currency debasement and financial system stress requires integrating precious metals into broader financial resilience strategies that address multiple risk scenarios and time horizons.
Integration with Emergency Fund and Liquidity Planning
Layered approach strategies combining cash, precious metals, and income-generating assets provide comprehensive protection against different types of financial disruption. Emergency cash reserves handle short-term liquidity needs, precious metals provide medium-term purchasing power protection, and income-generating assets offer long-term wealth building during stable periods.
Accessibility considerations during crisis scenarios require advance planning for precious metals liquidity. Physical metals stored in bank safe deposit boxes may face access limitations during banking holidays or emergency conditions. However, home storage provides immediate access but requires security measures and insurance coverage.
Tax implications and reporting requirements for precious metals holdings vary significantly by jurisdiction and transaction size. US tax code treats precious metals as collectibles subject to 28% maximum capital gains rates rather than standard 15-20% rates for other investments. Understanding these implications helps optimise holding structures and timing for realisation of gains.
Long-term Wealth Preservation Strategies
Intergenerational wealth transfer considerations make precious metals attractive for estate planning purposes due to their durability, global recognition, and independence from specific institutional frameworks. Physical metals can transfer across generations without dependence on corporate survival, government policies, or financial system stability.
Estate planning implications for physical precious metals include valuation methodologies, storage arrangements, and beneficiary education about proper handling and liquidity options. Professional appraisals and documentation become important for substantial holdings that represent significant estate components.
Insurance and security protocols for substantial holdings require professional guidance on optimal storage arrangements, coverage types, and access procedures. High-value holdings may benefit from diversified storage across multiple locations and institutions to reduce concentration risks whilst maintaining accessibility.
Implementation Checklist:
• Initial Allocation: Start with 3-7% portfolio allocation based on risk tolerance
• Storage Planning: Establish secure storage arrangements with appropriate insurance
• Documentation: Maintain detailed records for tax and estate planning purposes
• Regular Review: Monitor allocation percentages and rebalance as needed
• Crisis Preparation: Ensure accessibility and liquidity during emergency scenarios
Protection against currency debasement and financial system stress requires understanding that precious metals serve fundamentally different portfolio functions than traditional securities. Rather than seeking short-term gains or attempting precise market timing, effective precious metals strategies focus on long-term purchasing power preservation and systematic allocation approaches that provide insurance against monetary system failures and economic uncertainty.
Ready to Position Yourself for the Next Major Discovery?
Discovery Alert's proprietary Discovery IQ model delivers real-time alerts on significant ASX mineral discoveries, turning complex exploration data into actionable investment insights for both short-term traders and long-term investors. Understand why historic mineral discoveries can generate exceptional returns by exploring our dedicated discoveries page, then begin your 14-day free trial today to gain a crucial market-leading advantage powered by advanced AI technology.