
July 15, 2026
The Hidden Inflation Crisis Reshaping Commodity Investing
Most investors assess portfolio risk through the lens of official data. They track Federal Reserve statements, monitor published CPI figures, and calibrate their asset allocation accordingly. But a growing cohort of veteran resource investors operates from a fundamentally different premise: that the numbers governments publish and the economic reality households experience have quietly and persistently diverged, and that this gap is the most important investment signal of the decade.
This is the intellectual foundation that draws serious commodity investors, mining executives, and macro analysts to gatherings like the Rick Rule Symposium each year. The conversations that unfold at events like this one, held at the Boca Raton Resort in Florida, tend to move beyond headline price targets and into deeper structural questions about monetary architecture, supply cycle dynamics, and what disciplined commodity investing actually requires. The Rick Rule Symposium gold silver and copper outlook that emerged from this year's event offers a multi-layered view of where veteran investors see opportunity, risk, and misunderstanding across three of the world's most consequential metals.
When big ASX news breaks, our subscribers know first
Purchasing Power, Currency Debasement, and the Real Inflation Debate
The Gap Between Official CPI and Lived Reality
One of the most practically useful frameworks that circulates among experienced commodity investors involves constructing your own inflation measure rather than accepting published figures at face value. The exercise is straightforward: compare what your household actually paid for its typical basket of goods and services in 2020 against what that same basket costs today. Food, housing, energy, childcare, insurance, and healthcare all feed into this personal calculation.
Official US CPI figures report inflation running at approximately 2.5% annually. However, when investors run this personalised basket analysis, the number that emerges is closer to 8% per year. This is not a fringe position. It reflects a methodological criticism of CPI construction that has persisted across academic and financial circles for decades, centred on how housing costs are measured, how substitution effects are handled, and how quality adjustments alter reported figures.
The investment implications of this gap are significant. If real household inflation is running at three times the reported rate, then:
- Cash savings lose purchasing power far faster than nominal interest rates compensate for
- Real interest rates may be substantially more negative than official calculations suggest
- The return threshold that alternative assets must clear to preserve wealth is meaningfully higher than conventional models assume
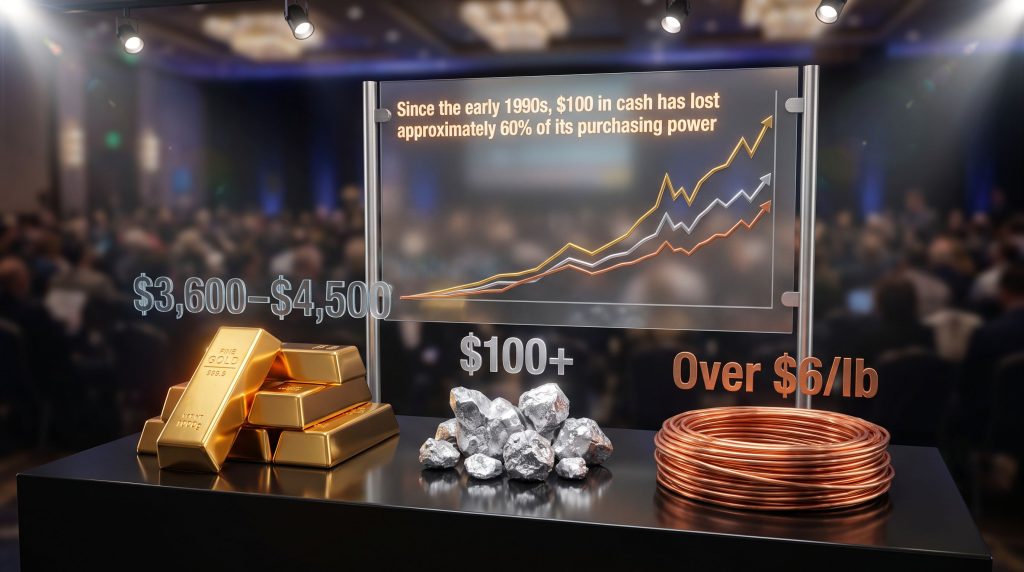
Adding historical perspective deepens this picture. Since the early 1990s, the cumulative erosion of cash purchasing power has been dramatic, with some analysts estimating that $100 in cash has lost approximately 60% of its real value over that period. Real assets, by contrast, have broadly moved in the opposite direction. This asymmetry is not incidental; it is the foundational thesis driving serious commodity allocations at the institutional level.
Federal Reserve Flexibility and What It Means for Rates
A contrarian perspective worth examining involves how Federal Reserve policy may evolve in response to US debt servicing pressures. The conventional market narrative focuses on whether rates will fall based on inflation progress. But an alternative reading suggests the more powerful constraint may be the government's ability to finance its own debt at elevated interest rates.
The argument runs as follows: as US debt servicing costs consume an ever-larger share of federal revenue, the structural pressure to reduce rates intensifies regardless of inflation conditions. A Fed that avoids forward guidance retains greater flexibility to act when this pressure becomes acute. For commodity investors, this interpretation implies that rate reductions may arrive earlier or more aggressively than consensus expects, which would remove a key headwind for precious metals and compress the real yield advantage that currently supports cash holdings.
Gold's Evolving Role in the Global Monetary System
From Safe Haven to Reserve Architecture
Gold's function in global finance has undergone a structural shift that many retail investors have not fully registered. For most of the post-Bretton Woods era, gold was characterised primarily as a crisis hedge or speculative instrument. Central banks across the developed world were net sellers. That dynamic has reversed sharply, and understanding gold in the monetary system is now essential context for any serious macro investor.
According to World Gold Council data, gold now represents approximately 23 to 25% of global central bank reserve holdings. Perhaps more significantly, gold has surpassed US Treasuries as a preferred reserve asset for a growing number of sovereign institutions. This is not a marginal or temporary adjustment. It represents a generational shift in how the world's monetary authorities think about reserve diversification and currency risk.
Furthermore, central bank gold buying has become one of the most influential structural forces driving the metal's long-term price trajectory, a development that many retail investors continue to underestimate.
Central banks are not buying gold because they expect short-term price appreciation. They are buying it because they are reassessing the long-term reliability of paper currency systems as stores of value.
This reframing matters enormously for how individual investors should think about sizing gold positions. If gold is a trade, position sizing follows speculative logic. If gold is a monetary reserve instrument, the calculus changes entirely. Treating it as money rather than a market bet implies different holding periods, different drawdown tolerances, and different criteria for evaluating success.
Gold Price Scenarios: Near-Term Volatility, Long-Term Structure
| Timeframe | Price Range | Primary Drivers |
|---|---|---|
| Near-Term (2025-2026) | $3,600 – $4,500 | Rate environment, sentiment reset, institutional positioning |
| Medium-Term | $5,500 – $6,000 | Rate reduction cycle, continued central bank accumulation |
| Long-Term (10-Year) | Substantially higher | USD purchasing power erosion thesis, reserve architecture shift |
Even participants with deeply bullish long-term convictions have acknowledged near-term risk. Gold could retest support around $3,600 before resuming its structural trend. This is not a bearish position; it is an honest acknowledgment that no uptrend moves in a straight line, and that corrections within secular bull markets can be severe enough to test even experienced investors' resolve.
Sentiment Extremes and What History Suggests
One of the more striking data points from this year's Rick Rule Symposium gold silver and copper outlook discussions involves the divergence between conference attendee sentiment and broader institutional positioning in gold equities. Within the room, sentiment ran toward greed. Veteran attendees, conditioned through years of market cycles, largely interpreted the correction as a chance to accumulate rather than exit.
But step outside that room and a very different picture emerges. Sentiment toward gold equities among the broader investment public reached a remarkable extreme, with readings that included at least one session recording zero bullish sentiment across tracked indicators. Veteran money managers with five decades of cross-sector experience described this as the most negative sentiment they had ever observed in any sector across their entire career.
What does 50 years of market cycle experience suggest about such readings? Historically, extreme negative sentiment at this magnitude has tended to precede significant mean reversion. Whether that pattern holds in this cycle remains to be seen, but the data point demands attention from investors who take a contrarian, cycle-aware approach to portfolio construction. For additional context on Rick Rule's broader views across multiple commodities, this in-depth interview on market outlook provides valuable perspective.
Silver's Structural Deficit and the Mining Ratio Framework
Why Silver's Supply-Demand Dynamics Are Unique
Silver occupies a genuinely unusual position in the commodity complex. It functions simultaneously as a monetary metal and as an industrial commodity with applications that are expanding rather than contracting. This dual identity creates a demand profile that is both defensive and growth-oriented.
On the supply side, silver supply deficits have now been recorded across multiple consecutive years, meaning that global demand has persistently exceeded mined and recycled supply. This deficit does not resolve quickly. Unlike financial assets, physical commodity shortages require time-consuming and capital-intensive responses: new exploration, permitting, construction, and commissioning of mining operations, all before the first ounce of incremental supply reaches the market.
The 8:1 Mining Ratio: A Different Lens on Silver Valuation
Most investors familiar with silver pricing have encountered the gold-to-silver ratio, which historically hovered around 80:1 before widening significantly in recent decades. But there is an alternative valuation framework worth understanding, one grounded in geological and industrial reality rather than historical price relationships.
The global mining industry extracts approximately 8 ounces of silver for every 1 ounce of gold. This is not a financial construction; it reflects the physical abundance of silver relative to gold in the earth's crust and the economics of mining both. Applying this production-weighted ratio to current gold prices generates a very different implied silver price than prevailing market levels reflect.
At current gold prices above $3,000 per ounce, dividing by the 8:1 mining ratio implies a silver price well above current spot levels. This framework suggests the market is significantly undervaluing silver relative to the actual scarcity relationship between the two metals as revealed by mining output data.
Silver Price Scenarios
| Scenario | Price Target | Timeframe | Key Assumption |
|---|---|---|---|
| Base Case | $100+ | By 2030 | Structural deficit persists, industrial demand grows |
| Bull Case | Materially above $100 | 5-7 years | Rate cuts accelerate, monetary demand surges |
| Correction Case | Tests recent lows | Near-term | Speculative excess unwinds, system stress eases |
It is worth noting that triple-digit silver price forecasts were circulating as early as 2012, a period during which such projections attracted significant scepticism. Silver's move to $121 in 2025 validated that long-duration thesis after more than a decade of waiting. The question now is whether the underlying structural conditions, specifically the persistent supply deficit and expanding industrial consumption from electrification and electronics, remain intact. The broad assessment among silver specialists is that they do, even as near-term volatility creates substantial uncertainty about timing.
Copper: The Long-Duration Electrification Thesis
Why Copper's Demand Case Is Structurally Different
Copper is not experiencing a cyclical demand surge. The forces driving copper consumption, specifically EV charging infrastructure, AI data centre power systems, electrical grid modernisation, and renewable energy buildout, are embedded in long-duration commitments by governments, corporations, and consumers worldwide. These are not discretionary spending categories that disappear when sentiment shifts. They are capital programmes running across multi-decade timelines.
The compounding effect of simultaneous demand acceleration across multiple end-use sectors creates a demand growth trajectory that is genuinely unprecedented in copper's history. No single previous demand driver combined the scale, simultaneity, and inelasticity of the current electrification and digitalisation wave. Consequently, understanding the emerging copper supply crunch is critical for any investor seeking exposure to this structural theme.
The Supply Response Problem: Thirty Years of Underinvestment
Understanding why the copper supply response will be slow requires appreciating the full timeline involved in bringing new copper supply to market:
- Exploration and discovery — typically 5 to 10 years to identify and delineate a viable deposit
- Feasibility and permitting — commonly 3 to 7 additional years, often longer in complex regulatory jurisdictions
- Construction and commissioning — another 3 to 5 years for major projects
- Ramp-up to full production — often 2 to 4 years after first ore is processed
The cumulative timeline from exploration decision to meaningful production frequently exceeds 15 years. This means that even if the global mining industry dramatically accelerated capital deployment into copper projects today, the supply response would not arrive until well into the 2030s. Three decades of chronic underinvestment in exploration and development have compounded this structural lag to a degree that cannot be reversed by capital alone.
Copper Market Snapshot: Near-Term vs. Long-Term
| Dimension | Current Condition | 5-10 Year Outlook |
|---|---|---|
| Supply | Near-term oversupply described | Unavoidable shortage as underinvestment compounds |
| Price | Above $6/lb, retreated from highs | Must rise substantially to ration demand |
| Speculative Risk | Elevated near-term risk for traders | Structural longs rewarded across full cycle |
| Demand Drivers | Electrification, AI infrastructure | Intensifying across all categories |
Investors who conflate copper's near-term oversupply with a structurally bearish outlook risk misreading one of the most compelling long-duration commodity setups in a generation. The near-term and long-term pictures are not just different; they are pointing in opposite directions.
One of the more intellectually compelling arguments for copper as a long-term allocation is rooted in cognitive legibility. The investment case does not require mastery of complex software economics or AI adoption curves. It requires understanding geology, mining economics, and infrastructure demand. For investors who find technology sector valuations opaque, copper offers a more transparent risk-return framework where the fundamental constraints are geological and logistical rather than speculative.
Investment Strategy and the Discipline of Knowing Yourself
Volatility Tolerance: The Foundational Self-Assessment
Perhaps the most underappreciated insight from serious commodity investors concerns not the metals themselves but the investors who buy them. The gap between stated and actual volatility tolerance is one of the most persistent and costly mistakes in resource investing.
Almost every investor who opens a brokerage account describes themselves as comfortable with volatility and committed to long time horizons. The reality, consistently observed across decades of market cycles, is that a significant proportion of these self-assessed long-term investors capitulate during exactly the drawdowns that veteran investors recognise as accumulation opportunities. The result is a pattern of buying near highs and selling near lows that structurally destroys the returns that the underlying thesis would otherwise deliver.
Volatility Tolerance Self-Assessment Checklist:
- Can you hold a position through a 40-50% drawdown without selling?
- Do you have a genuine time horizon of 5 or more years for speculative resource positions?
- Is your commodity allocation sized so that a 50% loss would not materially impair your financial position?
- Do you understand the specific geology and management quality of the companies you own?
- Have you clearly distinguished between physical metal exposure and equity exposure in your portfolio?
If the honest answer to any of these questions is uncertain or no, the appropriate response is not to change the answer. It is to adjust the position size or risk profile until the answer becomes genuinely yes.
Geology First: The Non-Negotiable Starting Point
For those evaluating mining equities specifically, experienced mine builders consistently emphasise that geological quality is the non-negotiable starting point for any investment decision. Management teams can be replaced. Capital structures can be restructured. But a poor ore body cannot be improved by human ingenuity. A high-grade, geometrically well-defined deposit in a stable jurisdiction provides a foundation that no amount of promotional activity can substitute for.
In addition, understanding cut-off grade economics is essential when assessing whether a deposit will remain economically viable across varying commodity price environments. This practical hierarchy applies when evaluating mining investments:
- Geological quality: grade, continuity, size, and metallurgical characteristics of the ore body
- Jurisdictional risk: political stability, permitting frameworks, and historical treatment of mining investment
- Management quality: track record of capital discipline, technical execution, and shareholder alignment
- Capital structure: debt levels, cash runway, dilution history, and shareholder register quality
Physical Metal vs. Mining Equities: Choosing the Right Instrument
Physical precious metals and mining equities offer fundamentally different risk-return profiles, and understanding when each is appropriate matters for portfolio construction:
- Physical gold and silver eliminate operational, jurisdictional, and management risk but capture only the commodity price return, with no leverage to operational improvements or exploration upside
- Mining equities offer leverage to commodity prices and the potential for exploration or development discoveries to generate returns well above the underlying metal price, but introduce a full spectrum of business-level risks
- Silver equities may offer superior near-term risk-reward compared to physical silver in certain market environments, particularly when the market undervalues optionality embedded in undeveloped silver projects
The decision between physical and equity exposure is not static. It should be revisited as market conditions, valuations, and individual financial circumstances evolve.
The next major ASX story will hit our subscribers first
FAQ: Rick Rule Symposium Gold, Silver and Copper Outlook
What is the long-term gold price target discussed at the Rick Rule Symposium?
Some participants referenced targets in the $5,500 to $6,000 range for the medium term, with longer-term trajectories tied to a thesis of substantial USD purchasing power erosion across the coming decade. No single consensus target was established.
Why might silver outperform gold over the next decade?
Silver is experiencing a structural supply deficit, faces inelastic and growing industrial demand from electrification and electronics manufacturing, and is currently priced well below levels implied by its mining production ratio relative to gold.
Is copper a good investment right now?
Copper presents a bifurcated picture. Near-term conditions include oversupply risk and elevated speculative positioning. However, the 5 to 10 year structural outlook is considered highly compelling due to chronic underinvestment and accelerating electrification demand.
What is the biggest near-term risk to the gold bull market?
Elevated nominal US interest rates represent the primary headwind, alongside the possibility that gold retests support near $3,600 before resuming its structural uptrend.
What does the 8:1 mining ratio tell us about silver's fair value?
The mining industry extracts approximately 8 ounces of silver for every ounce of gold globally. Dividing the current gold price by 8 provides a production-weighted valuation benchmark that implies significantly higher silver prices than current market levels reflect.
How should investors approach gold equities given current volatility?
Honest self-assessment of genuine volatility tolerance, appropriate position sizing, and a minimum 5-year time horizon are the recommended prerequisites. Furthermore, investors who cannot tolerate drawdowns of 40-50% are advised to limit or avoid gold equity exposure. The Rick Rule Symposium gold silver and copper outlook consistently reinforces that emotional discipline separates successful resource investors from the majority who underperform their own holdings.
Disclaimer: This article is for informational and educational purposes only and does not constitute financial advice. Commodity markets involve significant risk of loss. All price forecasts, sentiment observations, and structural theses referenced reflect the views of conference participants and should not be taken as predictive of future outcomes. Readers should conduct their own research and consult a qualified financial adviser before making investment decisions.
Want to Identify the Next Major Mineral Discovery Before the Broader Market?
Discovery Alert's proprietary Discovery IQ model delivers real-time alerts on significant ASX mineral discoveries across gold, silver, copper, and more than 30 other commodities, instantly converting complex geological data into actionable investment insights — explore the historic returns major discoveries have generated and begin your 14-day free trial at Discovery Alert to position yourself ahead of the market.