
July 15, 2026
The Hidden Mechanics Behind Rio Tinto Iron Ore Sales Beats Estimates
There is a widely held assumption in commodity investing that production volume is the primary yardstick of mining performance. This assumption routinely misleads. In the iron ore sector, the gap between ore extracted from the ground and tonnes actually loaded onto vessels and sold to steel mills can be substantial. Understanding this distinction is foundational to interpreting why Rio Tinto iron ore sales beats estimates, as it did for Q2 2026, carries more analytical weight than a simple year-on-year comparison might suggest.
When Rio Tinto iron ore sales beats estimates, as it did for the three months ending June 30, 2026, the signal is not merely that the company shipped more steel-making material than expected. It tells a more specific story about integrated system execution: that mine-to-port throughput, rail utilisation, and vessel scheduling all aligned with sufficient precision to convert production potential into realised revenue outperformance. Furthermore, the China steel outlook remains a critical backdrop against which these results must be assessed.
When big ASX news breaks, our subscribers know first
Q2 2026 Pilbara Sales: What the Numbers Actually Tell Us
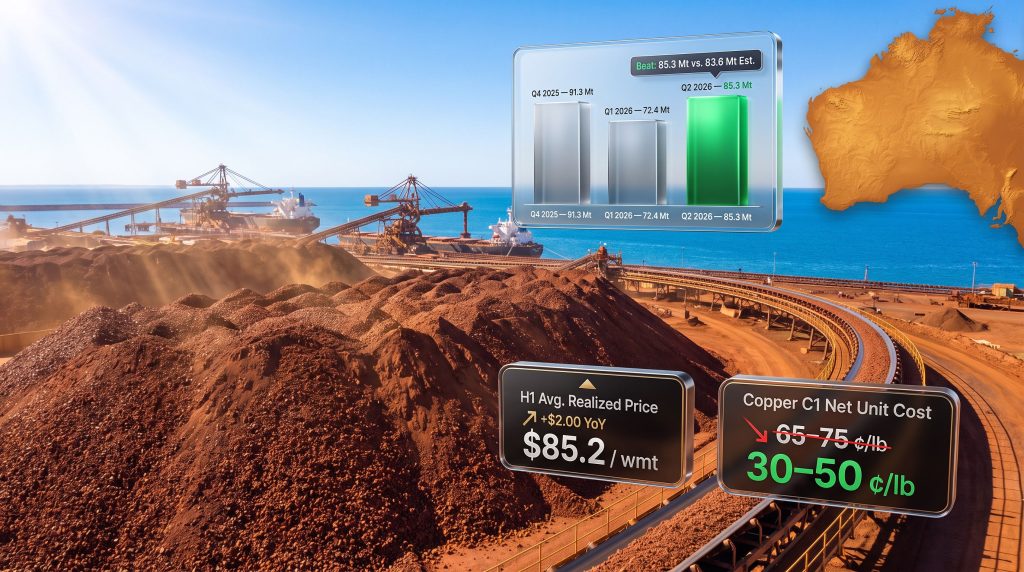
Rio Tinto sold 85.3 million metric tonnes (Mt) of iron ore from its Pilbara operations in Q2 2026, exceeding the Visible Alpha consensus estimate of 83.6 Mt by approximately 2%. This outcome also represents a 7% increase from the 79.9 Mt recorded in Q2 2025, marking one of the stronger quarterly sales deliveries in recent periods. According to Reuters, Rio Tinto's second-quarter iron ore sales rose 7%, confirming the scale of the outperformance.
The following table captures the key performance metrics across the quarter and broader reporting period:
| Metric | Q2 2026 Actual | Consensus Estimate | Q2 2025 Actual | YoY Change |
|---|---|---|---|---|
| Iron Ore Sales Volume | 85.3 Mt | 83.6 Mt | 79.9 Mt | +7% |
| H1 Average Realized Price (FOB) | $85.2/wmt | n/a | $83.2/wmt | +2.4% |
| Copper Production (Consolidated) | 213 Kt | 214.7 Kt | n/a | -7% |
| Copper C1 Net Unit Cost (Revised) | 30-50 ¢/lb | n/a | 65-75 ¢/lb | Significant reduction |
Key Insight: The 2% beat against consensus carries disproportionate weight in commodity markets. Unlike equity earnings beats where management can influence timing, iron ore sales volumes are constrained by physical infrastructure throughput. Outperforming consensus on this metric reflects genuine operational execution rather than accounting flexibility.
What makes this result particularly meaningful is the context in which it occurred. Western Australia's Pilbara region, where Rio Tinto operates the world's largest integrated iron ore mining and export network, is subject to infrastructure constraints that are well understood by analysts. The region's three port facilities at Dampier, Cape Lambert, and Utah Point collectively handle over 300 million tonnes per annum in rated capacity, but actual realised throughput varies depending on maintenance cycles, berth availability, and weather events.
A Quarterly Arc That Resets the Narrative
Interpreting Q2 2026 in isolation risks missing a crucial piece of context. The preceding quarter told a very different story, and the contrast between Q1 and Q2 2026 illuminates something important about how Pilbara operations can diverge from expectations.
| Quarter | Sales Volume | Consensus Estimate | Outcome vs. Consensus |
|---|---|---|---|
| Q4 2025 | 91.3 Mt | 88.2 Mt | Beat (+3.5%) |
| Q1 2026 | 72.4 Mt | 74.6 Mt | Missed (-3.0%) |
| Q2 2026 | 85.3 Mt | 83.6 Mt | Beat (+2.0%) |
The Q1 2026 result is particularly instructive. Despite a reported 13% increase in production during that quarter, sales volumes of 72.4 Mt still fell short of the 74.6 Mt consensus. This is a critical distinction that many retail investors overlook: in an integrated mining operation, production and sales are decoupled by the logistics chain. Ore can be mined, crushed, and stockpiled without being converted into revenue if port or rail constraints delay shipment loading.
The Q2 2026 recovery to 85.3 Mt therefore signals more than just a rebound in volume. It indicates that the underlying logistics infrastructure was operating with improved efficiency, absorbing the ore flow and converting it into completed shipments at a rate that outpaced even refined analyst expectations. In addition, iron ore demand prospects from Chinese steel mills played a supporting role in sustaining this momentum.
What Integrated System Performance Actually Means
Rio Tinto's Pilbara network is often described as one of the most complex privately owned logistics systems in the world. It encompasses:
- More than 1,700 kilometres of dedicated heavy-haul rail connecting inland mines to coastal export terminals
- 16 operational mines across the Pilbara at varying stages of maturity and ore grade profile
- Three port facilities with distinct loading infrastructure configurations
- Autonomous and semi-autonomous haulage systems that affect ore movement timing
The Rio Tinto rail network is a key enabler of this system's throughput capacity. When analysts reference system performance, they are referring to the throughput efficiency of this entire chain rather than any individual mine's extraction rate. A bottleneck at any single node — whether a derailment, a conveyor failure, or a berth blockage — propagates through the system and suppresses sales volumes even when mines are operating at full capacity.
Pricing Improvements Add a Revenue Quality Dimension
Volume outperformance is one dimension of the Q2 2026 story. The pricing data adds another layer that deserves careful examination.
The average realised free-on-board (FOB) price across Rio Tinto's Pilbara operations in the first half of 2026 reached $85.2 per wet metric tonne (wmt), compared with $83.2/wmt in the same period of 2025. That $2.00/wmt improvement may appear modest in percentage terms (+2.4%), but when applied across the scale of Pilbara shipments, it represents a material contribution to revenue.
Several technical nuances are worth understanding here:
- FOB vs. CFR pricing: Free-on-board pricing reflects what Rio Tinto receives at the point of vessel loading in Australian ports. Cost and freight (CFR) pricing includes the shipping cost to the destination port, typically in China. FOB realisations are therefore a cleaner measure of the value Rio Tinto captures before freight and insurance variables are introduced.
- Wet vs. dry metric tonne: Iron ore is typically priced on a dry metric tonne (dmt) basis for benchmark purposes, but Rio Tinto's Pilbara operations report in wet metric tonnes (wmt). Pilbara ore typically carries around 2-3% moisture content, meaning dmt-equivalent realisations would be marginally higher than the $85.2/wmt headline figure.
- Product mix effects: The Pilbara ships a blend of lump ore and fines. Lump ore commands a premium over fines because it can be fed directly into blast furnaces without sintering, reducing energy consumption for steelmakers.
Industry Insight: Pilbara lump ore has historically traded at premiums of $15-25 per tonne above 62% Fe fines on a CFR China basis, though this premium compresses when Chinese blast furnace utilisation rates fall or when steel margins are under pressure. Rio Tinto's ability to sustain elevated lump premiums is therefore partly a function of Chinese steelmaking economics, not purely its own ore quality.
Copper's Divergent Story: Volume Miss, But a Cost Revolution
While iron ore delivered the headline outperformance, Rio Tinto's copper segment presented a more nuanced picture. Consolidated copper production fell 7% to 213 Kt, narrowly missing the Visible Alpha consensus of 214.7 Kt. For investors focused purely on volume metrics, this represents a shortfall.
However, the more significant development lies in the cost guidance revision, which carries substantially larger implications for long-term margin quality.
Cost Guidance Callout: Rio Tinto reduced its 2026 copper C1 net unit cost forecast from 65-75 US cents per pound down to 30-50 US cents per pound. This represents a reduction of approximately 35-40 cents per pound at the midpoints, which is transformative for copper segment economics.
Two factors drove this revision:
-
Higher-than-anticipated gold prices: Gold functions as a by-product in Rio Tinto's copper operations. When gold recovered material is sold, the revenue generated is credited against the gross cost of copper production, mathematically reducing the net C1 cost per pound of copper reported. With gold prices substantially elevated through H1 2026, these by-product credits have been more powerful than the original guidance assumed.
-
Productivity improvements: Operational efficiency gains at copper assets have reduced unit operating costs independent of by-product dynamics. This component of the revision is arguably more durable, as it reflects structural rather than market-driven improvement.
The following table compares the two major segments across key performance dimensions:
| Dimension | Iron Ore (Pilbara) | Copper (Consolidated) |
|---|---|---|
| Volume vs. Consensus | Beat (+2%) | Missed (-0.8%) |
| Pricing Trend | Improving (+$2/wmt YoY) | Supported by gold credits |
| Cost Trajectory | Stable | Significantly improved |
| Full-Year Guidance Status | On track | Cost guidance revised lower (positive) |
The By-Product Credit Mechanism: Rarely Discussed, Frequently Underestimated
The way by-product credits operate in C1 cost calculations is an area where significant analytical misunderstanding exists among generalist investors. C1 cash costs represent the direct cash costs of producing a pound of copper, net of by-product revenues from metals like gold, silver, and molybdenum that are recovered during processing.
When gold prices rise sharply, a copper mine that produces meaningful gold as a co-product can see its reported C1 cost collapse even if nothing has changed in its mining or processing operations. In Rio Tinto's case, the company attributed the revision to both factors, suggesting the margin improvement has both a market-driven and a structural component.
Full-Year Guidance: Reading the H1 Run-Rate
With H1 2026 now complete, the mathematical path to annual guidance delivery becomes clearer. If Q1 2026 delivered approximately 72.4 Mt and Q2 2026 added 85.3 Mt, the implied H1 cumulative total sits at roughly 157.7 Mt.
Rio Tinto's historical annual Pilbara shipments have typically ranged between 320-340 Mt in recent years. An H1 result of approximately 157.7 Mt would require an H2 contribution of roughly 162-182 Mt to land within that range. H2 shipments have historically been weighted similarly to H1, with Q4 typically representing the strongest quarter of the year.
Risk Factors That Could Affect H2 Delivery
Several variables could influence whether Rio Tinto meets, exceeds, or falls short of full-year guidance in the back half of 2026:
- Cyclone season timing: The Australian tropical cyclone season typically runs from November through April, with peak activity in January to March. This largely falls outside the H2 calendar period, reducing weather risk.
- Chinese steel demand conditions: Demand from Chinese steel mills remains the dominant driver of seaborne iron ore pricing. Furthermore, iron ore surplus risks remain a genuine consideration should Chinese demand weaken unexpectedly.
- Iron ore price levels: Sustained price weakness could theoretically prompt schedule adjustments, though Rio Tinto's scale and low-cost position make this a relatively remote near-term risk.
- Infrastructure maintenance windows: Planned maintenance shutdowns across the rail and port network are scheduled and managed, but unplanned outages remain a source of quarterly variance.
Scenario Framing: If Rio Tinto sustains Q2-level performance across the remaining two quarters, cumulative H2 shipments would approach 170 Mt, positioning full-year totals at approximately 328 Mt. This would place the company at or above the midpoint of what most analysts model as the plausible guidance delivery range.
The next major ASX story will hit our subscribers first
The Broader Market Backdrop: Why This Report Lands When It Does
Rio Tinto's Q2 2026 result does not exist in a vacuum. It arrives during a period of meaningful uncertainty for the iron ore market, shaped by competing forces on both the supply and demand sides.
On the demand side, Chinese steel production has continued to navigate a difficult structural transition. The country's property sector, which historically consumed a significant share of steel output, has been in a multi-year adjustment period. However, infrastructure investment and manufacturing output have partially offset this drag, sustaining seaborne iron ore demand above the levels that many bearish analysts forecast two years ago.
On the supply side, Australia's iron ore advantages in terms of proximity, scale, and logistics efficiency continue to underpin the Pilbara's competitive position in global markets. The Australian Pilbara duopoly of Rio Tinto and BHP, combined with Fortescue's expanding output, means that Australian iron ore supply growth has been moderate and broadly in line with demand trends.
For Rio Tinto specifically, its position as the world's largest iron ore exporter by volume means that its quarterly results function as a partial barometer for the entire seaborne iron ore market. When Rio Tinto iron ore sales beats estimates, it often signals broader operational stability across the Pilbara corridor that competitors are also likely to report. Finimize's analysis of Rio Tinto's Pilbara iron ore sales similarly highlighted the significance of this outperformance for the broader sector.
FAQ: Rio Tinto Iron Ore Sales and Q2 2026 Results
How much iron ore did Rio Tinto sell in Q2 2026?
Rio Tinto sold 85.3 million metric tonnes from its Pilbara operations in the three months ending June 30, 2026, exceeding the Visible Alpha consensus estimate of 83.6 Mt and representing a 7% increase from 79.9 Mt in Q2 2025.
Did Rio Tinto beat or miss iron ore estimates in Q2 2026?
Rio Tinto beat consensus estimates by approximately 2%, delivering 85.3 Mt against an analyst forecast of 83.6 Mt. This follows a Q1 2026 miss, where 72.4 Mt fell short of the 74.6 Mt consensus.
What was Rio Tinto's average iron ore price in H1 2026?
The average realised FOB price across Pilbara operations in H1 2026 was $85.2 per wet metric tonne, up from $83.2/wmt in the same period of 2025.
Why did Rio Tinto reduce its copper cost guidance for 2026?
Rio Tinto revised its copper C1 net unit cost forecast from 65-75 US cents per pound down to 30-50 US cents per pound, attributing the change to higher-than-expected gold prices generating larger by-product credits and productivity gains at its copper operations.
Is Rio Tinto on track for its full-year iron ore guidance?
Based on Q2 2026 results and management commentary referencing strong system performance, the company indicated it remains positioned to meet its annual shipment guidance.
What This Means for Rio Tinto's Investment Thesis
Three themes emerge from a careful reading of the Q2 2026 results that extend beyond the headline sales beat:
-
Operational credibility restored: The Q1 2026 sales miss had introduced uncertainty about whether logistics constraints were emerging as a structural rather than seasonal issue. The Q2 2026 beat substantially addresses that concern and resets analyst confidence in management's ability to convert production into shipment volumes.
-
Margin quality improving on multiple fronts: Rising FOB realisations on the iron ore side and dramatically lower net unit costs on the copper side represent simultaneous margin tailwinds across two of the company's most important revenue streams. This convergence is unusual and supports a more constructive earnings outlook for H2 2026.
-
Gold as an indirect lever: Few generalist investors consider gold price dynamics when evaluating Rio Tinto's copper segment. The by-product credit mechanism means elevated gold prices effectively subsidise copper production economics, and with gold trading at historically elevated levels through H1 2026, this dynamic is amplifying copper segment margin quality in ways that the headline copper volume figures do not immediately reveal.
Disclaimer: This article is intended for informational and educational purposes only and does not constitute financial advice. Forecasts, scenario projections, and analytical assessments involve assumptions that may not be realised. Investors should conduct their own due diligence and consult qualified financial advisers before making investment decisions. Past performance of commodity volumes or pricing is not necessarily indicative of future results.
Want to Spot the Next Major ASX Mineral Discovery Before the Market Does?
Discovery Alert's proprietary Discovery IQ model delivers real-time alerts on significant ASX mineral discoveries, instantly translating complex data across more than 30 commodities into clear, actionable insights for traders and investors at every level — explore the historic returns major discoveries have generated and begin your 14-day free trial at Discovery Alert to position yourself ahead of the market.