
June 22, 2026
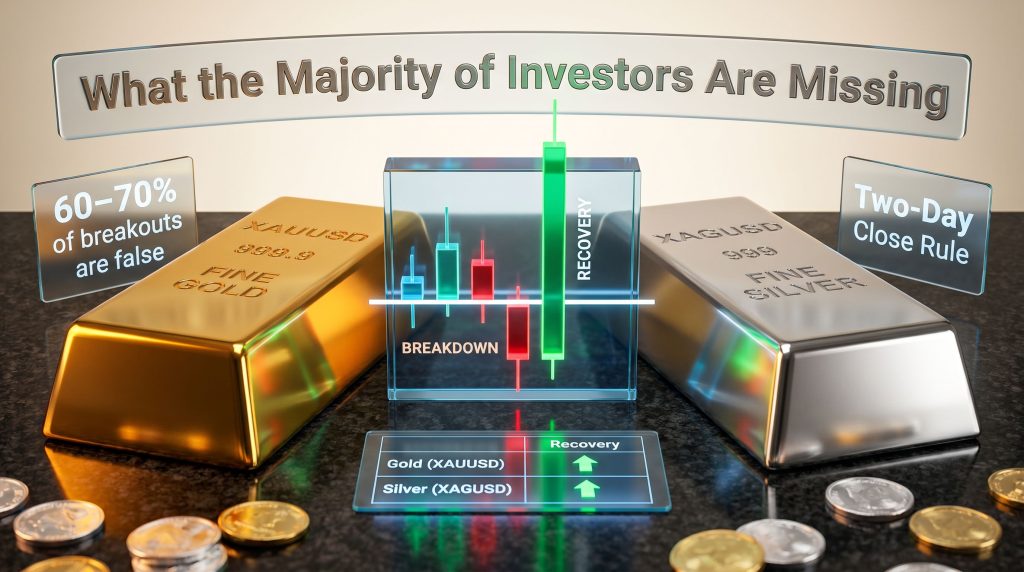
The Hidden Mechanics Behind Precious Metals Price Traps
Most participants in the gold and silver markets operate under a straightforward assumption: when price falls below a key support level, the path of least resistance is lower. This intuition feels logical. It is also, historically, one of the most reliably exploited misconceptions in all of commodity trading. The mechanics of a silver and gold false breakdown bullish setup sit at the intersection of technical structure, institutional behaviour, and mass psychology, and understanding them can fundamentally change how an investor reads a correction in precious metals.
The challenge is not identifying the support level. It is understanding what happens in the hours and days immediately after that level is violated, and why the majority of participants consistently draw the wrong conclusion at precisely the wrong moment.
When big ASX news breaks, our subscribers know first
Why False Breakdowns Carry More Predictive Weight Than Genuine Breakdowns
The Institutional Logic of Price Deception
Precious metals markets, like most liquid financial markets, are not neutral environments. Large institutional participants, including commercial hedgers, algorithmic systems, and fund managers, are aware that retail and smaller speculative traders cluster their stop-loss orders just below visible support levels. These clustered orders represent a pool of liquidity that can be accessed by executing a brief push through support, triggering forced selling, and then absorbing that supply before reversing higher.
This is not a conspiracy theory. It is a well-documented feature of liquid markets that manifests repeatedly across asset classes, but it is particularly pronounced in gold and silver because of their dual role as both speculative instruments and monetary stores of value. The emotional intensity attached to these metals amplifies the behavioural response at critical technical levels. Furthermore, precious metals market analysis consistently highlights how these dynamics recur across market cycles.
Distinguishing a False Breakdown From a Genuine Trend Reversal
The distinction matters enormously for positioning. A genuine breakdown occurs when price violates support with conviction, confirmed by expanding volume across multiple sessions, and fails to recover the broken level on a retest. A false breakdown, by contrast, involves a brief, low-conviction violation that is rapidly absorbed, followed by a return to and recovery above the prior support zone.
Key Concept: A false breakdown occurs when price briefly violates a significant support level, triggering bearish entries and stop-losses, before reversing sharply higher. In precious metals markets, this pattern is historically associated with explosive upside recoveries when it aligns with a dominant bullish trend.
The bullish interpretation of this pattern is only valid under a specific set of conditions. Outside those conditions, what appears to be a false breakdown is simply the early stage of a genuine decline.
The Technical Indicators That Precede a False Breakdown in Gold and Silver
Recognising Overstretched Conditions Before the Reversal
False breakdowns do not occur in a vacuum. They are typically preceded by a measurable deterioration in momentum indicators, a contraction in participation, and a shift in positioning that creates the fuel for a sharp reversal when the trap is sprung. Traders who understand how to read these preconditions gain a significant timing advantage.
| Indicator Type | Bearish Extreme Signal | Bullish Implication |
|---|---|---|
| Sentiment Surveys | Historically low bullish readings | Contrarian buy signal |
| Momentum Oscillators | Deeply oversold on weekly charts | Mean reversion potential |
| Commitment of Traders | Large speculator net shorts at extremes | Fuel for short-covering rally |
| Volume Analysis | Low volume on breakdown candles | Lack of genuine selling conviction |
| Price Structure | Wick rejections below key support | Institutional absorption of supply |
Why Oversold Readings Alone Are Insufficient
A common mistake is treating oversold conditions as a standalone entry signal. Markets can remain technically stretched for extended periods before reversing, particularly when a genuine downtrend is in place. What elevates the false breakdown setup beyond a simple oversold bounce thesis is the convergence of multiple confirming factors simultaneously: low volume on the breakdown candle, sentiment extremes, a dominant uptrend structure, and a clean retest behaviour following the initial violation.
The Investor Psychology That Makes False Breakdowns So Effective
Why the Majority React Incorrectly at Precisely the Wrong Moment
Behavioural finance research consistently demonstrates that human decision-making under uncertainty is systematically biased toward pattern confirmation and loss avoidance. When price breaks below a visible support level, the prevailing narrative immediately shifts to validate the move. Financial media amplifies it. Social sentiment accelerates it. And the majority of investors who were previously neutral or slightly bullish capitulate precisely at the level where institutional accumulation is occurring.
Investor Psychology Insight: Market consensus turns most aggressively bearish at the exact moment institutional accumulation reaches its peak. When retail sentiment indicators register extreme pessimism, the probability of a sharp reversal historically increases rather than decreases.
This dynamic is reinforced by anchoring bias. Investors who purchased at higher prices use their entry point as a psychological anchor, and when price falls below that level, they interpret the breakdown as confirmation that their original thesis was wrong. This drives additional selling that has nothing to do with fundamental valuation and everything to do with emotional pressure management.
Stop-Loss Cascades and the Mechanics of Panic Selling
When a critical support level is approached, the concentration of stop-loss orders just below it creates a self-reinforcing mechanism. Once price touches that zone, automated stops are triggered, producing a rapid spike in sell volume. This acceleration of selling is then interpreted by technical traders as confirmation of a genuine breakdown, prompting discretionary selling on top of the automated flow. The entire sequence can unfold within a single trading session, creating the sharp, low-conviction wick that characterises a classic false breakdown candle. TradingView's silver analysis further illustrates why silver moves late and how traders consistently get trapped by these sequences.
Silver vs. Gold: Structural Differences and Why Both Metals Matter
Comparing the Two Metals During False Breakdown Phases
Silver and gold do not behave identically during false breakdown setups. Silver's smaller market size relative to gold means that institutional order flow has a proportionally larger price impact, amplifying both the false move lower and the subsequent recovery. This makes silver a more volatile expression of the same pattern, offering potentially larger percentage gains on confirmation but also carrying greater risk if the breakdown proves genuine.
| Metric | Gold (XAUUSD) | Silver (XAGUSD) |
|---|---|---|
| False Breakout Frequency | ~60-70% of breakouts are false | Higher volatility amplifies fakeouts |
| Institutional Stop Hunt Behaviour | Common near round-number levels | More aggressive near multi-year highs |
| Pattern Risk | Double top risk if unconfirmed | 20% downside risk in reversal scenario |
| Dominant Trend Alignment | Critical for bullish interpretation | Must confirm with gold's structure |
| Confirmation Timeframe | Two-day close beyond level preferred | Retest reaction candle required |
The Gold-Silver Ratio as a Secondary Directional Tool
The gold-silver ratio analysis, which measures how many ounces of silver are required to purchase one ounce of gold, provides a secondary lens for assessing the strength of a false breakdown setup. When the ratio is elevated and begins to compress simultaneously with a false breakdown forming in both metals, it historically signals that silver is prepared to outperform gold on the recovery. A declining ratio during the retest phase is a meaningful secondary confirmation that the bullish interpretation is gaining traction.
Conversely, a silver false breakdown that is not mirrored by a corresponding structure in gold carries substantially higher risk. The most reliable silver and gold false breakdown bullish setup configurations involve both metals aligning structurally, reinforcing each other's signals rather than diverging.
The Step-by-Step Validation Framework for Confirming a Bullish Setup
How to Distinguish a Genuine Signal From Noise
Without a disciplined confirmation process, the false breakdown setup becomes an exercise in wishful thinking. The following framework provides a structured methodology for validating the pattern before committing capital:
-
Identify the dominant trend direction. The false breakdown setup is only a bullish signal when it occurs within a pre-existing uptrend. A breakdown in a declining market is trend continuation, not a trap.
-
Wait for a full candle body close. Wick violations below support are noise. Only a complete candle body close beyond the level warrants attention as a potential signal.
-
Monitor volume on the breakdown candle. Authentic breakdowns arrive with expanding volume across multiple sessions. A low-volume breakdown, particularly during off-peak trading hours, is a strong indicator of a false move.
-
Require a retest of the broken level. After the initial false move, price must return to the violated support zone and produce a confirming reaction candle such as a hammer, bullish engulfing, or pin bar before entering.
-
Apply the two-day close rule. A genuine range break requires price to close outside the established range for a minimum of two consecutive sessions. Single-session violations are presumed false until follow-through confirms otherwise.
-
Cross-reference sentiment data. Extreme bearish readings in sentiment surveys or Commitment of Traders positioning at the moment of breakdown significantly increase the probability that the move is false.
Why the Retest Is the Most Critical Confirmation Step
The retest is the single most important element in the entire validation sequence. It separates the opportunistic entry from the emotional one. During the retest, price returns to the previously violated level from below, and the market's reaction to that zone reveals whether supply has genuinely been exhausted. A clean bounce with a confirming candle structure on above-average volume is the clearest signal available that the false breakdown interpretation is correct. Entering before the retest occurs dramatically increases exposure to the scenario in which the breakdown is genuine. In addition, shorting precious metals during these phases without retest confirmation is one of the most common and costly errors traders make.
The next major ASX story will hit our subscribers first
Warning Signs That a Breakdown Is Genuine, Not False
Not every support violation that looks like a false breakdown is one. The following conditions, when present, suggest the breakdown is real and that a bullish thesis should be abandoned:
-
Sustained high volume on breakdown candles across multiple sessions rather than a single spike indicates genuine distribution, not a stop hunt.
-
Failure to recover the broken level within one to two sessions after the initial violation removes the core condition required for the false breakdown interpretation to hold.
-
Power move sequences featuring multiple large bearish candles in rapid succession often signal momentum exhaustion in the bearish direction but can also indicate genuine trend acceleration lower.
-
Absence of retest behaviour is a critical warning. True breakdowns rarely return cleanly to the broken level, whereas false breakdowns almost universally do.
-
Divergence between gold and silver weakens any directional signal considerably. If one metal breaks support while the other holds, the structural case for either interpretation is undermined.
Risk Warning: Not every oversold condition or sentiment extreme produces a false breakdown recovery. The bullish interpretation is only valid when the dominant trend is upward, volume is absent on the breakdown, and a clean retest with a confirming reaction candle occurs. Without these conditions, the pattern defaults to a bearish continuation signal.
Macro Conditions That Amplify the Bullish False Breakdown Setup
Monetary Policy Uncertainty and the Precious Metals Volatility Premium
The macro environment surrounding a false breakdown setup matters as much as the technical structure itself. Periods of heightened uncertainty around central bank policy, particularly when markets are pricing in competing scenarios of rate cuts versus sustained restrictiveness, create the ideal conditions for false breakdown traps in gold and silver. Central banks influencing gold pricing is a foundational factor, and when that influence generates positioning extremes in one direction, the forced unwind of those positions creates the precise technical conditions for a false breakdown followed by a sharp recovery.
Real interest rates are a foundational driver of precious metals pricing. When real rates are falling or expected to fall, the opportunity cost of holding non-yielding assets like gold and silver declines, creating a structural tailwind for the metals. A false breakdown that occurs against a backdrop of declining real rates is far more likely to resolve bullishly than one occurring in an environment of rising real yields.
Geopolitical Risk Premiums and Their Re-Entry Pattern
Precious metals frequently embed a gold safe-haven demand premium during periods of elevated global uncertainty. When that premium is briefly stripped out during a technical correction or false breakdown, it tends to re-enter pricing rapidly once conditions stabilise. This re-entry of the risk premium can accelerate the recovery phase of a false breakdown, producing sharper and faster moves than the underlying technical structure alone would suggest.
Scenario Analysis: Three Possible Outcomes
Scenario 1: Bullish Confirmation
Conditions required: Dominant uptrend intact, low-volume breakdown, successful retest with reaction candle, two-day close recovery above support.
Expected outcome: A short-covering rally develops as bearish participants are forced to cover positions, amplified by institutional re-accumulation at discounted prices. This is the base case when all confirmation criteria are met.
Scenario 2: Bearish Continuation
Conditions present: No dominant uptrend, high-volume breakdown, failure to retest broken level, follow-through lower across subsequent sessions.
Expected outcome: The breakdown is genuine. Downside risk of 15-20% in silver and proportionally smaller in gold must be managed with defined stop-loss levels. The apparent false move was a consolidation pause rather than a trap.
Scenario 3: Extended Consolidation
Conditions present: Mixed signals across volume, sentiment, and structure; gold and silver diverging in behaviour.
Expected outcome: Price enters a wide consolidation range that frustrates participants on both sides before eventually resolving in the direction of the dominant macro trend. This is, however, a less common outcome when the silver and gold false breakdown bullish setup criteria are partially but not fully met.
Positioning Strategy for the Silver and Gold False Breakdown Bullish Setup
Entry Timing, Position Sizing, and Stop-Loss Logic
Positioning Principle: The optimal entry in a false breakdown setup is never at the point of maximum fear. It is at the point of confirmed recovery. Entering during the breakdown itself, before retest confirmation, dramatically increases the risk of being caught in a genuine reversal.
Effective position sizing in high-volatility precious metals setups requires accounting for the wider price swings that characterise both the false move phase and the recovery phase. Entering at the retest rather than at the initial breakdown reduces the distance from entry to the invalidation level, allowing tighter stop placement without sacrificing logical risk definition. Furthermore, Axiory's inverse head and shoulders analysis on silver demonstrates how complementary pattern structures can reinforce the bullish case during these setups.
Stop-loss placement should be positioned beyond the lowest wick of the false breakdown candle. A close below that level on a full candle body basis signals that the breakdown has extended beyond the range consistent with a false move and that the bearish continuation scenario is gaining probability. Defining this invalidation level before entry is non-negotiable for managing risk in a pattern that carries a 20% downside scenario if the bullish interpretation is incorrect.
Key Takeaways at a Glance
| Concept | Summary |
|---|---|
| False Breakdown Definition | Price briefly violates support before reversing; bullish when trend-aligned |
| Confirmation Requirement | Full candle body close, low volume, retest reaction candle, two-day close |
| Sentiment Catalyst | Extreme bearish readings increase false breakdown probability |
| Silver vs. Gold Alignment | Both metals confirming simultaneously strengthens the bullish case |
| Primary Risk | Genuine breakdown if volume is high and no retest occurs |
| Dominant Trend Requirement | Setup is only bullish within a pre-existing uptrend |
| Macro Amplifier | Declining real rates and geopolitical risk premium re-entry accelerate recovery |
Disclaimer: This article is provided for informational and educational purposes only and does not constitute financial or investment advice. Precious metals markets involve substantial risk, and past technical patterns do not guarantee future outcomes. All scenario analyses and statistical references are based on historical observations and should not be relied upon as predictions of future price behaviour. Readers should conduct their own due diligence and consult a qualified financial adviser before making investment decisions.
Want to Stay Ahead of Significant ASX Mineral Discoveries Before the Broader Market Reacts?
While mastering false breakdown setups in precious metals sharpens your technical edge, Discovery Alert's proprietary Discovery IQ model delivers real-time alerts on significant ASX mineral discoveries — instantly translating complex data into actionable opportunities for both traders and long-term investors. Explore historic discovery returns on Discovery Alert's dedicated discoveries page and begin your 14-day free trial today to secure a genuine market-leading advantage.