May 22, 2026
The Energy Transition Is Running on a Metal Most Investors Still Misunderstand
Consider what happens when three separate technology adoption curves accelerate simultaneously and all three require the same physical input. Not a manufactured component that can be substituted or engineered around, but a raw elemental property that cannot be replicated. That is the position silver occupies in the global economy today, and understanding why requires looking beyond the monetary narrative that dominates most precious metals commentary.
Silver industrial demand solar EVs and the supply gap are converging into a single market dynamic that has no direct historical precedent. Silver supply deficits, alongside solar PV manufacturing, electric vehicle electrification, and byproduct mining dependency, are mapped here from first principles, stress-tested across scenarios, and examined for implications that most standard commodity reporting leaves on the table.
When big ASX news breaks, our subscribers know first
Why Silver's Industrial Demand Profile Is Structurally Different From Any Prior Commodity Supercycle
Most commodity booms throughout history have been driven by a single dominant end-use. Steel demand surged during industrialisation. Copper tightened during the infrastructure buildout of the 2000s. Oil cycles have tracked transportation and petrochemical demand with reasonable predictability.
Silver's current demand profile breaks that pattern entirely. Three separate technology sectors are simultaneously expanding their consumption of the same material, and each is being driven by its own independent adoption curve rather than by a shared macro variable like GDP growth or construction activity.
Those three vectors are:
- Solar photovoltaic manufacturing, where silver paste forms the conductive grid on every silicon cell
- Electric vehicle electrification, where higher-voltage power systems require roughly double the silver content of a combustion vehicle
- AI infrastructure and data centre electronics, where silver's unmatched electrical conductivity makes it the preferred material for high-performance computing components and advanced semiconductor packaging
The physical property anchoring all three is silver's position at the top of the electrical conductivity rankings. No commercially viable substitute exists that matches its performance at scale. That single fact transforms what might otherwise be a cyclical demand story into something considerably more durable. Furthermore, silver's dual role as both a monetary metal and industrial input makes it uniquely positioned in the current environment.
Structural Note: Technology adoption curves, unlike commodity cycles, tend to be self-reinforcing and one-directional once critical infrastructure mass is reached. Solar farms and EV fleets do not get decommissioned when silver prices rise. The demand they represent is permanently embedded.
How Large Is Silver Industrial Demand, and How Fast Is It Growing?
Mapping the Full Industrial Demand Landscape in 2024
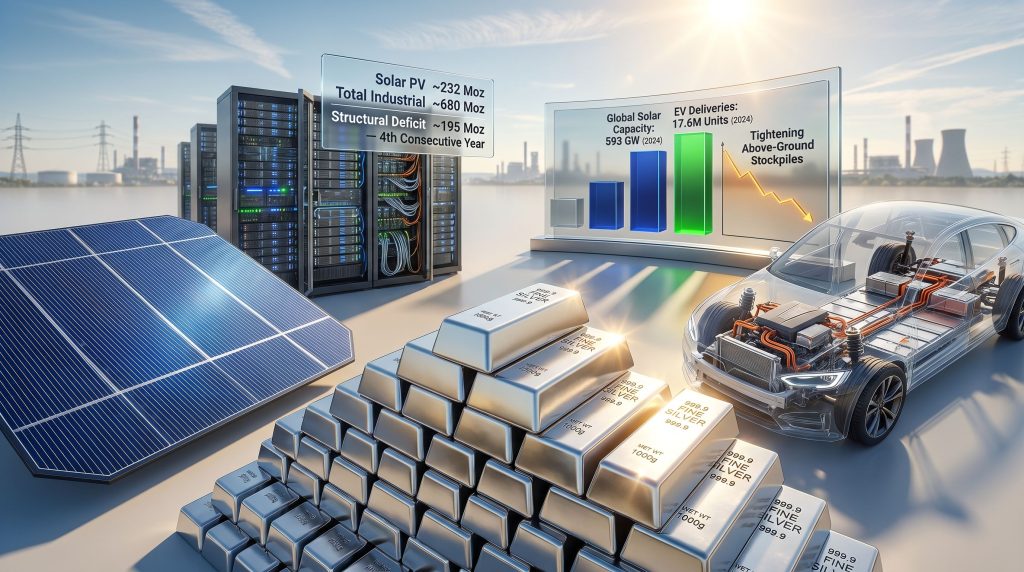
Industrial applications consumed approximately 680 million troy ounces in 2024, representing roughly 56% of total global silver demand of approximately 1,219 million troy ounces, according to the Silver Institute's supply and demand data. That means more than half of every ounce extracted globally is being consumed by manufacturing and energy infrastructure rather than flowing into investment vehicles or jewellery.
The breakdown across the four primary industrial categories is instructive:
| Industrial Category | Estimated 2024 Consumption (Moz) | Share of Industrial Demand |
|---|---|---|
| Electrical & Electronics (excl. solar) | ~220 Moz | ~32% |
| Solar Photovoltaics | ~232 Moz | ~34% |
| Automotive (combustion + EV) | ~72 Moz | ~11% |
| Other Industrial | ~156 Moz | ~23% |
| Total Industrial | ~680 Moz | 100% |
Source: Silver Institute, World Silver Survey 2025
What the table does not fully convey is the velocity of change within these categories. Solar PV silver demand has grown approximately 12-fold over the past decade, moving from a marginal end-use to the second-largest industrial category. Global solar capacity additions reached a record 593 gigawatts in 2024, up from approximately 75 GW in 2016, according to the IEA's Renewables 2024 report.
This is not cyclical expansion. It is a technology adoption curve that has reached the steep part of its S-curve.
The Solar PV Scenario: What Actually Happens Inside a Panel
The Physics of Silver in Photovoltaic Manufacturing
Every silicon solar cell has a network of fine metallic lines printed across its surface. Those lines, visible as a grid pattern on a panel's face, are formed by screen-printing a silver-based conductive paste onto the cell. Their function is to collect the electrons freed by incoming photons and route them efficiently to the external circuit. Without them, the generated electricity has no pathway out.
The industry has progressively reduced the volume of silver paste required per cell through a technique called thrifting, which combines finer line printing geometry with paste chemistry optimisation. This process is real and ongoing. However, the total volume of solar silver demand has continued rising because deployment growth has consistently outpaced per-unit reductions in silver content.
The Heterojunction Technology (HJT) Wildcard
A less widely discussed but potentially pivotal variable is the transition underway from PERC cell architecture to next-generation heterojunction technology. HJT cells achieve higher conversion efficiencies partly because their manufacturing process requires low-temperature silver paste, which currently cannot be thrifted to the same degree as PERC paste.
Consequently, HJT cells require approximately two to three times more silver per cell than the PERC architecture they are progressively replacing. As HJT market share expands in the second half of this decade, silver intensity per gigawatt of installed capacity is likely to increase before any further thrifting reductions take effect. This is one of the more underappreciated variables in solar silver demand modelling.
Solar Demand Projections: Three Scenarios
| Scenario | Key Assumption | Projected Solar Silver Demand (2025-2030) |
|---|---|---|
| Conservative | Thrifting offsets 50% of deployment growth | ~220-240 Moz/year |
| Base Case | Thrifting offsets 30%, HJT adoption moderate | ~250-270 Moz/year |
| Accelerated | HJT scales rapidly, deployment exceeds IEA forecasts | ~290-320 Moz/year |
Projections are illustrative scenario estimates based on IEA Renewables 2024 and Silver Institute World Silver Survey 2025 data. These are not guaranteed outcomes.
The EV Scenario: Silver in the Vehicle's Electrical Architecture
What Silver Actually Does in an Electric Vehicle
One of the most persistent misconceptions about silver and electric vehicles is that the relevant silver content is in the battery. It is not. EV batteries operate on lithium-ion chemistry involving lithium, cobalt, nickel, and manganese. Silver's role is distributed across the vehicle's broader electrical architecture.
Every relay, fuse, membrane switch, thermal management circuit, and onboard charging management unit in a modern vehicle contains silver contacts or silver-bearing components. Silver is used in these applications because its conductivity and resistance to arc erosion under high-current switching conditions are unmatched by cost-effective alternatives.
The silver content comparison between vehicle types is stark:
- A conventional internal combustion vehicle uses approximately 15 to 28 grams of silver
- A battery electric vehicle uses approximately 25 to 50 grams, roughly double, due to higher-voltage systems and more complex power management requirements (Silver Institute, World Silver Survey 2025)
The EV Volume Trajectory and Its Silver Implications
Global EV deliveries reached 17.6 million units in 2024, according to BloombergNEF's Electric Vehicle Outlook 2025. The same source projects annual global EV deliveries of 65 to 75 million units by 2030. Total automotive silver demand across both combustion and electric vehicles reached approximately 72 million troy ounces in 2024.
Scenario Calculation: At 70 million annual EV deliveries by 2030, applying a midpoint of 37.5 grams per vehicle, EV-specific silver demand alone would approach approximately 84 million troy ounces per year before accounting for hybrid vehicles, charging infrastructure, or associated grid upgrade requirements.
The Grid Amplification Effect
The interconnection between demand vectors is one of the least-discussed aspects of silver industrial demand solar EVs and the supply gap. More electric vehicles require more charging infrastructure. More charging infrastructure requires grid upgrades. Grid modernisation programmes at scale require silver-intensive switchgear, relay systems, and smart metering components.
These vectors are not simply additive. They are mutually reinforcing in ways that make demand modelling increasingly complex and the total supply requirement harder to satisfy through incremental mining expansion alone.
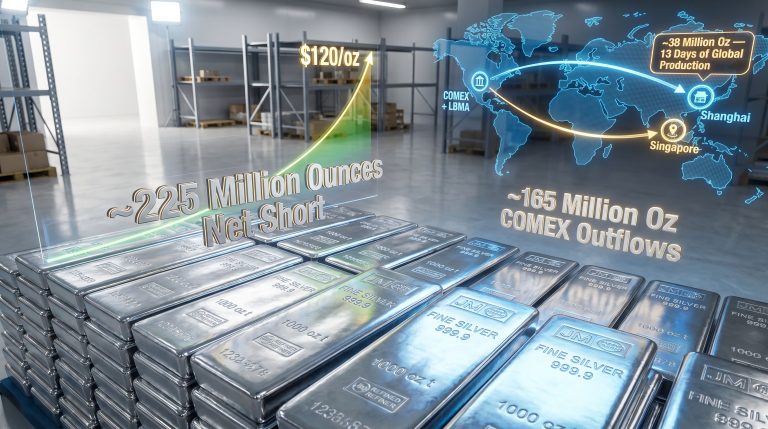
What Does the Supply Side Actually Look Like?
The Structural Constraint: Silver as a Byproduct Metal
Approximately 70% of global silver supply is extracted as a byproduct of mining other metals, primarily copper, zinc, and lead, according to the Silver Institute's World Silver Survey 2025. This single fact creates a supply ceiling that no silver price signal can rapidly overcome. For context, global silver production figures underscore just how concentrated and constrained the primary mining base remains.
When silver demand rises, the conventional market response of higher prices incentivising new production does not function effectively. New silver mines are not opened because silver prices increase. Silver supply expands when copper, zinc, or lead economics justify expanding primary operations in those metals, and byproduct silver flows as a consequence.
Critical Constraint: This supply inelasticity is not a temporary bottleneck that capital expenditure can solve. It is a permanent structural feature of how the metal is produced. The mining industry's response to silver demand growth will always lag, and that lag cannot be engineered away.
2024 Supply and Demand Metrics
| Supply Component | 2024 Volume | Year-on-Year Change |
|---|---|---|
| Global Mine Production | ~844 Moz | +0.9% |
| Recycling | ~194 Moz | Modest increase |
| Total Supply | ~1,038 Moz | — |
| Total Demand | ~1,219 Moz | — |
| Structural Deficit | ~195 Moz | 4th consecutive year |
Source: Silver Institute, World Silver Survey 2025
The Silver Institute documented a supply shortfall for each of the four consecutive years through 2024. This is a persistent, multi-year structural imbalance rather than a single-year anomaly. The 2025 projected deficit is estimated at approximately 117.6 million ounces by some industry analysts, though forward estimates carry inherent uncertainty and should not be treated as guaranteed outcomes.
Why Recycling Cannot Close the Gap
Silver recycling contributed approximately 193.9 million ounces in 2024, a meaningful contribution but structurally insufficient to offset the deficit. The more important point is that a large proportion of industrially consumed silver is practically non-recoverable under current economics.
Silver embedded in solar cells is distributed across a glass-sealed laminate structure in quantities measured in milligrams per cell. Silver in semiconductor wafers and electronic components is alloyed, plated, or bonded in configurations that make extraction economically unviable at current technology and price levels. This means that industrial silver consumption functions as a one-way removal from the above-ground supply pool.
New mine development timelines typically span 7 to 12 years from discovery to production, and the byproduct dependency structure means that even confirmed copper and zinc project pipelines will not automatically translate into proportional silver supply growth. Indeed, as this analysis of why the world needs more silver than it can mine illustrates, the gap between structural demand and available supply is far from a short-term phenomenon.
The next major ASX story will hit our subscribers first
How Silver's Dual-Demand Structure Shapes Price Behaviour
The Industrial Floor and the Monetary Amplifier
Silver's price dynamics are shaped by two partially independent demand systems operating simultaneously. Industrial consumption establishes a baseline that exceeds 56% of annual demand and is structurally tied to manufacturing and energy infrastructure rather than financial market sentiment. Monetary demand, driven by inflation expectations, real yield movements, currency concerns, and gold-silver ratio dynamics, functions as an amplifier layered on top of that industrial base.
The distinction matters for investors because it means silver's price can receive simultaneous support from two entirely unrelated mechanisms. An acceleration in solar deployment that tightens physical supply has no logical connection to a shift in central bank policy or inflation expectations, yet both can compress available inventory and drive price in the same direction at the same time.
When Both Engines Fire Together
Historical periods where strong industrial activity and accommodative monetary conditions coincided have produced some of silver's most significant outperformance relative to gold. Examining silver versus gold performance reveals that the ratio compresses during these windows as silver closes ground against gold's monetary premium. Conversely, the 2022 industrial contraction demonstrated the opposite mechanism: when manufacturing activity softens, silver can underperform gold even when monetary conditions remain supportive, because the industrial drag counteracts the monetary tailwind.
Volatility as a Structural Feature
Silver's higher volatility relative to gold is not a defect in the investment case. It is the predictable outcome of having two large, partially independent demand drivers that do not always move in the same direction. An investor who understands the structural supply deficit and the technology adoption curves underpinning industrial demand can contextualise that volatility within a framework rather than treating short-term price swings as signal noise.
Frequently Asked Questions: Silver Industrial Demand, Solar, EVs, and the Supply Gap
What percentage of global silver demand comes from industrial applications?
Approximately 56% of total annual silver consumption, roughly 680 million troy ounces in 2024, is absorbed by industrial end-uses including electronics, solar photovoltaics, automotive systems, and other manufacturing applications. This industrial component operates independently of investor sentiment and is driven by technology deployment and manufacturing output.
How much silver does a solar panel use, and is that amount declining?
Each solar cell uses silver paste to form the conductive grid lines that transfer generated electricity. While manufacturers have progressively reduced silver content per cell through thrifting, total solar silver demand reached approximately 232 million troy ounces in 2024, roughly 34% of all industrial silver consumption, because deployment volumes have grown faster than per-unit reductions. Next-generation heterojunction cells require two to three times more silver than current standard cells, which may increase silver intensity per gigawatt before further thrifting effects take hold.
How much silver is in an electric vehicle compared to a combustion vehicle?
A conventional combustion vehicle uses approximately 15 to 28 grams of silver across its electrical systems. A battery electric vehicle uses approximately 25 to 50 grams, primarily in relays, fuses, thermal management circuits, and charging management systems. As global EV deliveries scale from 17.6 million units in 2024 toward a projected 65 to 75 million annually by 2030, automotive silver demand is expected to grow materially.
Why can't silver miners simply increase production to meet rising demand?
Approximately 70% of silver is extracted as a byproduct of mining copper, zinc, and lead. Production volumes are therefore governed by the economics of those base metals, not by silver's own price. This creates a structural supply ceiling that cannot be rapidly unlocked by silver price signals alone, making the supply response to demand growth inherently slow and limited regardless of price incentive.
How long has the silver market been running a structural deficit?
The Silver Institute documented a supply shortfall in each of the four consecutive years through 2024. The 2024 deficit reached approximately 195 million troy ounces. The gap is currently being absorbed by above-ground stockpiles, which are finite and non-renewable.
Does AI and data centre growth add to silver industrial demand?
Yes. Beyond solar and EVs, the rapid expansion of AI infrastructure and data centres is contributing to elevated demand in the electrical and electronics segment. Silver's conductivity properties make it a preferred material in high-performance computing components and advanced chip packaging, adding a third major technology-driven demand vector alongside solar and automotive electrification.
The Long-Term Structural Picture: Key Variables and Scenario Outcomes
Key Variables to Monitor
Four variables will most directly determine how the silver supply-demand balance evolves through 2030:
- HJT solar cell adoption rate: A faster transition to HJT architecture increases silver intensity per gigawatt of installed capacity, potentially offsetting thrifting gains for several years
- Global EV production ramp: Each percentage point of EV market penetration adds incremental silver demand across the automotive supply chain, with multiplier effects through charging and grid infrastructure
- Base metal mining economics: Copper and zinc price cycles, capital allocation decisions, and new project development timelines will collectively determine whether byproduct silver supply can expand meaningfully before the demand growth fully outpaces available inventory
- Above-ground inventory drawdown rates: The pace at which existing stockpiles are being consumed provides the most direct real-time signal of how tight physical availability is becoming
Scenario Summary: Three Paths to 2030
| Scenario | Key Assumption | Implied Market Condition |
|---|---|---|
| Structural Tightening | HJT scales, EV ramp meets forecasts, mine supply grows less than 2% per year | Persistent and widening deficit; accelerating stockpile drawdown |
| Managed Tension | Thrifting offsets HJT gains, EV growth moderate, recycling improves | Deficit continues but narrows; price support maintained |
| Supply Catch-Up | Major copper and zinc expansions lift byproduct silver; demand growth slows | Deficit closes; price pressure eases; monetary demand becomes primary driver |
These are scenario projections for illustrative purposes and do not constitute investment advice or guaranteed forecasts.
Analytical Note: The base-case scenario across most industry forecasts sits closest to Structural Tightening through at least 2027, given current mine development pipelines and the confirmed scale of solar and EV deployment commitments already in progress globally.
Reframing Silver as an Industrial Materials Story
The most useful shift in analytical framing for understanding silver's medium-term outlook is moving away from a purely monetary lens and toward a materials science and energy transition perspective. The monetary role remains relevant and can amplify price movements when conditions align. However, the structural foundation being built by technology adoption in solar, EVs, and advanced electronics creates a demand floor that is largely independent of financial market sentiment.
That foundation is, by its nature, more durable than any single macro cycle. Solar farms commissioned today will consume silver for twenty-five years. EV fleets scaling through the remainder of this decade will embed silver demand permanently into the automotive supply chain at volumes that dwarf current combustion-era consumption. Above-ground stockpiles absorbing annual deficits are not replenishable on any timeline relevant to near or medium-term market dynamics.
Understanding the interplay underpinning silver industrial demand solar EVs and the supply gap is not a speculative exercise. It is an attempt to accurately characterise the market structure that will govern price behaviour for the foreseeable future.
Disclaimer: This article is for informational and educational purposes only. It does not constitute investment advice. All projections and scenario estimates are illustrative and based on publicly available data from the Silver Institute World Silver Survey 2025, BloombergNEF Electric Vehicle Outlook 2025, and IEA Renewables 2024. Past performance and historical patterns do not guarantee future results. Please consult a qualified financial adviser before making any investment decisions.
Want To Be First When the Next Major Silver Discovery Hits the ASX?
Discovery Alert's proprietary Discovery IQ model scans ASX announcements in real time, instantly identifying significant mineral discoveries — including silver — and translating complex data into actionable opportunities for both short-term traders and long-term investors. Explore how historic discoveries have generated extraordinary returns on Discovery Alert's dedicated discoveries page, and begin your 14-day free trial today to position yourself ahead of the market.