June 13, 2026

The precious metals sector operates within cycles that span decades, where structural imbalances can persist far longer than traditional commodity markets would suggest. Unlike agricultural products or energy resources that experience rapid supply responses to price signals, a silver market deficit emerges when annual consumption systematically exceeds new production plus recycling, forcing market participants to draw down accumulated inventory stocks to meet demand.
Understanding the mechanics behind these structural imbalances requires examining both the supply-side limitations inherent in precious metal extraction and the evolving demand patterns across industrial applications. Silver's dual nature as both a monetary metal and critical industrial input creates competing claims on available supply, while its status as primarily a byproduct of base metal mining limits responsive production increases even during extended price rallies.
Understanding the Structural Forces Behind Silver Market Deficits
Supply-Side Production Constraints
The global silver market deficit stems from fundamental production limitations that distinguish this metal from other commodities. Primary silver mines contribute only 30% of total global output, with the remaining 70% extracted as byproducts during copper, lead, and zinc mining operations. This production structure means that silver supply decisions are largely determined by economics in other commodity markets rather than silver-specific demand signals.
Mexican operations, which represent 23% of global silver production, experienced operational pressures in 2025 that contributed to a 3% decline in North American mine output to decade-low levels. The World Silver Survey 2026, produced by Metals Focus for the Silver Institute, documents how declining ore grades and operational challenges across key producing regions continue limiting supply responsiveness despite elevated price levels.
Global silver mine production is projected to remain flat in 2026, indicating that even after silver's 147% price surge in 2025, new production capacity has not materialised. This reflects the long lead times required for mine development and the structural nature of byproduct supply constraints.
Industrial Demand Fundamentals Creating Permanent Stock Depletion
Industrial applications consume silver in microscopic quantities that become permanently embedded in manufactured products, creating irreversible stock depletion unlike investment demand that can return metal to markets. Approximately 60% of annual silver demand stems from these irreversible industrial uses, where the metal's unique properties—highest electrical and thermal conductivity of all elements—make substitution technically challenging.
Furthermore, significant silver supply deficits have emerged across multiple industrial sectors. The electronics sector demonstrates this dynamic clearly: while electrical and electronics demand fell 2% in 2025 according to industry data, structural growth in artificial intelligence infrastructure, automotive applications, and power grid modernisation offset weakness in photovoltaic manufacturing.
This pattern reveals that even during demand contractions, certain end-uses continue consuming silver in applications where recovery remains economically unviable. Photovoltaic manufacturers accelerated thrifting and substitution efforts in 2025 as intense competition combined with rising raw material costs, yet solar installations still consumed approximately 140 million ounces, representing 12% of total global demand.
Byproduct Production Dependencies
Silver's classification as predominantly a byproduct metal creates unique supply vulnerabilities not found in primary commodity markets. Base metal mining operations make production decisions based on copper, lead, or zinc economics rather than silver prices, meaning that silver supply cannot respond directly to deficit conditions through increased production incentives.
This structural limitation becomes particularly pronounced during periods when base metal markets experience operational challenges or economic pressures. Grade decline at existing operations further compounds these constraints, as lower silver content in ore bodies reduces byproduct recovery even when base metal production remains stable.
The concentration of refining capacity also creates potential supply chain vulnerabilities, with China controlling approximately 40% of global silver refining capacity. This geographic concentration introduces additional complexity to supply chain management during periods of geopolitical tension or trade policy changes.
When big ASX news breaks, our subscribers know first
Quantifying the Current Silver Market Deficit Scale
Historical Deficit Progression and 2026 Projections
The persistence of silver market deficits across six consecutive years represents an unprecedented period of structural undersupply in modern precious metals markets. Data from the World Silver Survey 2026 reveals the escalating severity of these imbalances:
| Year | Deficit (Million Oz) | Total Supply (Billion Oz) | Total Demand (Billion Oz) |
|---|---|---|---|
| 2021 | 35.7 | 1.05 | 1.09 |
| 2022 | 42.1 | 1.04 | 1.08 |
| 2023 | 38.9 | 1.06 | 1.10 |
| 2024 | 40.8 | 1.07 | 1.11 |
| 2025 | 40.3 | 1.08 | 1.13 |
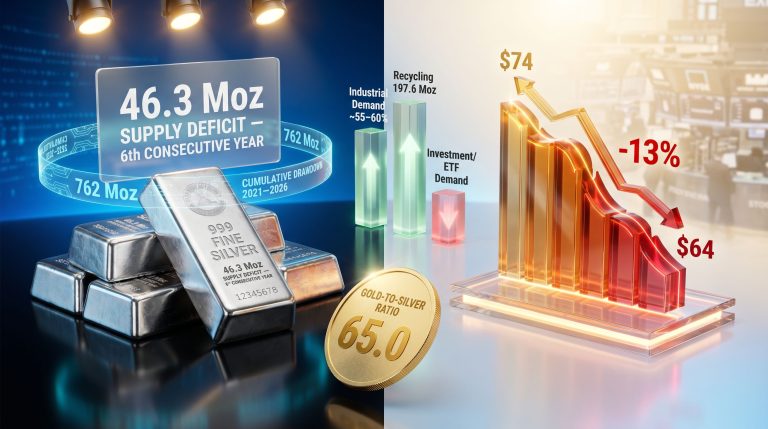
| 2026E | 46.3 | 1.05 | 1.11 |
The projected 2026 deficit of 46.3 million ounces represents the widest gap in this six-year period, occurring despite forecasts for total demand to decline 2% to 1.11 billion ounces. This widening silver market deficit during a demand contraction period highlights that supply constraints rather than demand surges drive the structural imbalance.
Cumulative Stock Drawdown Analysis
Since 2021, approximately 762 million ounces have been withdrawn from above-ground inventories to satisfy market demand that exceeds annual mine production plus recycling capacity. This cumulative drawdown represents the systematic depletion of accumulated silver stocks built up over previous decades.
To contextualise this depletion, 762 million ounces equals roughly eight to nine months of current global mine production, representing a significant portion of readily available silver inventory. This non-renewable stock consumption creates an increasingly precarious supply situation, as accumulated inventories cannot be depleted indefinitely.
The geographic distribution of this stock drawdown reveals important market dynamics. London vault inventories, which serve as the benchmark for global silver trading, showed dramatic fluctuations in available metal throughout 2025. According to Reuters analysis, only 17% of the 884 million ounces held in London vaults in September 2025 were not tied to exchange-traded products and were potentially available to support market liquidity—a historic low that precipitated unprecedented lease rate conditions.
Market Liquidity Crisis and Recovery Patterns
The October 2025 liquidity squeeze in London markets provides a concrete example of how structural deficits translate into acute market dysfunction. The crisis emerged from the convergence of multiple factors:
- Falling inventories in benchmark London markets
- Dramatic shifts of metal into CME vaults in the United States
- Rising exchange-traded product holdings concentrating available supply
- Surge in physical bar and coin demand creating competing claims on available metal
This combination created unprecedented conditions for lease rates and prices, demonstrating the sensitivity of silver markets to physical availability constraints. By March 2026, conditions had improved as metal flowed back from the United States, ETPs experienced outflows, and Indian demand moderated, increasing the available inventory share to 28% of London vault holdings.
However, industry experts note that the underlying structural conditions creating liquidity squeeze potential remain in place. The recovery was driven by temporary behavioural shifts rather than fundamental supply-demand rebalancing, suggesting vulnerability to renewed disruptions if demand patterns shift again.
Industrial Applications Driving Persistent Silver Demand
Solar Photovoltaic Manufacturing Dynamics
Solar panel production consumed approximately 140 million ounces of silver in 2025, representing 12% of total global demand despite manufacturer efforts to reduce silver intensity. The photovoltaic industry faces a complex balancing act between reducing raw material costs and maintaining the electrical performance that makes silver essential for solar cell efficiency.
Silver paste application in photovoltaic cells achieves optimal electrical conductivity that alternative materials have not yet matched while maintaining the 25-30 year operational lifespan required for solar installations. Current thrifting efforts typically reduce silver content from approximately 12 grams per watt to 10 grams per watt, but technical limitations prevent further reductions without compromising performance.
The industry's response to rising silver costs in 2025 accelerated substitution research, yet the continued reliance on silver demonstrates the technical challenges involved. Copper-based alternatives and other conductive materials face durability and efficiency constraints that limit commercial viability for high-performance solar applications.
Electronics and Automotive Sector Evolution
The electronics sector experienced a 2% demand decline in 2025, yet this aggregate figure masks divergent trends within subsectors. However, advances in mining industry innovation continue to drive efficiency improvements across production processes. Structural growth in artificial intelligence infrastructure, automotive electronics, and power grid modernisation offset weakness in photovoltaic demand, illustrating the diverse applications driving silver consumption.
Key growth areas include:
- Advanced driver assistance systems (ADAS) requiring silver circuits and sensors
- Electric vehicle charging infrastructure utilising silver solder and connectors
- 5G telecommunications equipment demanding high-performance electrical connections
- AI data centre infrastructure requiring superior thermal management capabilities
Automotive applications represent a particularly dynamic growth segment, where silver's unique combination of electrical conductivity, thermal properties, and corrosion resistance proves essential for electronic systems requiring long-term reliability in harsh operating environments.
Medical and Antimicrobial Applications
Silver's antimicrobial properties drive consistent demand across medical device manufacturing, water purification systems, and antimicrobial coatings. These applications demonstrate resilient growth characteristics that remain relatively insulated from economic cycle fluctuations.
The medical sector's silver consumption benefits from regulatory requirements for antimicrobial efficacy in healthcare environments, creating sustained demand that proves less sensitive to price fluctuations than industrial applications. This demand stability contributes to the baseline consumption floor that supports persistent deficit conditions.
Investment Market Response to Structural Deficits
Physical Silver Investment Surge Patterns
Investment demand responded dramatically to deficit conditions and price appreciation during 2025, with coin and bar purchases rising 14% to reach 185 million ounces. This surge demonstrates investor recognition of supply scarcity and price appreciation potential, creating additional competing claims on limited available metal.
Regional investment patterns revealed:
- India: 33% increase in physical silver purchases
- Europe: First growth in three years after extended decline
- Middle East and China: Multi-fold gains in investment demand
- United States: Third consecutive year of declines due to profit-taking and reduced safe-haven demand
Exchange-traded product inflows added 45 million ounces in net additions during 2025, concentrating physical metal in allocated storage facilities and reducing available inventory for industrial users and other market participants.
Price Volatility and Market Psychology
Silver experienced extraordinary price volatility in 2025-2026, reaching a record high of $121.6 per ounce on January 29, 2026, following a 147% surge across 2025. This peak was followed by a sharp 35% correction by early April 2026, bringing prices to the mid-$70s per ounce range.
The annual average price for 2025 showed a 42% increase, demonstrating sustained elevation despite short-term volatility. This price performance reflects both the structural deficit conditions and the psychological market dynamics that emerge when physical supply constraints become apparent to market participants.
Lease rate spikes in London markets during October 2025 created unprecedented trading conditions, indicating extreme tightness in available silver for short-term lending. These rate increases signal market stress that extends beyond simple price appreciation into fundamental availability constraints.
Portfolio Allocation Considerations
For investors seeking to capitalise on these market dynamics, consulting a comprehensive investing guide 2025 can provide valuable strategic insights. Silver's dual characteristics as both industrial commodity and monetary metal provide unique portfolio diversification benefits during periods of structural deficit. The metal offers inflation protection through its industrial demand base while maintaining safe-haven characteristics during geopolitical uncertainty.
Investment approach considerations include:
- Physical allocated storage for large position management
- Coin and bar accumulation for smaller portfolio allocations
- Geographic storage diversification for liquidity and security optimisation
- Timing strategies that account for volatile price patterns and market psychology
The industrial demand component provides economic growth exposure that distinguishes silver from gold, while the monetary metal aspects offer protection against currency debasement concerns and sovereign debt risks.
Geopolitical Factors Influencing Silver Market Dynamics
Supply Chain Geographic Concentration
Global silver mine production demonstrates significant geographic concentration that creates potential supply chain vulnerabilities during periods of geopolitical tension or trade policy changes. The top five producing countries control 65% of worldwide mine output:
| Country | Production Share | Strategic Considerations |
|---|---|---|
| Mexico | 23% | Largest global producer, operational pressures |
| Peru | 18% | Political stability considerations |
| China | 12% | Dual role as producer and processor |
| Chile | 10% | Mining infrastructure dependencies |
| Australia | 8% | Stable jurisdiction, high costs |
Mexico's position as the world's largest silver producer makes operational disruptions particularly significant for global supply conditions. The 3% decline in North American mine production during 2025 illustrates how regional operational challenges can compound global supply constraints.
China's role extends beyond mining production to include approximately 40% of global silver refining capacity, creating additional supply chain concentration risks. This processing dominance means that trade policy changes or operational disruptions in Chinese facilities could impact global silver availability regardless of mine production levels.
Currency and Monetary Policy Implications
Silver's historical monetary metal status provides hedging characteristics against currency devaluation and monetary policy uncertainty. During periods of elevated sovereign debt concerns and questions about the future role of reserve currencies, silver offers an alternative store of value with industrial utility backing.
Recent geopolitical tensions have prompted discussions about strategic metal reserves and potential export restrictions on critical materials. While silver has not yet been classified as a strategic metal in most jurisdictions, its importance for solar energy, electronics, and defence applications could influence future policy considerations.
The dual nature of silver as both monetary metal and industrial commodity creates unique positioning during periods when traditional monetary policy tools face limitations. Unlike purely financial assets, silver maintains intrinsic value through industrial applications even during periods of financial market stress.
Trade Policy and Export Control Potential
The concentration of silver refining capacity and the metal's importance for renewable energy infrastructure create potential vulnerabilities to trade policy changes. Export restrictions on silver or silver-containing products could significantly impact global supply chains for solar panel manufacturing and electronics production.
Recent examples in other critical materials markets demonstrate how quickly export policies can change during periods of international tension. Silver's strategic importance for energy transition technologies and advanced manufacturing could influence future trade policy considerations, particularly if deficit conditions persist.
Factors That Could Alleviate Future Silver Market Deficits
Technological Substitution Research and Development
Materials science research continues investigating alternatives to silver in key applications, though commercial viability remains years away for most promising technologies. Copper nanowires, carbon nanotubes, and advanced aluminium conductors represent potential substitutes under development for specific applications.
Current substitution research focuses on:
- Solar photovoltaic applications: Copper plating and screen-printing alternatives
- Electronics manufacturing: Conductive polymers and metal composites
- Automotive systems: Cost-optimised connector materials
- Medical devices: Alternative antimicrobial treatments
However, silver's unique combination of electrical conductivity (highest of all elements), thermal conductivity, and corrosion resistance creates technical barriers that limit substitution potential in high-performance applications. Commercial deployment of alternatives typically requires 5-10 years of testing and validation, particularly for applications requiring long operational lifespans.
Recycling Infrastructure Development Potential
Enhanced urban mining and electronic waste processing could increase secondary silver supply, though current recycling provides only 15% of annual supply compared to gold's 25% recycling rate. The lower recycling percentage reflects the dispersed nature of silver applications and the technical challenges of recovering microscopic quantities from electronic components.
Recycling improvement opportunities include:
- Advanced electronic waste processing technologies for component recovery
- Solar panel end-of-life recycling systems as installations reach replacement cycles
- Industrial catalyst recovery programmes for chemical processing applications
- Medical device recycling protocols for silver-containing equipment
Technological advances in recycling efficiency could potentially increase secondary supply by 2-3 times current levels over the next decade, though this would still represent a relatively small contribution to overall supply-demand balancing.
New Mine Development Timeline Constraints
Primary silver mine development faces extended timelines that limit supply response even during persistent deficit conditions. Discovery-to-production cycles typically require 7-12 years for new primary silver operations, while regulatory permitting and environmental approval processes add additional delays.
Current exploration spending for primary silver projects remains below levels needed to replace depleting reserves at existing operations. The focus of mining investment has shifted toward copper and gold projects, leaving silver exploration underfunded relative to projected future demand growth.
Development challenges include:
- Extended permitting processes for new mining operations
- Capital allocation preferences toward larger-scale base metal projects
- Environmental assessment requirements for mining permit approval
- Infrastructure development costs for remote silver deposit locations
The limited pipeline of advanced silver projects suggests that even if development activity accelerated immediately, meaningful new production would not materialise until the early 2030s.
The next major ASX story will hit our subscribers first
Strategic Positioning for Silver Market Deficit Conditions
Physical Exposure Implementation Strategies
Direct physical silver exposure requires consideration of storage, liquidity, and security factors that differ from traditional investment assets. Large positions benefit from allocated storage programmes that provide specific bar identification and segregated holding arrangements.
Physical exposure approaches:
- Allocated professional vault storage for positions exceeding 1,000 ounces
- Home storage solutions for smaller accumulation strategies under 100 ounces
- Coin versus bar considerations balancing premium costs against liquidity
- Geographic storage distribution for political and accessibility diversification
Vault storage considerations become particularly important during periods of market stress when liquidity constraints may limit rapid position adjustments. The October 2025 squeeze demonstrated how physical availability can become constrained even when aggregate annual supply appears adequate.
Mining Equity Exposure Criteria
Silver mining company exposure requires analysis of operational characteristics that provide leverage to silver price appreciation while managing operational and financial risks inherent in mining operations.
Selection criteria for mining equity exposure:
- All-in sustaining costs below $15 per ounce for operational efficiency
- Primary silver production focus reducing byproduct dependency
- Geographic diversification across stable mining jurisdictions
- Strong balance sheets with limited debt obligations
- Exploration upside potential for resource expansion opportunities
Primary silver producers offer more direct exposure to silver price movements compared to companies where silver represents only a byproduct revenue stream. However, the limited number of pure-play silver producers requires consideration of well-managed polymetallic operations with significant silver exposure.
Exchange-Traded Products and Derivatives Considerations
Exchange-traded funds backed by physical silver provide convenient exposure while maintaining liquidity advantages over direct physical ownership. However, concentration of metal in ETF storage facilities may face delivery constraints during severe shortage conditions.
ETF and derivatives analysis:
- Physical-backed ETFs versus synthetic exposure structures
- Storage location transparency and allocated versus pooled holdings
- Expense ratio considerations for long-term holding strategies
- Futures market dynamics including contango and backwardation patterns
The futures market offers leverage opportunities but requires active management due to roll costs and storage considerations embedded in forward price curves. During deficit periods, futures markets often trade in backwardation, where near-term contracts price above longer-dated contracts, reflecting immediate supply tightness.
Long-Term Market Outlook and Risk Assessment
Demand Growth Projections Through 2030
Structural demand drivers support continued growth across key silver consumption sectors, though growth rates may moderate from historical levels as substitution efforts achieve limited success and economic growth patterns evolve.
Sector-specific growth projections:
- Solar energy sector: 8-12% annual growth driven by renewable energy transition policies
- Electric vehicle adoption: 15-20% annual growth as mass market adoption accelerates
- 5G infrastructure deployment: Steady expansion supporting telecommunications network upgrades
- Industrial automation: Moderate growth in sensors and control systems applications
These projections assume continuation of current technological trajectories and policy support for renewable energy and transportation electrification. However, breakthrough substitution technologies or significant economic disruption could alter these demand patterns.
Supply Response Limitations and Constraints
Mine production growth faces structural constraints that limit supply elasticity even during extended periods of elevated prices and persistent deficit conditions.
Production growth limitations:
- Capital allocation trends favouring copper and gold over silver projects
- Environmental permitting delays extending project development timelines
- Grade decline patterns at existing operations reducing byproduct recovery
- Limited exploration pipeline for new primary silver discoveries
The byproduct nature of most silver production means that supply decisions remain influenced by base metal market economics rather than silver-specific price signals. This structural characteristic suggests that deficit conditions could persist even during periods of significant silver price appreciation.
Scenario-Based Price Forecasting Framework
Understanding silver pricing strategies becomes crucial for investors navigating these market conditions. Silver price development depends on the interaction between persistent structural deficits, technological substitution progress, economic growth patterns, and investor behaviour during periods of monetary policy uncertainty.
| Scenario | 2027-2030 Price Range | Key Assumptions |
|---|---|---|
| Base Case | $45-65 per ounce | Moderate deficit continuation, limited substitution |
| Supply Crisis | $80-120 per ounce | Major mine disruptions, accelerated investment demand |
| Recession Impact | $30-45 per ounce | Industrial demand destruction, ETF liquidation |
| Technology Breakthrough | $25-40 per ounce | Successful substitution in solar and electronics |
The base case scenario assumes continuation of current deficit trends with gradual technological progress reducing silver intensity in some applications while new uses emerge. Supply crisis scenarios reflect potential disruption at major producing operations or accelerated investment demand during monetary policy uncertainty.
Bear case scenarios require significant economic contraction that reduces industrial demand faster than supply constraints can support prices. Technology breakthrough scenarios assume successful commercial deployment of silver substitutes across multiple major applications simultaneously.
Risk Factors and Market Vulnerabilities
Several risk factors could significantly alter silver market dynamics and price trajectories regardless of structural deficit persistence.
Primary risk considerations:
- Technological disruption achieving viable substitution in major applications
- Economic recession reducing industrial demand below supply capacity
- Geopolitical escalation disrupting major producing regions or trade routes
- Policy changes affecting renewable energy deployment or strategic stockpiling
- Financial market stress forcing liquidation of investment positions
As Bloomberg markets data indicates, the concentration of production in specific geographic regions and refining capacity in limited locations creates vulnerability to operational disruptions that could temporarily exacerbate or alleviate deficit conditions depending on the nature and duration of disruptions.
Investment Disclaimer: Silver market analysis involves significant uncertainty regarding future supply, demand, technological development, and economic conditions. Price projections reflect scenario-based estimates rather than guaranteed outcomes. Readers should conduct independent research and consider professional advice before making investment decisions in precious metals markets.
Research Methodology Note: This analysis incorporates data from the World Silver Survey 2026 produced by Metals Focus for the Silver Institute, industry production statistics, and market research from precious metals consultancies. All financial data and projections should be verified against current market conditions and authoritative sources before investment application.
Looking to Position Yourself Ahead of the Silver Market Squeeze?
Discovery Alert's proprietary Discovery IQ model delivers real-time alerts on significant silver and precious metals discoveries, instantly empowering subscribers to identify actionable opportunities ahead of the broader market. Understand why major mineral discoveries can lead to substantial returns by exploring Discovery Alert's dedicated discoveries page, showcasing historic examples of exceptional outcomes, and begin your 14-day free trial today to secure your market-leading advantage.