
August 12, 2026
The Hidden Architecture of a Market That Refuses to Balance
Commodity markets are supposed to self-correct. When demand falls, prices ease, supply adjusts, and the imbalance closes. The silver market deficit despite falling solar demand is doing something altogether different in 2026. Despite a dramatic contraction in one of its most visible demand sectors, the global silver market is on track to record its largest deficit in the current multi-year streak of undersupply. Understanding why requires moving beyond headline demand figures and into the structural mechanics of how silver is actually produced, consumed, and stored.
The solar narrative has dominated silver coverage for years, and it is now reversing sharply. That reversal is being used in some quarters to build a bearish case for the metal. However, the data tells a more complicated story.
When big ASX news breaks, our subscribers know first
Six Years of Deficit and the Inventory Buffer That Is Running Low
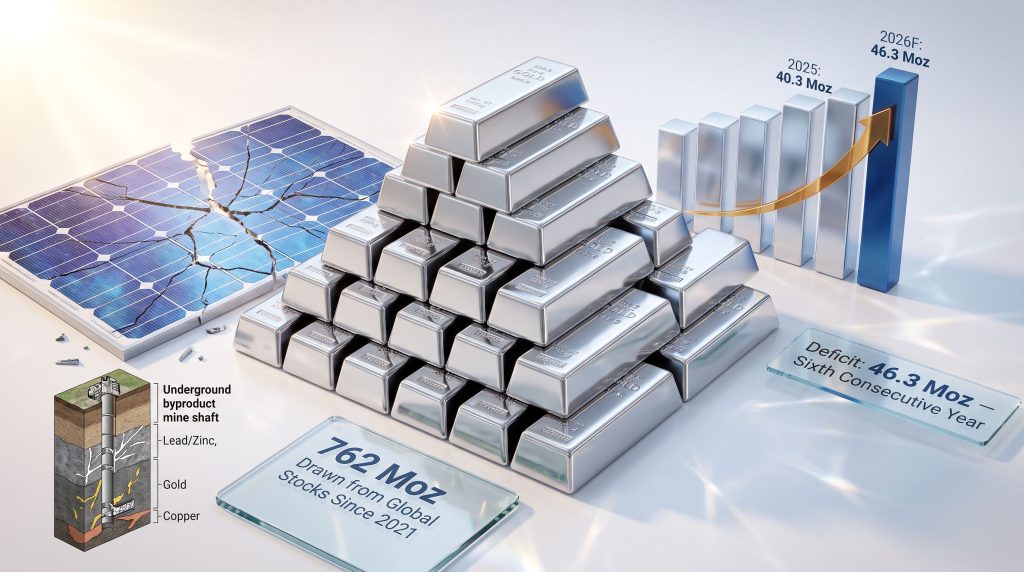
The Silver Institute's World Silver Survey 2026 projects a market deficit of 46.3 million ounces (Moz) for 2026, a figure that actually widens from the 40.3 Moz shortfall recorded in 2025, even as total global silver demand is forecast to decline approximately 2% year-on-year. This is the sixth consecutive year in which silver supply has fallen short of consumption.
That six-year run has not been consequence-free. An estimated 762 million ounces has been drawn from global silver inventories between 2021 and 2026, according to data reported by Reuters and sourced from Metals Focus and the Silver Institute. Each successive deficit year compounds the erosion of the above-ground buffer stocks that markets rely on to absorb temporary imbalances.
| Year | Market Deficit Status |
|---|---|
| 2021 | Deficit begins; stock drawdowns initiated |
| 2022 | Deficit widens |
| 2023 | Deficit continues |
| 2024 | Deficit persists |
| 2025 | 40.3 Moz |
| 2026F | 46.3 Moz |
Source: Silver Institute, World Silver Survey 2025 and 2026; Metals Focus
The trajectory itself carries an important signal. A deficit widening from 40.3 Moz to 46.3 Moz during a period of falling total demand does not indicate a market edging toward balance. Furthermore, it indicates that supply is contracting faster than consumption, a condition that solar demand alone cannot explain.
Why Solar Silver Demand Is Collapsing and Why It Does Not Close the Gap
The Cost Pressure Reshaping Photovoltaic Manufacturing
Silver's function in solar panel production centres on its role as a conductive paste applied to silicon photovoltaic cells. For years, this application drove a significant expansion in industrial silver demand. That dynamic has now inverted, and the cause is straightforward: silver became too expensive to use at previous loading levels.
Silver accounts for more than 17% of solar module production costs at current price levels. As of mid-2026, silver prices remained approximately 65% above year-earlier levels, according to reporting by the Free Press Journal, even after retreating roughly half from a late-January peak. At that cost burden, manufacturers face a direct financial incentive to reduce the amount of silver paste applied per cell or to explore alternative conductive materials entirely.
The numbers reflect that pressure. According to recent analysis of solar thrifting, the scale of reduction is significant:
- Photovoltaic silver consumption is forecast to fall 19% in 2026 to approximately 151 million ounces
- This follows a 6% decline already recorded in 2025
- Solar's share of total silver demand is projected to compress from roughly 18% in 2025 to approximately 14% in 2026
Installation Growth Versus Silver Intensity: A Critical Distinction
One of the more important analytical errors circulating in market commentary is the conflation of solar installation volumes with silver consumption. These two metrics are now moving in opposite directions.
Global solar installations continue to expand as energy transition targets drive deployment. What has changed is the quantity of silver embedded in each panel. As manufacturers optimise paste loading and pursue thrifting strategies, silver intensity per unit of output declines even when the number of panels being manufactured rises. The net result is that the solar industry can grow in installed capacity terms while simultaneously consuming meaningfully less silver.
This is not a demand collapse. It is a structural efficiency shift driven by price incentives, and its endpoint, the technical floor below which silver loading cannot be reduced without compromising cell performance, has not yet been reached.
Three Forces Keeping the Silver Market in Deficit Despite Falling Solar Demand
The persistence of the silver market deficit despite falling solar demand reflects three structural forces that operate independently of photovoltaic consumption trends.
1. Investment Demand Accelerating in the Opposite Direction
Coin and bar demand is forecast to rise 18% in 2026, according to the Silver Institute. Physical investment buying is absorbing metal that might otherwise flow toward industrial users. Unlike industrial demand, which responds negatively to higher prices, investment buying in precious metals often reinforces itself during periods of price strength or macroeconomic uncertainty.
Higher prices can attract rather than suppress retail and institutional accumulation of physical silver. Consequently, this demand category is rarely given sufficient weight in analyses focused on solar's retreat, yet its 18% growth forecast is one of the primary reasons the 2026 deficit is wider, not narrower, than the year prior. In addition, silver's dual role as both a precious and industrial metal makes it uniquely sensitive to shifts in investment sentiment.
2. Above-Ground Stock Depletion Reducing the Available Float
London's bullion vaults function as the primary global clearing hub for physical silver. Changes in vault composition and lease rate behaviour provide early warning of tightening physical availability, and the current signals are worth examining carefully.
Total London vault holdings stood at approximately 884 Moz at end-March 2026. The proportion of that inventory classified as sitting outside exchange-traded products (ETPs) rose from 17% in September 2025 to 28% by March 2026, according to Metals Focus data. This shift is significant because metal held outside ETPs is generally considered less liquid and less immediately accessible for short-term market needs.
Philip Newman, Managing Director at Metals Focus, has noted that while London lease rates have broadly normalised following earlier stress events, another liquidity squeeze in 2026 remains a credible near-term scenario. The inventory composition shift is one reason that assessment has not been dismissed. Indeed, silver market backwardation trends earlier in the cycle foreshadowed precisely these kinds of tightening conditions.
3. Mine Supply That Cannot Respond to Price Signals
This is arguably the least understood structural feature of the silver market and the one most consequential for long-term supply analysis.
Global silver mine production is forecast to remain essentially flat in 2026, with grade depletion and operational constraints offsetting incremental output gains at individual operations. The Silver Institute reported that lead and zinc mines remained the largest source of silver mine supply in 2025, while output from gold and copper operations rose 5% and 6% respectively.
| Primary Metal | Silver Supply Role | 2025 Output Direction |
|---|---|---|
| Lead and Zinc | Largest single source | Constrained by host-metal demand |
| Gold | Secondary source | +5% silver output |
| Copper | Secondary source | +6% silver output |
| Primary Silver | Minority of total supply | Limited new project pipeline |
This byproduct dependency creates what analysts describe as structural supply inelasticity. When silver prices rise, primary silver miners benefit directly, but they represent a minority of total global supply. The majority of silver production is governed by the economics and expansion plans of zinc, copper, and gold operators. When those operators decide to develop a new mine, silver is a secondary consideration, not the primary driver.
Unlike copper or gold, where elevated prices can directly incentivise new mine development within a defined investment cycle, silver supply is largely captive to host-metal economics. A silver price spike does not automatically unlock new silver tonnes.
Global silver production constraints create a ceiling on how quickly new silver can reach the market regardless of price signals, and it is the reason that flat mine production combined with a 19% decline in solar demand still produces a widening deficit in absolute terms.
The London Vault Signal and Physical Tightness Scenarios
The shift in London vault composition from 17% to 28% of non-ETP holdings is not a minor statistical footnote. It represents a structural change in how available metal is distributed across the market.
Metal sitting in ETP structures can be redeemed and returned to the physical market relatively efficiently if investor appetite shifts. Metal held in less-liquid forms, such as industrial stockpiles or long-term commercial inventory, is not readily available to meet short-term shortfalls. As the proportion of accessible metal shrinks, the conditions for periodic liquidity squeezes intensify.
The scenario space for a renewed tightening event includes:
- Accelerated ETP inflows drawing down the remaining liquid vault float, widening the gap between headline inventory and practically accessible metal
- Industrial restocking demand from sectors outside photovoltaics, including electronics, medical applications, and defence-related manufacturing, which could compress available supply rapidly
- Host-metal disruptions at major lead, zinc, or copper operations that reduce byproduct silver output across multiple large-scale mines simultaneously
- Sustained coin and bar demand growth continuing to draw down physical stocks faster than recycling and mine supply can replenish them
None of these scenarios requires an extraordinary catalyst. Each sits within the normal range of market variation.
What Investors and Analysts Should Be Tracking
The 46.3 Moz deficit forecast is not a fixed outcome. Several variables will determine whether the actual balance holds at that level, narrows toward equilibrium, or expands further.
Photovoltaic Thrifting Stabilisation: Silver paste loading in solar cells cannot be reduced indefinitely. At some point, further reductions compromise cell efficiency beyond what manufacturers can accept commercially. Identifying the technical floor on silver intensity per cell is one of the more consequential analytical questions in the silver market right now, and it remains genuinely unresolved. Analysis from the Silver Institute reinforces that this threshold will be a defining variable in future supply-demand modelling.
London Inventory Composition and Lease Rate Trends: A renewed rise in lease rates would signal physical tightening ahead of any visible price movement. The ETP versus non-ETP split in London vaults is a leading indicator of effective market liquidity that most retail-facing silver analysis ignores entirely.
Investment Demand Durability: The 18% growth forecast in coin and bar demand is the primary demand-side offset to solar's retreat. If macroeconomic conditions shift, particularly a sustained decline in inflation expectations or a rotation toward risk assets, investment demand could moderate and partially close the deficit from the consumption side. However, the gold-silver ratio remains an important relative-value signal for investors monitoring whether that rotation is likely.
Byproduct Metal Economics: Significant softening in zinc or copper prices could lead major diversified miners to curtail or defer expansion plans, reducing silver byproduct output as a secondary effect. This channel is underappreciated as a supply-side risk amplifier.
The next major ASX story will hit our subscribers first
The Supply Architecture Argument: Why the Deficit Persists Regardless of Solar
The 2026 silver market deficit illustrates a principle that applies across commodity markets but is particularly acute in silver: structural supply constraints can sustain and even widen imbalances even when a prominent demand category retreats sharply.
The 19% decline in photovoltaic silver consumption is real, material, and will be cited extensively as evidence of structural demand weakness. But it operates within a market where:
- Cumulative inventory drawdowns of 762 Moz since 2021 have reduced the buffer stock available to absorb supply-demand mismatches
- Mine supply is structurally inelastic because approximately 70 to 75% of global silver output arrives as a byproduct of other metals whose production decisions are independent of silver prices
- Investment demand is growing at 18%, partially replacing and in volume terms nearly offsetting the industrial demand that is contracting
- The deficit is widening in absolute terms from 40.3 Moz to 46.3 Moz, not narrowing
The critical analytical reorientation required here is moving beyond solar demand as the primary silver market narrative. A multi-variable framework that weights supply inelasticity, the byproduct dependency structure, inventory depletion trajectories, and investment demand dynamics with equal rigour produces a substantially different market picture than one anchored to photovoltaic consumption trends alone.
The silver market deficit despite falling solar demand does not require strong photovoltaic consumption to persist. It requires only that total supply continues to fall short of total demand, a condition that the current supply architecture makes structurally difficult to resolve in the near term regardless of what happens inside any single demand sector.
This article draws on data and forecasts published by the Silver Institute in the World Silver Survey 2026, Metals Focus research, and reporting by Reuters and the Free Press Journal. All forecasts involve uncertainty and should not be interpreted as investment advice. Readers are encouraged to consult the Silver Institute's publicly available survey publications for detailed annual breakdowns of production, consumption, and market balance data.
Want to Know When the Next Major Silver Discovery Hits the ASX?
Discovery Alert's proprietary Discovery IQ model scans ASX announcements in real time, delivering instant alerts on significant mineral discoveries — including silver — so subscribers can act on actionable opportunities before the broader market catches on. Explore historic examples of major discovery returns and begin your 14-day free trial at Discovery Alert to position yourself ahead of the next significant find.