August 11, 2026
The Two-Engine Problem Most Precious Metals Investors Miss
Not every asset class is built the same way. Some respond to a single variable. Others carry multiple, overlapping demand structures that create compounding sensitivity to economic signals. Understanding which category an asset belongs to is one of the most underappreciated edges available to investors tracking commodity markets.
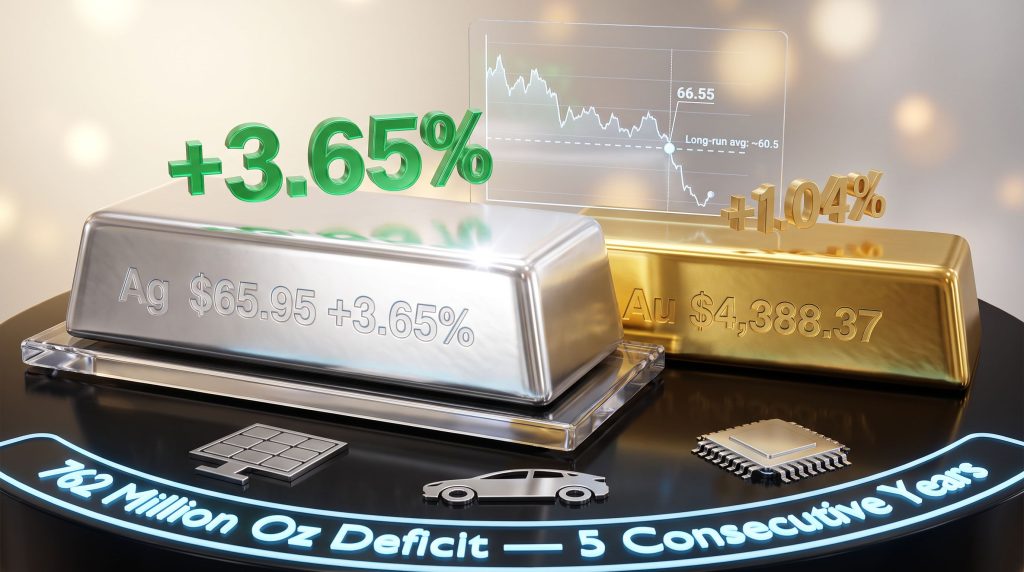
Silver sits firmly in the second category, and on August 11, 2026, that structural reality is playing out in real time. While gold is up 1.04% on the day to $4,388.37 per ounce, silver has surged 3.65% to $65.95 per ounce, delivering roughly 3.5 times gold's percentage gain in a single session. The question most market participants are asking right now is the one this article answers directly: why is silver outperforming gold today?
The answer is not random. It comes down to architecture.
When big ASX news breaks, our subscribers know first
Silver's Structural Advantage: Understanding the Dual-Demand Framework
Gold as a Monetary-Only Asset
Gold's price responds primarily to a narrow set of financial conditions. Real yields, US dollar strength, and Federal Reserve policy expectations are the three dominant inputs. When rate-hike pressure eases, gold rises. When real yields fall, gold's appeal as a non-yielding store of value increases. This makes gold highly predictable in its sensitivity profile, but also limited. It has one engine.
Silver's Second Engine: Industrial Demand
Silver carries the same monetary sensitivity as gold, but layers an entirely separate demand structure on top. According to the Silver Institute's World Silver Survey 2026, industrial applications account for approximately 58% of total annual silver demand. That figure alone separates silver from every other precious metal in terms of market structure.
Silver's dual demand draws from several distinct and growing sectors, making the industrial demand base far from monolithic:
- Solar photovoltaic manufacturing — silver paste is used in the conductive contacts of solar cells and cannot currently be substituted without meaningful efficiency losses
- Electric vehicle production — each EV requires significantly more silver than an internal combustion vehicle, with uses spanning battery management systems, charging contacts, and electronic control units
- Semiconductor and advanced electronics fabrication — silver's unmatched electrical and thermal conductivity keeps it embedded in circuit boards, microchips, and high-frequency components
This industrial base creates a demand floor that persists independently of monetary conditions. When monetary tailwinds and healthy industrial signals arrive at the same time, silver's price response compounds in a way gold's simply cannot replicate.
Why the Dual-Engine Design Matters at Macro Inflection Points
The following table illustrates the demand sensitivity divergence between the two metals across key economic variables:
| Demand Driver | Gold Exposure | Silver Exposure |
|---|---|---|
| Real yield movements | High | High |
| US dollar fluctuations | High | High |
| Federal Reserve policy shifts | High | High |
| Solar energy manufacturing | None | Significant |
| EV and battery technology | None | Significant |
| Semiconductor production | None | Significant |
| Manufacturing PMI trends | Minimal | Substantial |
The asymmetry is stark. When monetary conditions shift dovishly and industrial demand signals remain intact simultaneously, silver captures value through two channels while gold captures value through one. That is the precise environment unfolding this week. For a broader view, precious metals market analysis underscores just how consistently this divergence has shaped outcomes in recent cycles.
What Triggered Today's Move: The July Jobs Report and Fed Repricing
The Labour Market Data That Changed the Rate Calculus
The catalyst for this week's precious metals move arrived with July's employment figures from the Bureau of Labor Statistics. The US economy shed 23,000 jobs in July against economist forecasts calling for a gain of 83,000 positions. The unemployment rate simultaneously ticked down from 4.2% to 4.1%, suggesting the labour market is softening without falling into genuine contraction.
This combination delivered a precise macro signal: the economy is losing some heat, but not collapsing. For precious metals markets, that reading is meaningful on multiple levels.
Federal Reserve Rate Expectations: The Repricing That Fuelled the Rally
Following the jobs release, CME FedWatch data showed the implied probability of a September Federal Reserve rate hike falling from approximately 57% to roughly 44%. That shift reduced the opportunity cost of holding non-yielding assets like gold and silver, triggering buying pressure across both metals.
For silver specifically, this repricing carried a secondary benefit gold could not access. A labour market that is cooling without crashing is also one where manufacturing activity remains viable. Industrial demand expectations for silver stayed intact even as monetary conditions shifted favourably. Both engines received a green light in the same session.
Why Wednesday's CPI Report Is More Consequential for Silver Than for Gold
The July Consumer Price Index release carries a different weight for silver than it does for gold. A softer inflation print reduces rate-hike pressure for both metals through the same monetary channel, but also signals that the real economy is healthy enough to sustain industrial activity, which is a benefit gold cannot access. Silver is uniquely positioned to gain through both channels from a single data point.
The July Consumer Price Index is scheduled for release on August 12, 2026 at 8:30 a.m. ET. Economist consensus, per TradingKey forecasts, places headline CPI at 3.4% year-over-year, with core inflation expected to rise approximately 0.2% month-over-month.
A below-consensus print would validate the "soft landing" narrative in two ways simultaneously:
- It would reinforce the Federal Reserve's ability to pause rate hikes, maintaining the monetary tailwind for both metals
- It would confirm that inflation is easing organically, without the kind of demand destruction that threatens manufacturing activity and silver's industrial demand base
A surprise to the upside, however, would force a rebuild of rate-hike expectations, partially reversing this week's gains. Furthermore, silver's higher beta to macro sentiment shifts means it would likely give back proportionally more than gold under that scenario. As Yahoo Finance notes, this asymmetric sensitivity is a key consideration for investors weighing exposure to either metal.
Reading the Gold-Silver Ratio: What 66.55 Actually Tells You
How the Ratio Works and Why It Matters
The gold-silver ratio is calculated by dividing the gold spot price by the silver spot price. The resulting number represents how many ounces of silver are required to purchase one ounce of gold. Its directional movement is a real-time indicator of which metal is gaining ground on a relative basis. In-depth gold-silver ratio analysis reveals three key interpretations investors commonly apply:
- Rising ratio — gold is outperforming; monetary fear is the dominant market force
- Falling ratio — silver is gaining ground; industrial optimism is joining the monetary bid
- Sharp compression in a single session — both engines are repriced simultaneously; silver enters accelerated outperformance
Current Ratio Data in Context
| Metric | Value |
|---|---|
| Ratio as of August 11, 2026 | ~66.55 |
| Prior Friday close | ~68.2 |
| Single-session compression | ~1.5 points |
| Long-run post-1971 average | ~60.5 |
| 52-week cycle peak | ~88.9 |
The compression from a cycle peak near 88.9 to the current reading of 66.55 represents a structural shift that has unfolded over months. Today's single-session move of more than 1.5 points sits within what analysts identify as the most historically active outperformance zone for silver: the 60 to 70 range. At current levels, silver retains meaningful relative upside against gold compared to long-run historical norms.
The Structural Foundation Beneath Today's Tactical Move
Six Consecutive Years of Supply Deficits
Today's price action is not occurring in isolation. It sits on top of a multi-year structural supply imbalance that amplifies the market's response to any positive demand catalyst. The persistent silver supply deficits across recent years have fundamentally altered the market's ability to absorb demand surges without significant price adjustment.
According to the Silver Institute's World Silver Survey 2026, silver has run a supply deficit in every year from 2021 through 2025, a period spanning five consecutive annual shortfalls. Over that stretch, total consumption exceeded mine production plus recycling by approximately 762 million ounces. The 2026 deficit is projected to extend this pattern, making the current year the sixth consecutive one in which global silver demand outpaces available supply.
In a structurally supply-constrained market, positive demand catalysts do not simply add linearly to price. They arrive in a market with reduced inventory buffers, meaning the same buying pressure that would cause a moderate move in a balanced market can produce a significantly larger and faster price response when available supply is already tight.
Why Silver's Market Structure Amplifies Price Moves
Beyond the supply deficit, silver's market is considerably smaller and less liquid than gold's. This structural characteristic has an important and often overlooked implication: when equivalent levels of buying interest enter both markets simultaneously, silver's thinner order book translates that pressure into proportionally larger price moves.
It is not just dual-demand sensitivity that drives silver's outsized percentage gains. Market microstructure is a compounding factor. This dynamic helps explain why silver versus gold performance has historically favoured silver during precious metals bull market recoveries, whilst also producing sharper drawdowns during risk-off periods.
The next major ASX story will hit our subscribers first
Three Risk Scenarios That Could Alter Silver's Trajectory
Scenario 1: CPI Surprises Above Consensus
If July's Consumer Price Index prints materially above the 3.4% consensus, rate-hike probability would rebuild rapidly. This would compress the monetary tailwind currently supporting both metals, with silver likely retreating more than gold given its higher beta to macro sentiment.
Scenario 2: Manufacturing Data Deteriorates Sharply
A significant contraction in industrial production or global manufacturing PMI readings would undermine silver's industrial demand premium. Under this scenario, silver's second engine stalls while gold retains its safe-haven monetary bid. The gold-silver ratio would likely widen, reversing recent compression.
Scenario 3: The Soft Landing Thesis Holds
A below-consensus CPI reading combined with stable manufacturing indicators would validate both demand engines simultaneously. This is the scenario silver buyers are currently pricing. The structural supply deficit provides an amplification layer beneath any sustained positive catalyst, supporting a faster price response than deficit-free conditions would allow.
Frequently Asked Questions: Why Is Silver Outperforming Gold Today?
Why does silver consistently move more than gold on the same macro news?
Silver trades in a considerably smaller and less liquid market than gold. When comparable buying interest enters both markets at the same time, silver's thinner order depth amplifies the price impact. This market structure dynamic compounds silver's dual-demand sensitivity to create larger percentage moves from the same catalyst.
Is the falling gold-silver ratio a bullish signal for precious metals broadly?
Historically, sustained ratio compression has accompanied broader precious metals bull market phases. Silver's outperformance tends to accelerate when investors simultaneously gain confidence in both the monetary and industrial economic outlooks. A falling ratio is therefore often read as a broader confirmation signal, not just a silver-specific one. Furthermore, Forbes highlights that this pattern has repeated consistently across multiple market cycles.
Does a supply deficit guarantee silver price appreciation?
A structural deficit does not guarantee gains in isolation. What it does is reduce the market's ability to absorb demand surges without significant price adjustment. Deficits function as an amplification mechanism, making positive catalysts more potent and price discovery faster than in a balanced or surplus market.
Why does silver respond differently to the same Federal Reserve decision compared to gold?
Both metals benefit from dovish Fed signalling through reduced opportunity cost. Silver carries an additional layer of benefit because a Fed pause typically implies the central bank believes the economy is stable enough to manage without tighter policy. That stability signal supports industrial demand expectations, which gold cannot access.
What Tactical and Structural Investors Are Watching Differently
| Perspective | Key Consideration |
|---|---|
| Tactical (short-term) | CPI release outcome, September rate-hike probability, ratio momentum |
| Structural (long-term) | Six-year supply deficit trajectory, EV and solar demand growth, historical ratio mean reversion toward 60.5 |
The tactical and structural cases are currently pointing in the same direction, which is an alignment that does not always occur. Short-term positioning ahead of Wednesday's CPI release is driving today's price action, but the foundation beneath that move — a multi-year supply deficit combined with accelerating industrial demand from the green energy transition — operates on a much longer time horizon and does not reset with a single data point.
Investors tracking why silver is outperforming gold today should recognise that the question has both a tactical answer — Friday's jobs miss repriced September rate-hike odds — and a structural answer: six consecutive years of supply deficits have tightened available inventory to the point where positive catalysts produce faster and larger price responses than they otherwise would.
Both answers are true simultaneously. That is precisely what makes the current setup worth understanding.
Disclaimer: This content is provided for informational and educational purposes only and does not constitute financial or investment advice. Precious metals markets involve significant risk, including the possibility of partial or total loss of capital. Past performance is not indicative of future results. Always consult a qualified financial professional before making any investment decisions. Spot price data referenced in this article reflects figures as of August 11, 2026, sourced from GoldSilver.com price charts. Employment data sourced from the Bureau of Labor Statistics. Rate probability data sourced from CME Group FedWatch Tool. Supply and demand data sourced from the Silver Institute World Silver Survey 2026.
Want to Know When the Next Major Mineral Discovery Hits the ASX?
Discovery Alert's proprietary Discovery IQ model delivers real-time alerts on significant ASX mineral discoveries, instantly cutting through complex data to surface actionable opportunities — explore the historic returns major discoveries have generated and begin your 14-day free trial to position yourself ahead of the market.