July 21, 2026
When Inventory Disappears, Prices Lose Their Anchor
Commodity markets are typically self-correcting systems. When supply falls short, prices rise, investment flows into new production, and equilibrium gradually restores itself. Silver, however, operates under a set of structural conditions that disrupt this feedback loop at nearly every stage. Its supply cannot respond quickly to price signals, its demand spans incompatible categories ranging from industrial fabrication to monetary investment, and its above-ground stocks, once drawn down, do not rebuild easily. Understanding these mechanics is essential context for interpreting what has unfolded in the silver market since 2021 and what the silver market liquidity squeeze and deficit trends of 2025 and 2026 actually represent.
When big ASX news breaks, our subscribers know first
The Architecture of a Multi-Year Structural Deficit
Five Years of Demand Exceeding Supply
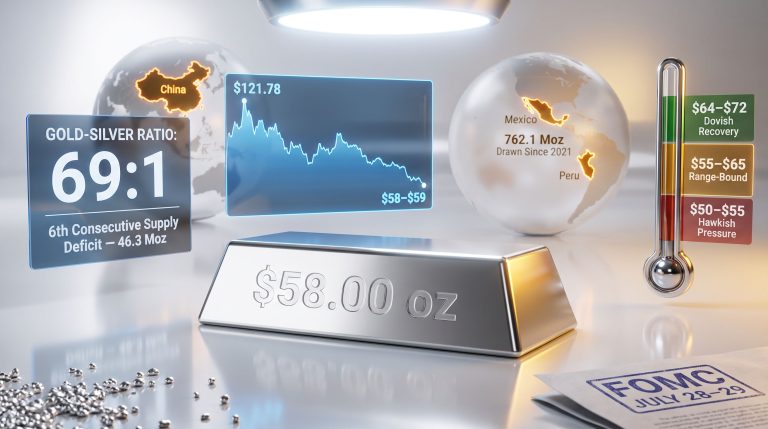
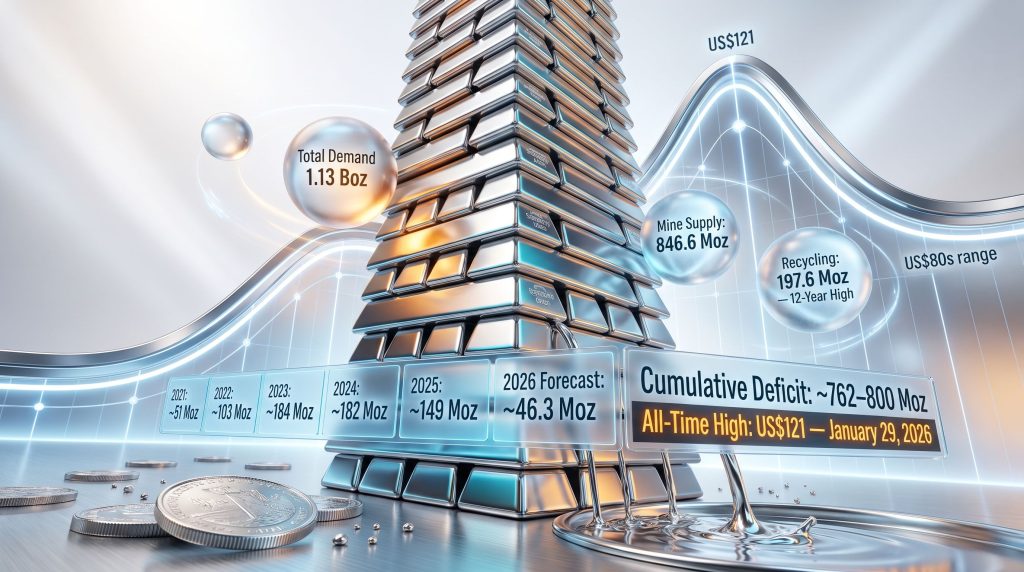
The silver market has now recorded a structural deficit for five consecutive years. This is not a rounding error or a statistical artifact. It represents a genuine and sustained gap between the metal consumed globally and the metal brought to market through mining and recycling combined. The silver supply deficits since 2021 are estimated at approximately 762 to 800 million ounces (Moz), a figure that dwarfs the inventory buffers that previously provided the market with price stability.
Each year of deficit compounds the problem. Above-ground stocks act as a shock absorber, allowing the market to satisfy demand that temporarily exceeds production. Once those buffers are significantly eroded, the market loses its capacity to absorb demand spikes without sharp price responses. That is precisely the dynamic that played out in late 2025.
| Year | Market Position | Estimated Deficit (Moz) |
|---|---|---|
| 2021 | Deficit | ~51 |
| 2022 | Deficit | ~103 |
| 2023 | Deficit | ~184 |
| 2024 | Deficit | ~182 |
| 2025 | Deficit | ~149 |
| 2026 (Forecast) | Deficit | ~46.3 |
| Cumulative (2021–2026) | ~762–800 Moz |
The apparent narrowing of the 2026 deficit to approximately 46.3 Moz should not be read as a signal that the market is recovering. The supply side remains structurally constrained, and the cumulative depletion of stocks means the market is operating with far less resilience than historical norms would suggest. A smaller deficit in a year of lower total demand does not represent equilibrium returning; it represents a market that has absorbed extraordinary punishment and remains vulnerable to the next demand shock.
What a Liquidity Squeeze Actually Means in Physical Metal Markets
The phrase liquidity squeeze carries different meanings depending on the asset class under discussion. In physical commodity markets, it refers specifically to a condition where the availability of deliverable metal contracts sharply relative to the open interest and obligations that reference it. This is distinct from a general price rally. Furthermore, understanding the broader silver market squeeze helps contextualise how these pressures ripple through global finance.
A silver liquidity squeeze does not simply mean prices are rising. It means the physical market's capacity to absorb demand shocks without dramatic price movements has been structurally diminished by cumulative inventory erosion.
In practice, a physical silver liquidity squeeze manifests through several observable signals:
- Rising premiums on physical metal above spot prices
- Elevated silver lease rates, reflecting the difficulty of sourcing borrowable metal
- Falling exchange-registered inventories, reducing the pool of deliverable material
- Widening spreads between near-term and deferred futures contracts
- Increased urgency from industrial end-users to secure forward supply
All of these signals converged in October 2025, producing the most acute tightening episode the silver market had experienced in decades.
The October 2025 Dislocation: How Four Forces Collided
CME Vault Reallocation and the Redistribution of Physical Stocks
One of the less widely understood dynamics behind the October 2025 squeeze was the dramatic reallocation of metal into CME-registered vaults. This shift altered the geographic and institutional distribution of accessible silver stocks. Metal held outside registered vault systems, while nominally part of the above-ground supply picture, is not readily available to satisfy exchange delivery obligations. As more metal migrated into CME-eligible storage, the effective float of freely circulating silver available to non-exchange participants tightened considerably.
Rising ETP Holdings Absorbing Available Supply
Exchange-traded product (ETP) holdings were simultaneously increasing throughout 2025, absorbing significant volumes of above-ground silver that would otherwise have remained available to industrial and commercial users. ETPs backed by physical silver do not lend their holdings into the market; they represent a permanent withdrawal of metal from circulation for as long as investor positions are maintained. Consequently, the silver squeeze dynamics of this period created a genuinely transformative moment for investors to navigate.
Lease Rate Explosion as a Stress Barometer
Silver lease rates, the annualised cost of borrowing physical metal for a defined period, serve as one of the most reliable real-time indicators of physical market stress. When lease rates surge, it signals that institutions requiring borrowed metal to satisfy near-term delivery commitments are competing aggressively for a finite pool of available supply. The October 2025 episode produced exactly this dynamic, with lease rates rising sharply and confirming that the squeeze was fundamentally physical in nature rather than speculative.
Price Consequences: Record Highs and Sharp Reversals
The convergence of these pressures drove silver prices to an all-time high above US$121 on January 29, 2026, following a 42% rise in the annual average price during 2025. The velocity of the move reflected the thin-inventory environment. Equally instructive was the subsequent correction, which brought silver back to the US$80s range by early May 2026. Both the rally and the reversal were amplified by the lack of available inventory to buffer price movements in either direction. According to research published by Reuters, stock drawdowns are continuing to raise squeeze risks heading into 2026.
The Demand Picture: Industrial Anchor, Consumer Retreat
Industrial Silver in a Year of Mixed Signals
Industrial demand remains the structural bedrock of global silver consumption, accounting for the largest single share of total offtake. In 2025, however, it declined by 3% to 657.4 Moz, the first contraction after four consecutive years of growth. This headline figure conceals significant divergence across end-use segments.
Where industrial demand held up:
- AI data centre infrastructure continued to drive elevated electronics demand
- Automotive electrification supported both electrical component and brazing alloy consumption
- Power grid modernisation investment sustained demand in transmission and distribution applications
- Brazing alloys edged up 1%, supported by aerospace sector resilience
Where industrial demand weakened:
- Electrical and electronics demand fell 2%, as photovoltaic sector weakness offset AI and automotive gains
- Other industrial demand dropped 7%, driven by a marked slowdown in the ethylene oxide (EO) market
- East Asia and South Asia accounted for the majority of regional losses
The Photovoltaic Thrifting Problem: A Structural Demand Headwind
Perhaps the most consequential medium-term development within the industrial demand landscape is the acceleration of silver thrifting in photovoltaic manufacturing. Thrifting refers to the deliberate reduction of silver content per unit through design changes, metallurgical substitution, or process optimisation.
PV manufacturers, facing intense competitive pressure and rising raw material costs in 2025, accelerated this process significantly. The result is that even as global solar installation volumes continue to grow, the silver intensity per panel is declining. This creates a situation where headline growth in renewable energy capacity does not translate proportionally into silver demand growth, a dynamic that market observers who focus solely on installation volumes may underestimate.
The PV sector's shift toward thrifting represents a structural demand headwind that could persist even if solar installation volumes continue growing globally. The relevant metric is silver grams per panel, not panels installed per year.
Regional Divergence in Industrial Demand
| Region | 2025 Industrial Demand Trend |
|---|---|
| East Asia | Significant decline |
| South Asia | Significant decline |
| Europe | Broadly stable |
| North America | Broadly stable |
Consumer Fabrication: High Prices Eroding Volume
Global jewelry fabrication fell 8% in 2025, with the steepest regional decline recorded in India at 20%, where record rupee-denominated silver prices combined with price volatility to undermine consumer affordability. European jewelry demand fell 10%, with Italy particularly exposed to tariff-related headwinds affecting export flows.
Not every region contracted. China recorded a 5% gain in jewelry demand, driven partly by gold substitution dynamics as consumers sought more affordable alternatives to elevated gold prices, alongside targeted product innovation. Thailand surged 24% on the back of strong export flows to India.
Silverware demand fell an even sharper 21% to a four-year low, with losses again concentrated in price-sensitive markets where elevated silver prices directly compress discretionary spending.
Investment Demand: A Global Rebound With a Notable Exception
After two consecutive years of contraction, coin and bar demand rose 14% in 2025. This recovery was broadly distributed:
- India led with a 33% surge, driven by strengthening retail investor interest and price momentum
- Europe recorded its first annual increase in three years
- The Middle East and China posted multi-fold gains from a low prior-year base
- The United States recorded its third consecutive annual decline
The US divergence is analytically significant. The outcome of the 2024 presidential election reduced the perceived urgency of safe-haven silver accumulation among a portion of the domestic investor base. Additionally, profit-taking dominated US market behaviour during the first nine months of 2025, as retail investors captured gains from the price rally rather than adding exposure. This contrasts sharply with the behaviour observed in most other major markets.
Supply Constraints: Why the Market Cannot Self-Correct
Mine Production Growth That Isn't Enough
Global silver mine production rose 3% to 846.6 Moz in 2025, its highest level in recent years. Growth was driven by higher by-product copper output from Peruvian operations and the ramp-up of Polymetal JSC's Prognoz mine in Russia. Smaller contributions came from China and Morocco, partially offset by lower output from key Mexican operations and declines in Indonesia.
Despite this production increase, the market remained in substantial deficit. The arithmetic is straightforward: adding supply at the margin does not close a structural gap when cumulative stock depletion has already removed the market's primary shock-absorption mechanism.
A particularly notable regional signal was the 3% decline in North American mine output to its lowest level in a decade. North America has historically been one of the world's most significant silver-producing regions, and sustained production decline from this base represents a meaningful structural supply headwind.
The By-Product Problem: Supply Inelasticity Explained
Approximately 70 to 75% of global silver production is extracted as a by-product of mining other metals, principally copper, gold, lead, and zinc. This single fact explains more about the silver market's structural supply constraints than any other. Indeed, silver's dual role as both a precious metal and an industrial commodity creates unique complications that primary miners of other metals simply do not face.
When silver prices rise, a primary silver miner can respond by increasing production. But when silver is extracted as a by-product of a copper or gold operation, the production decision is governed entirely by the economics of the primary metal, not by silver prices. The mine will produce whatever silver emerges from processing the ore body regardless of the silver spot price, and it cannot meaningfully increase silver output without increasing primary metal output.
Because silver supply is structurally tied to the economics of base and precious metal mining rather than silver prices alone, the market cannot self-correct as rapidly as other commodities when deficits emerge. This inelasticity is a permanent feature of the supply structure, not a temporary condition.
Lead and zinc mines remained the largest single source of silver in 2025, though their share of global production edged lower year-on-year. Gold and copper operations increased silver by-product output by 5% and 6% respectively, providing meaningful incremental supply but not at a scale sufficient to alter the structural deficit.
Recycling at a 12-Year High, But With a Hard Ceiling
Silver recycling reached 197.6 Moz in 2025, the highest level since 2013. Elevated prices incentivised selling of jewelry and silverware scrap, and ethylene oxide industrial recycling also increased. However, two constraints prevented recycling from compensating fully for the supply shortfall:
- Refinery processing bottlenecks capped the volume of recoverable metal that could be processed within the year
- Electronic scrap volumes declined, partially offsetting gains in other recycling streams
These constraints illustrate an important principle: recycling supply, like mine supply, has a functional ceiling that cannot be rapidly expanded in response to price signals alone.
The 2026 Outlook: Deficit Widens Despite Lower Demand
Demand Forecast: Continued Softness
Total silver demand in 2026 is projected to decline a further 2% to approximately 1.11 Boz, driven by:
- Double-digit declines in jewelry and silverware as elevated prices continue suppressing fabrication volumes
- A 3% fall in industrial demand, primarily driven by a marked further slowdown in photovoltaic offtake
- A partial offset from coin and bar demand, forecast to jump 18%, as investment interest remains elevated globally
Mine Supply: Flat Production, Widening Structural Gap
Global mine production is expected to remain essentially flat in 2026. Grade-related pressures, operational challenges, and depletion effects across key producing regions are expected to offset growth at a limited number of assets. With production stable and demand declining only modestly, the structural market deficit is forecast to widen to 46.3 Moz in 2026. An analysis from Mining Journal confirms that the 2025 market deficit was a primary driver of the price squeeze experienced across that period.
Scenario Analysis: Bull, Base, and Bear Cases for Silver
| Scenario | Key Assumptions | Likely Price Implication |
|---|---|---|
| Bull Case | Deficits persist; investment demand accelerates; lease rates stay elevated | Renewed rally toward prior highs; potential for new all-time highs |
| Base Case | Deficit narrows gradually; industrial demand stabilises; mine supply edges higher | Prices consolidate at historically elevated levels with continued volatility |
| Bear Case | PV thrifting accelerates sharply; US rate expectations rise further; investor demand retreats | Correction toward US$70–80 range; lease rates normalise |
The broader macroeconomic and geopolitical environment adds complexity to all three scenarios. Elevated policy uncertainty, sovereign debt concerns across major economies, and ongoing debate about the long-term role of the US dollar in global reserve frameworks all provide structural support for precious metals broadly. Near-term headwinds from rising US interest rate expectations have contributed to the price correction seen in early 2026, though whether these pressures are sustained or transitory remains the central short-term question for market participants. In addition, monitoring the gold-silver ratio provides a further analytical lens for assessing relative value between the two metals.
The next major ASX story will hit our subscribers first
Structural Squeeze vs. Speculative Episode: An Important Distinction
Understanding the type of market stress is as important as understanding its magnitude. The silver market has experienced dramatic dislocations before, most famously during the 1980 Hunt Brothers episode, which drove prices to then-record levels before collapsing. That event was fundamentally speculative in origin: a deliberate attempt to corner the physical market through concentrated futures and physical accumulation.
The current silver market liquidity squeeze and deficit trends are structurally distinct. The tightness reflects genuine, multi-year demand exceeding supply across industrial, investment, and consumer segments simultaneously, compounded by the price-inelasticity of a by-product-dominated supply structure. Structurally-driven squeezes tend to produce more sustained price support because the underlying imbalance cannot be resolved simply by unwinding speculative positions. Restoring equilibrium requires either new mine supply, which takes years to develop, or a sustained demand contraction, which in silver's case would require a meaningful slowdown across multiple end-use sectors simultaneously.
Disclaimer: This article is for informational purposes only and does not constitute financial advice. All forecasts, projections, and scenario analyses represent analytical estimates subject to significant uncertainty. Investors should conduct their own due diligence before making investment decisions involving silver or silver-related assets. Past price performance is not indicative of future results.
Frequently Asked Questions: Silver Market Liquidity Squeeze and Deficit Trends
What does a silver market liquidity squeeze mean for everyday investors?
A liquidity squeeze means physical silver becomes harder to source at normal premiums above spot, lease rates rise sharply, and price movements become more amplified in both directions. For investors, this environment typically increases both the potential opportunity and the downside risk associated with silver exposure. The key insight is that thin-inventory markets punish both latecomers to rallies and those who hold through corrections.
How many consecutive years has silver been in a structural deficit?
The silver market has recorded a structural deficit for five consecutive years through 2025, with a sixth consecutive deficit forecast for 2026. The cumulative drawdown on above-ground stocks since 2021 is estimated at approximately 762 to 800 million ounces.
Why can't silver mine supply simply increase to meet demand?
Approximately 70 to 75% of silver is produced as a by-product of mining other metals, primarily copper, gold, lead, and zinc. Supply decisions are governed by the economics of those primary metals, not by silver prices. This creates structural inelasticity that prevents the market from self-correcting at the pace seen in commodities with predominantly primary production.
What caused silver prices to hit an all-time high above US$121 in January 2026?
The convergence of multi-year inventory drawdowns, an acute October 2025 liquidity squeeze driven by CME vault reallocations, rising ETP holdings, elevated lease rates, and accelerating investment demand globally propelled silver to its all-time high above US$121 on January 29, 2026.
Is the photovoltaic sector still a growth driver for silver demand?
While solar energy expansion remains a long-term structural demand driver, PV manufacturers accelerated silver thrifting and substitution in 2025 in response to rising raw material costs and competitive pressures. The relevant metric is silver content per panel, not installation volumes. Thrifting means per-unit silver intensity is declining even as total installations grow.
What is the significance of North American silver mine output hitting a 10-year low?
North American mine production fell 3% in 2025 to its lowest level in a decade, removing meaningful supply from a historically important producing region. This structural decline, combined with operational and grade-related challenges globally, reinforces the supply-side constraints that prevent the market from closing its deficit through production growth alone.
Further reading: The Silver Institute's World Silver Survey 2026, researched and produced by Metals Focus, provides comprehensive annual data on silver market dynamics across supply, demand, and price segments and is available at silverinstitute.org.
Want To Stay Ahead of the Next Major Mineral Discovery on the ASX?
Discovery Alert's proprietary Discovery IQ model delivers real-time alerts on significant ASX mineral discoveries, turning complex market data into actionable investment insights — explore the historic returns major discoveries have generated and begin a 14-day free trial to position yourself ahead of the broader market.