
June 9, 2026
The Hidden Mechanics Behind Commodity Market Dislocations
Most investors focus on price. Few focus on plumbing. In commodity markets, however, the distinction between what trades on paper and what can physically move through a supply chain is often where the most dramatic dislocations originate. Silver sits at a uniquely precarious intersection of financial market complexity, industrial necessity, and thinning physical inventory, making it one of the more structurally vulnerable commodities in today's global market landscape.
Understanding whether a silver physical market squeeze is a realistic near-term scenario, or simply compelling narrative, requires breaking down the mechanics with precision rather than reacting to headlines.
When big ASX news breaks, our subscribers know first
How Does a Silver Physical Market Squeeze Actually Work?
The Gap Between Paper and Physical Markets
Silver trades across multiple market layers simultaneously. Futures contracts, exchange-traded funds, and derivatives allow enormous volumes of silver exposure to change hands daily, far exceeding the amount of physical metal that could realistically be delivered at any given moment. This is normal market functioning, not fraud. Problems emerge when a critical mass of buyers stops treating paper exposure as sufficient and begins demanding actual, deliverable metal instead.
A silver physical market squeeze occurs precisely at this boundary. When requests for delivery overwhelm what clearing networks, exchange vaults, and wholesale distributors can supply in real time, the physical market decouples from the paper market. Prices in the physical layer begin to command premiums over quoted futures prices, lease rates spike as metal becomes genuinely difficult to borrow, and the broader market structure faces stress it was not designed to absorb quickly.
It is worth emphasising the critical distinction: paper silver prices can rise sharply without any physical squeeze occurring at all. A true physical squeeze is a supply-side crisis in deliverable metal, not simply a bull market. For a broader view of how this fits into the precious metals market analysis, it is useful to examine silver's specific structural vulnerabilities alongside those of gold.
The Four Stress Signals That Define a Real Squeeze
Monitoring a handful of specific indicators simultaneously provides the clearest diagnostic picture of whether physical tightness is developing into something more serious.
| Stress Indicator | What It Measures | Reported Status (2025) |
|---|---|---|
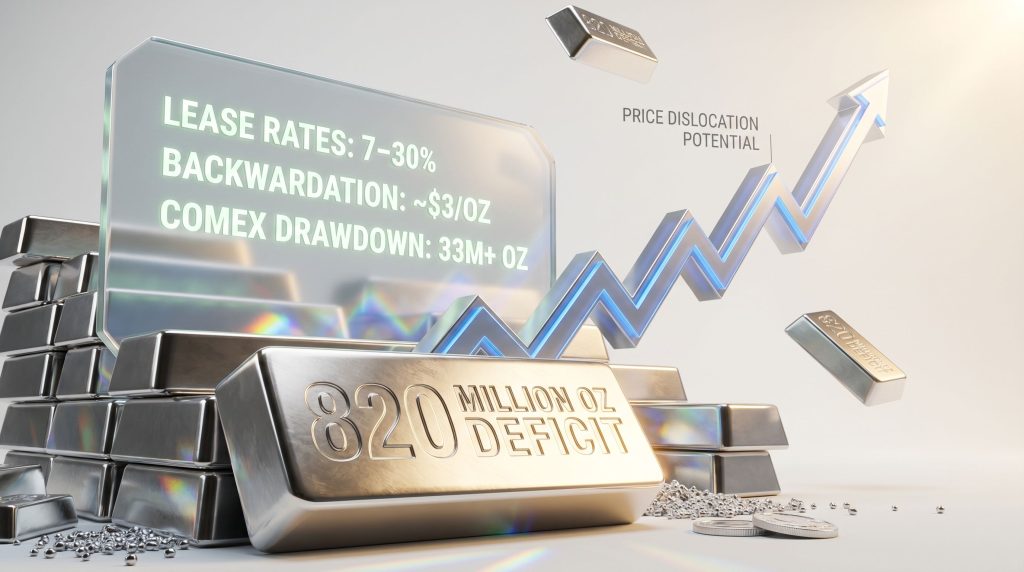
| Lease Rates | Cost to borrow physical silver | Reported spikes into the 7-30% range in London |
| Backwardation | Spot price trading above futures | London spot reported approximately $3/oz above NY futures |
| COMEX Inventory Drawdowns | Registered stocks available for delivery | Over 33 million ounces reportedly withdrawn in a single week |
| Bid-Ask Spreads and Premiums | Physical sourcing difficulty | Widening observed in wholesale markets |
When multiple stress signals fire simultaneously, including rising lease rates, backwardation, and accelerating inventory drawdowns, the probability of a genuine physical dislocation increases sharply. A single indicator in isolation is insufficient evidence of a squeeze.
Note: Specific figures cited in this article, including lease rate levels, backwardation spreads, and inventory drawdown volumes, reflect figures reported in market commentary as of 2025. Readers should verify these against primary data sources including COMEX daily inventory reports, Bloomberg lease rate data, and LBMA vault statistics before making investment decisions.
What Does the Structural Supply Deficit Tell Us About Silver's Vulnerability?
Six Years of Consecutive Deficits
Silver's current vulnerability did not emerge suddenly. The market has reportedly run a supply deficit every year since 2021, with the cumulative shortfall estimated at approximately 820 million ounces through 2025. Annual deficits running at roughly 168 million ounces per year represent a persistent structural erosion of available inventories, not a temporary blip.
This matters because silver's dual role as both a precious metal and an industrial commodity sets it apart from gold in a critical respect. Gold, once mined, tends to remain in circulation in some recoverable form, whether as jewellery, central bank reserves, or financial instruments. Silver, by contrast, is consumed industrially in quantities that make recovery uneconomical. Thin-film solar cells, electronic circuit boards, medical devices, and military hardware use silver in ways that are not practically reversible. Each year of deficit permanently reduces the buffer between normal market tightness and an acute dislocation event.
Furthermore, the ongoing silver supply deficits underscore just how structurally exposed the market has become, with no near-term resolution apparent from either the mining supply side or industrial demand moderation.
Gold vs. Silver: A Structural Comparison
| Factor | Gold | Silver |
|---|---|---|
| Above-ground stock availability | High, most mined gold remains in some form | Low, large portion consumed industrially |
| Annual deficit pressure | Moderate | Severe, ongoing since 2021 |
| Market depth | Deep and liquid | Thinner and more volatile |
| Industrial consumption rate | Low | High and growing |
| Squeeze vulnerability | Comparatively lower | Significantly higher |
COMEX registered inventories, specifically the metal formally committed and available for exchange delivery, have experienced material and rapid drawdowns. The distinction between eligible inventory (metal stored in approved vaults but not yet committed for delivery) and registered inventory (metal formally available for contract delivery) is often misunderstood. When registered stocks decline sharply, the practical buffer between contractual obligations and available supply narrows in ways that can accelerate a dislocation.
Could Industrial Panic Buying Trigger an Overnight Price Explosion?
The Palladium Precedent
Approximately three decades ago, the palladium market experienced a textbook industrial demand shock. Automotive manufacturers, reportedly including a major American producer, began aggressively purchasing physical palladium after recognising that their catalytic converter production lines could not function without it. The trigger was not speculative positioning or financial engineering. It was operational necessity: production would stop without the metal.
The result was a dramatic and rapid price surge in palladium, compressing what might otherwise have been a gradual repricing into a comparatively brief and extreme dislocation. The key structural features that enabled this outcome were thin inventories, inelastic industrial demand, and competitive procurement among buyers who had no viable substitute and no price ceiling imposed by commercial logic.
Silver shares all three of these structural features today.
Consider the following scenario: if even one or two major manufacturers dependent on silver for solar panel fabrication, defence electronics, or semiconductor production concluded that forward supply could not be guaranteed, the incentive to begin accumulating physical inventory competitively would become overwhelming. Unlike financial speculators, industrial buyers cannot run their production lines on paper contracts.
Why Silver's Industrial Demand Profile Creates Unique Risk
- Solar photovoltaic manufacturing uses silver paste in panel construction, with demand growing alongside global renewable energy capacity
- Military and defence electronics rely on silver's unmatched electrical conductivity in applications where substitution is not operationally viable
- Medical technology and antimicrobial applications represent a further layer of non-discretionary consumption
- Electric vehicle components add another structural demand vector that grows with EV adoption rates
Each of these demand categories shares a critical characteristic: buyers cannot easily substitute away from silver without compromising product performance or abandoning technology pathways that have already attracted enormous capital investment.
The Government Stockpiling Wildcard
Industrial panic buying is one scenario. Sovereign strategic stockpiling is a separate and potentially more powerful one. Nation-states competing to secure critical material reserves operate with sovereign balance sheets that carry no commercial price ceiling. If two or more governments moved simultaneously to accumulate silver reserves in a geopolitical environment increasingly focused on supply chain resilience, the bidding dynamic could overwhelm available market depth in a compressed timeframe.
This scenario does not require governments to formally classify silver as a strategic resource or announce any specific policy. The mere recognition that inventories are thin and deficits are structural could be sufficient motivation for procurement decisions that individually seem manageable but collectively destabilise the market. In addition, the global silver market impact of geopolitical trade policies adds a further layer of unpredictability to an already fragile supply structure.
Is the Current Silver Market Squeeze Real or Overstated?
Reading the Data Critically
Physical tightness in silver markets is currently supported by multiple independent indicators, including reported lease rate spikes, backwardation between London spot and New York futures, and documented COMEX inventory drawdowns. The convergence of these signals is meaningful and warrants serious attention.
However, the severity and permanence of the squeeze remains a matter of genuine analytical debate. Some commentators describe current conditions as a structural credit crisis in the physical market. Others characterise the situation as cyclically tight but still functionally operational. Both positions deserve consideration rather than dismissal. For context on how silver's price positioning relates to gold, a gold-silver ratio analysis offers useful comparative perspective on relative valuation and historical precedent.
A Five-Step Diagnostic Framework
For investors and analysts seeking to distinguish genuine physical stress from paper market noise, the following sequential assessment is useful:
- Check lease rates – sustained rates above 5-7% signal genuine borrowing stress in the physical market rather than normal seasonal variation
- Monitor backwardation – spot prices consistently above near-term futures contracts indicate that immediate delivery commands a premium over forward supply
- Track COMEX registered stocks – distinguish carefully between eligible inventory and registered inventory; only the latter is formally available for exchange delivery
- Observe physical premiums – retail and wholesale premiums widening significantly beyond historical norms indicate genuine sourcing difficulty at the end-user level
- Watch industrial procurement signals – any public disclosure by manufacturers regarding supply chain hedging, emergency procurement, or forward buying represents a high-conviction warning indicator
A critical caution: some of the most aggressive silver squeeze narratives originate from sources with commercial interests in elevated silver prices. Cross-referencing lease rate data from institutional providers, exchange inventory reports, and industrial procurement disclosures provides a more reliable picture than any single-source analysis. For further context on how supply chain disruptions are feeding into current tightness, this detailed market overview provides useful additional context.
The Spectrum of Possible Outcomes
| Scenario | Primary Trigger | Likely Price Impact |
|---|---|---|
| Gradual tightening continues | Persistent deficits without panic buying | Moderate sustained upward pressure |
| Industrial panic buying event | Major manufacturers scramble for supply | Sharp, rapid price spike |
| Government strategic stockpiling | Sovereign demand enters market simultaneously | Extreme price dislocation |
| Paper market overwhelmed by physical demand | Delivery demands exceed registered stocks | Structural repricing event |
| Tightness resolves without squeeze | Inventory replenishment or demand softening | Price stabilises or retreats |
Which Market Indicators Should You Monitor for Early Warning Signs?
Daily and Weekly Metrics Worth Tracking
- COMEX registered silver inventory levels published daily, with accelerating drawdown trends being the key warning signal rather than absolute levels alone
- Silver lease rates across one-month and three-month tenors available through specialist commodity data providers, with sustained elevation above 5% representing a meaningful threshold
- London spot versus New York futures spread where persistent backwardation signals that the physical market is pricing immediate delivery at a structural premium
- LBMA vault stock reports providing monthly data on London wholesale holdings and long-term trajectory of freely available silver
- Physical premium surveys tracking retail dealer premiums above spot for coins and bars, which reflect end-user sourcing conditions independent of exchange dynamics
Structural vs. Cyclical Signals: A Practical Framework
| Signal Type | Example | What It Indicates |
|---|---|---|
| Structural | Multi-year supply deficit accumulation | Long-term supply and demand imbalance |
| Cyclical | Lease rate spike | Short-term borrowing stress in physical market |
| Event-driven | Government stockpiling announcement | Non-recurring demand shock |
| Technical | Backwardation in futures curve | Immediate delivery valued above forward contracts |
Understanding whether a given signal is structural, cyclical, or event-driven changes the appropriate analytical response significantly. A structural signal demands reassessment of long-term positioning. A cyclical signal may warrant tactical attention. An event-driven signal requires rapid reassessment of scenario probabilities. Consequently, investors who track all three signal types simultaneously are better positioned to distinguish noise from genuine inflection points. For a deeper understanding of what drives a silver squeeze and its broader market implications, specialist commodity analysis provides valuable additional context.
The next major ASX story will hit our subscribers first
Frequently Asked Questions: Silver Physical Market Squeeze
What is a silver physical market squeeze in simple terms?
A silver physical market squeeze occurs when demand for real, deliverable silver exceeds what the market can supply in the immediate term. Rather than a price rally driven by futures trading activity, a physical squeeze reflects genuine scarcity of metal that can be physically delivered, causing premiums, lease rates, and delivery stress to rise across wholesale and exchange networks simultaneously.
How is a silver squeeze different from a short squeeze?
A short squeeze involves financial participants who have sold silver short being forced to buy back contracts as prices rise, creating a self-reinforcing financial dynamic. A physical squeeze is fundamentally different, reflecting real-world scarcity of deliverable metal rather than financial positioning dynamics. The two can occur simultaneously and may reinforce each other, but their drivers and implications are distinct.
What happened to palladium that could happen to silver?
Palladium experienced a severe price dislocation when industrial manufacturers, particularly in the automotive sector, began competing aggressively for physical supply that was operationally non-negotiable for their production. Thin inventories combined with inelastic demand and competitive procurement produced a rapid, extreme price surge. Silver shares the structural characteristics of thin inventories, inelastic industrial demand, and a comparatively shallow market, making a similar dynamic at least theoretically plausible.
How significant are current silver inventory levels?
The silver market has reportedly accumulated a cumulative supply deficit of approximately 820 million ounces since 2021. COMEX registered stocks have reportedly experienced single-week drawdowns exceeding 33 million ounces, and London vault holdings of freely available silver have declined materially. These figures require verification against primary institutional data sources before being treated as confirmed.
Could silver prices really move dramatically in a short period?
Commodity markets with thin inventories, persistent deficits, and inelastic industrial demand have historically demonstrated the capacity for rapid and extreme price dislocations when a triggering event occurs. The palladium precedent illustrates this mechanism clearly. Whether silver experiences such an event depends on whether industrial or sovereign buyers move simultaneously and aggressively into the physical market. This remains a lower-probability tail risk scenario given current conditions, rather than a base case, but it is not negligible given the structural backdrop.
Key Takeaways: The Silver Physical Market Squeeze in Context
- The silver market is structurally vulnerable following six consecutive years of reported supply deficits totalling an estimated 820 million ounces
- Multiple stress indicators including lease rates, backwardation, and COMEX drawdowns are reportedly elevated simultaneously, confirming physical tightness that goes beyond simple price momentum
- The most credible squeeze scenario is industrial rather than speculative: manufacturers with non-discretionary silver demand competing for limited deliverable supply, mirroring the palladium experience of approximately three decades ago
- Government strategic stockpiling represents a second, potentially more powerful demand vector operating without a commercial price ceiling
- The five-step diagnostic framework, covering lease rates, backwardation, registered inventory, physical premiums, and industrial procurement signals, provides the most reliable early warning structure for monitoring developments
- Current tightness is supported by multiple independent indicators, but the full squeeze scenario remains a tail risk rather than a base case, and any specific numerical claims should be verified against primary institutional data sources before informing investment decisions
This article is informational in nature and does not constitute financial advice. Commodity markets carry significant risk, and the scenarios described involve forecasts and analysis that may not reflect actual market outcomes. Readers should conduct independent research and consult qualified financial professionals before making investment decisions.
Want To Stay Ahead Of The Next Major Mineral Discovery?
Discovery Alert's proprietary Discovery IQ model delivers real-time alerts on significant ASX mineral discoveries, transforming complex market data across more than 30 commodities into clear, actionable insights for both short-term traders and long-term investors. Begin your 14-day free trial today and explore Discovery Alert's discoveries page to understand how historic finds have generated substantial market returns — positioning yourself well ahead of the broader market.