August 12, 2026
When Resistance Becomes the Story: Understanding Silver's Most Consequential Price Level
Commodity markets have a peculiar relationship with round numbers. Institutional algorithms, options market makers, and discretionary traders all cluster their decision points around psychologically weighted levels, creating self-fulfilling zones of friction that price action must overcome with conviction rather than momentum alone. The silver price breakout above $60.54 is not a story of weakness — it is a story of a market confronting a technically reinforced ceiling at precisely the moment when macro conditions are most aligned to push through it.
Understanding why this level matters, what forces are converging beneath it, and what happens on either side of resolution requires examining the technical architecture, the macroeconomic transmission mechanisms, and the structural shifts reshaping how silver is priced and delivered globally. Furthermore, silver's dual role as both a precious metal and an industrial commodity adds further complexity to this picture.
When big ASX news breaks, our subscribers know first
Why $60.54 Is a Compound Resistance Level, Not Just a Number
Most traders understand that the $60 level carries psychological weight in silver markets. Far fewer appreciate that $60.54 is actually more technically significant than the round number itself, precisely because it represents the simultaneous convergence of two independent analytical frameworks at the same price point.
The 38.2% Fibonacci retracement level from the prior swing high lands at approximately $60.22, while the upper Bollinger Band under current volatility conditions sits at $60.54. When two unrelated technical systems identify the same price zone as resistance, institutional algorithms monitoring both signals treat that zone as a high-conviction selling area. This is what makes $60.54 a compound resistance level, and why a genuine silver price breakout above $60.54 requires more than an intraday spike to carry meaningful weight.
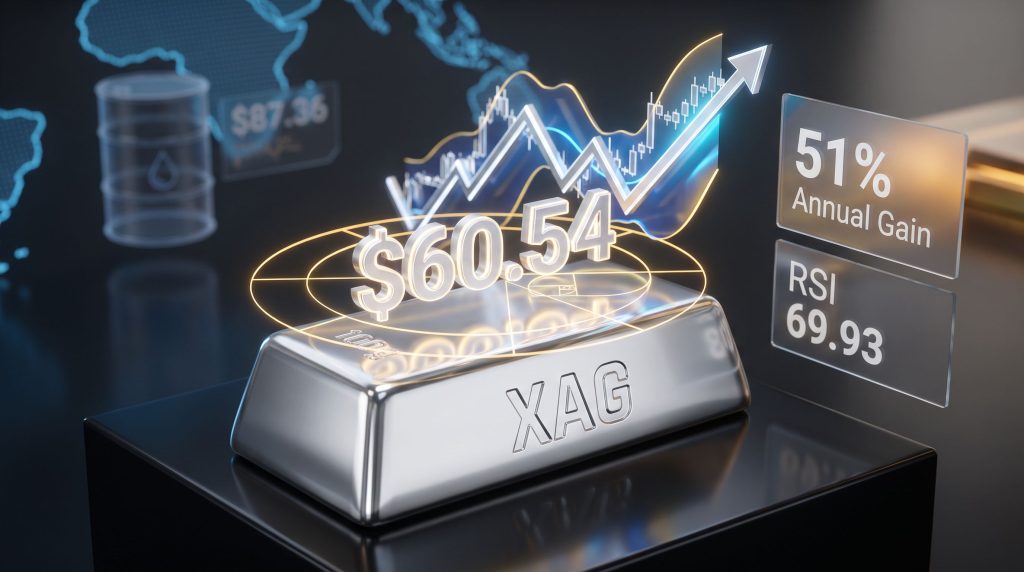
The broader context makes this picture more interesting. Silver advanced approximately 51% over the trailing twelve months, climbing from a base near $39 to a recent high of $59.54 before stalling at the current resistance zone. The most recent monthly reading shows a 3.56% pullback, which is statistically unremarkable within a bull trend of this magnitude. Prior silver bull cycles offer useful calibration here:
- The 2010–2011 silver run saw multiple 8–15% corrections within a broader rally that ultimately exceeded 170% from trough to peak before exhausting itself.
- The 2020 silver surge produced similar intra-rally drawdowns before the metal briefly crossed $29 and then consolidated for years.
- In both cases, a sub-4% monthly pullback within an annual gain exceeding 40% proved to be consolidation rather than cycle termination.
The current RSI reading of 69.93 sits just below the conventional 70 overbought threshold. This is where interpretation becomes nuanced. RSI at this level does not independently signal reversal. The critical distinction is whether RSI is diverging from price — where the indicator fails to make a new high alongside price, signalling exhaustion — versus converging at elevated levels alongside price, which confirms momentum. Current conditions reflect the latter. Reviewing gold-silver ratio analysis alongside these RSI readings can provide additional context for positioning decisions.
The Three Forces Converging Below the Breakout Level
Silver's position at $59.54 is not the product of a single catalyst. It sits at the intersection of three distinct macroeconomic forces, each of which independently supports higher prices, and collectively they create a more durable foundation than momentum-driven rallies typically possess.
Geopolitical Supply Disruption and the Oil-to-Silver Transmission Pathway
Houthi attacks on Red Sea commercial shipping lanes disrupted global oil transit infrastructure, while simultaneous strikes on the Caspian Pipeline Consortium export terminal compounded the supply shock by reducing throughput capacity across a separate major export route. The combined effect drove crude oil up 3.58% in a single session to approximately $87.36 per barrel.
The connection between crude oil and silver is less obvious than gold's safe-haven linkage but arguably more durable in inflationary environments. Rising energy prices flow through to broader consumer price indices with a lag of roughly four to eight weeks, elevating CPI expectations before the data itself registers. Elevated inflation expectations compress real yields on fixed income instruments, reducing the opportunity cost of holding non-yielding assets like silver.
The oil-to-silver pathway therefore operates through the real yield mechanism rather than through direct safe-haven demand. President Trump's public dismissal of ongoing Iran negotiations, combined with warnings of further military action, reinforced the geopolitical risk premium embedded in both crude oil and precious metals pricing. The trade war impact on silver compounds this dynamic, as escalating trade tensions further suppress real yields and support the case for precious metal exposure.
Federal Reserve Policy Ambiguity and the Stagflationary Signal
ADP employment data revealed that US private sector employers added an average of approximately 16,500 jobs per week during the most recent measurement period, down from 19,250 in the prior comparable period. This marked the fourth consecutive deceleration in labour market momentum — a pattern that would ordinarily signal growing confidence in a rate hold or cut. However, it is arriving simultaneously with energy-driven inflation pressure, creating a genuinely stagflationary signal set.
Markets have responded by pricing a near-term Fed hold while simultaneously assigning greater than 55% probability to a September rate increase. This paradox has specific implications for silver:
- Weakening employment reduces the Fed's justification for additional tightening on growth grounds.
- Rising energy-driven inflation gives the Fed cause to maintain or raise rates on price stability grounds.
- Silver benefits from both components of this dynamic: employment weakness supports risk-off safe-haven demand, while inflation pressure supports the commodity's hedge function.
"Silver is one of the few assets that performs constructively under both the inflation-hedge thesis and the safe-haven thesis simultaneously. When both are active at the same time, as they currently appear to be, the asset receives demand from two distinct investor populations rather than one."
The September FOMC Meeting as Binary Catalyst
The September Federal Open Market Committee meeting has become the single most consequential near-term macro event for silver price direction. A confirmed rate hike would strengthen the US dollar and increase the nominal opportunity cost of holding silver, likely pressuring prices back toward the $58.10 Ichimoku Cloud support. A hold or pivot, however, would strengthen the inflation-hedge narrative and provide directional clarity for a breakout attempt above $60.54.
Technical Levels That Define the Trade
The full technical architecture around silver's current position can be summarised as follows:
| Technical Indicator | Level | Implication |
|---|---|---|
| 38.2% Fibonacci Retracement | ~$60.22 | First layer of compound resistance |
| Upper Bollinger Band | ~$60.54 | Second layer of compound resistance |
| RSI (14-period) | 69.93 | Approaching overbought; not yet diverging |
| 200-Period SMA | ~$62.85 | Primary institutional target above breakout |
| SuperTrend Flip Level | $57.37 | Bearish structure trigger on sustained 5-hour close |
| Ichimoku Cloud Support | ~$58.10 | Lower-risk re-entry zone on pullback |
| Cycle Low | $55.10 | Maximum bear scenario downside target |
The Three Scenarios Every Silver Participant Should Map
Base Case: Extended Consolidation Between $58.50 and $60.54
Silver continues oscillating within the current range as macro catalysts remain unresolved ahead of the September FOMC. This scenario suits range-bound strategies with clearly defined entry and exit parameters and is likely to persist until the Fed provides directional clarity.
Bull Case: Confirmed Close Above $60.54
A sustained close above $60.54 removes the compound resistance and opens the path toward $61.81 as the first intermediate target. The secondary objective at $62.85 aligns with the 200-period simple moving average, a level that historically attracts additional institutional participation. Broader analyst price forecasts identify $63–$64 as the next meaningful resistance cluster, with extended scenarios projecting $68–$69 and above.
Bear Case: Five-Hour Close Below $57.37
A sustained breach of $57.37 triggers a SuperTrend indicator reversal and technically invalidates the recovery structure built from the $55.10 cycle low. This scenario most credibly materialises if the Fed signals an accelerated tightening path or if geopolitical risk premiums rapidly unwind following diplomatic progress in the Middle East.
"The $58.50 to $59.50 range represents a structurally weak entry zone where price is neither at confirmed support nor confirmed breakout. Entering within this band provides an asymmetrically poor risk-reward profile. Waiting for resolution above $60.54 or below $57.37 offers substantially cleaner decision logic."
Market Infrastructure Shifts That Most Silver Analysts Are Missing
Price action dominates headlines, but two structural developments in the silver market deserve attention from investors focused on the medium and longer-term trajectory.
Asia's New Physical Settlement Venue
The Abaxx Exchange launched a US dollar-denominated silver futures contract sized at 1,000 troy ounces with physical delivery into Singapore-based vaults. Within the first 14 trading days, the contract accumulated volume exceeding 30,000 contracts — a remarkably rapid adoption rate for a newly established derivatives venue.
The significance extends beyond the volume figure. London and New York have historically functioned as the dominant price discovery hubs for silver, with Asian buyers largely acting as price takers. A regionally anchored physical settlement venue gives Asian market participants a mechanism to influence price formation directly. Over time, this decentralisation of pricing power tends to tighten the relationship between paper silver contracts and actual physical market conditions, reducing the ability of speculative positioning alone to drive sustained price divergence from physical fundamentals. Broader silver market dynamics in 2025 suggest this structural shift could accelerate the timeline for a decisive breakout.
North American Production Restarting After Decades of Dormancy
Bunker Hill Mining recommissioned its Idaho processing facility after a 45-year operational hiatus, with the plant designed to handle between 1,800 and 2,500 tonnes of material per day. The restart signals that producers are responding to elevated price signals, but it also highlights a structural constraint that underpins the longer-term bull thesis.
Silver mine supply cannot respond quickly to price increases. A 45-year gap in operations means permitting timelines, workforce rebuilding, infrastructure rehabilitation, and technical commissioning all extend the lag between price signal and production response. In addition, persistent silver supply deficits across consecutive annual cycles suggest new supply from legacy operations will moderate short-term spikes but is unlikely to resolve the multi-year structural imbalance. Notably, technical breakout signals from independent analysts reinforce the view that structural supply constraints remain a key price support.
Positioning Strategy Across Three Investor Profiles
The same price environment presents very different opportunities and risks depending on investment horizon and risk tolerance.
Short-Term Tactical Traders should note that the optimal defined-risk entry remains a pullback toward the Ichimoku Cloud near $58.10, with a stop-loss at $57.30 and a first profit target at $61.81 on confirmed breakout. Breakout chasers entering above $60.54 should require a sustained closing basis confirmation — not an intraday spike — before treating the level as resolved.
Medium-Term Investors with a 1–6 Month Horizon face the highest macro uncertainty of the three profiles. The September FOMC meeting represents a binary catalyst that could meaningfully alter the risk-reward in either direction. Consequently, physical silver and silver-linked instruments offer exposure without the leverage risk that amplifies short-term volatility in derivative positions.
Long-Term Structural Bulls have the strongest analytical foundation at current levels. A 51% annual gain combined with a persistent multi-year supply deficit suggests the consolidation near $60 may represent a mid-cycle pause rather than a terminal peak. Extended price targets cited across independent analyst research span $68–$69 and, in higher-conviction scenarios, above $75.
The next major ASX story will hit our subscribers first
Reference Table: Key Levels and What They Mean
| Scenario | Trigger Level | Next Implied Target |
|---|---|---|
| Breakout Confirmation | Above $60.54 (sustained close) | $61.81, then $62.85 |
| Extended Bull Target | $63–$64 resistance cluster | $68–$69 momentum extension |
| Pullback Re-entry | ~$58.10 Ichimoku Cloud | Stop at $57.30 |
| Bearish Invalidation | Below $57.37 (5-hour close) | Retest of $55.10 |
| Cycle Low Reference | $55.10 | Maximum bear scenario floor |
The silver price breakout above $60.54 remains the threshold the market is watching, but its resolution will be shaped by forces operating well above the chart. Whether the Fed holds or hikes in September, whether geopolitical tensions in the Middle East persist or de-escalate, and whether the physical market infrastructure expanding across Asia provides enough demand depth to absorb selling pressure at the compound resistance zone are the three questions that will determine which scenario prevails.
Patience at this level is not passivity. It is the analytically correct posture until one of those questions produces a definitive answer.
This article is for informational purposes only and does not constitute financial advice. All price targets, scenario projections, and technical levels referenced represent analytical frameworks and should not be interpreted as guarantees of future price performance. Readers should conduct their own due diligence before making investment decisions.
Want to Know When the Next Major Silver Discovery Hits the ASX?
Discovery Alert's proprietary Discovery IQ model scans ASX announcements in real time, instantly identifying significant mineral discoveries — including silver — and delivering actionable alerts before the broader market reacts. Explore how historic discoveries have generated extraordinary returns on the Discovery Alert discoveries page, then begin your 14-day free trial to position yourself ahead of the market.