July 18, 2026
Assessing the Gravity of the Silver Supply Deficit Crisis
The global silver supply deficit has emerged as a defining feature in the precious metals landscape over the last five years. Since 2021, silver demand has consistently outpaced supply, resulting in a compounding shortfall with far-reaching consequences. A cumulative market deficit is projected to surpass 800 million ounces by the end of 2025—equivalent to approximately ten months of global mining output. This extended imbalance is historically significant even when compared to previous periods of mining deficits, dramatically altering risk calculations for investors and industrial users.
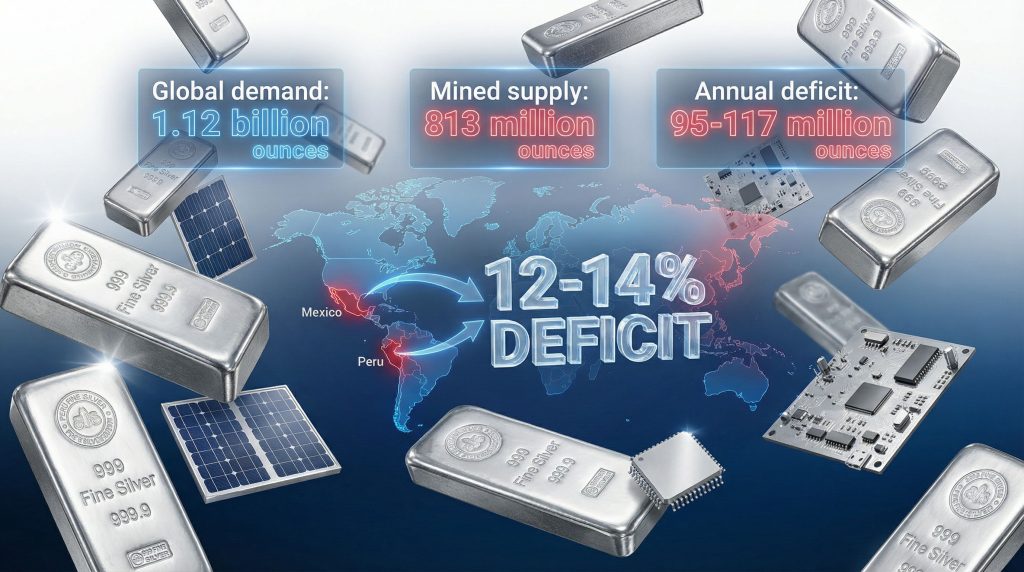
Market dynamics throughout 2024 and 2025 provide further context. In 2024 alone, the structural deficit reached 148.9 million ounces, and forecasts for 2025 point to an annual gap of 95-117 million ounces. This means global demand, estimated at 1.12 billion ounces, exceeds mined supply of 813 million ounces by 12-14%. According to specialist market consultancies, the magnitude of this deficit is rare among industrial commodities.
Technical Mechanisms Intensifying the Deficit:
- Physical liquidity in global trading hubs is increasingly tight, affecting London, New York, and Shanghai.
- Metal flows between markets, driven by tariff and regulatory factors, are offering only transient relief rather than resolving shortages.
- Efforts to move metal between locations have only delayed, not prevented, acute episodes of price volatility—April and October of 2025 both saw silver squeeze events, with prices surging above $50 and even touching $80 due to instantaneous supply-demand mismatches.
Metals consultancy research underscores that silver's relatively small market capitalisation amplifies the price impact of inventory shifts and policy changes, with sharp upside risk as liquidity dries up. These persistent deficits and volatility cycles have made investors and commercial users acutely aware of the ongoing crisis.
When big ASX news breaks, our subscribers know first
Forces Powering Record Silver Demand
Silver's current demand scenario is shaped by the convergence of robust industrial consumption and unprecedented investor participation. The two forces reinforce each other, creating powerful, self-reinforcing feedback loops within the physical and financial markets.
Industrial Growth Engines
Today, industrial applications absorb roughly 60% of annual silver supply. Furthermore, examining the supply deficit drivers reveals segment-by-segment breakdowns that illustrate silver's critical role:
-
Solar Panel Manufacturing
- Currently accounts for 15% of global silver demand
- On track to reach 20% by 2030, underpinned by an 8-12% compound annual growth rate
-
Electronics and Semiconductors
- Integration of advanced chips for 5G, AI, and EV platforms is scaling up silver consumption per unit
- Grid modernisation and renewable energy infrastructure also raise silver's use in high-end manufacturing
-
Electric Vehicle Components & Renewable Energy
- Silver's unparalleled conductivity is critical for battery contacts, power inverters, and grid interconnections
Ongoing efforts to reduce silver content per unit—through technological substitutions or material thrift—have thus far only marginally dampened the net upward trajectory in total demand.
Investment and Monetary Demand Wave
Institutional allocations and retail buying both played leading roles as silver evolved from a niche hedge to a mainstream portfolio diversifier during the last five years. Key indicators include:
- Exchange-traded product (ETP) holdings surged 18% through November 2025
- Macroeconomic and geopolitical uncertainty drove broad-based portfolio rebalancing toward tangible assets
- High-profile market events, persistent inflation fears, and U.S. policy volatility further incentivised physical accumulation
Geographically, U.S. and European investors have dominated recent inflows, while Asia's participation spikes in response to international trade or currency policy events. Unlike gold, silver investment demand can quickly become the marginal driver of price and inventory, particularly when industrial users are unwilling to reduce or reschedule their own offtake.
Market Insight:
Investment flows are increasingly responding to macro signals such as Federal Reserve monetary pivots, rising national debt, and de-dollarisation trends. Monetary easing, especially when combined with trade policy unpredictability, has made non-yielding stores of value like silver attractive even in traditionally yield-hungry portfolios.
What Are the Structural Constraints on Mining Supply?
Why have silver miners failed to respond with increased output, despite historic price incentives? The answer lies within the unique geology and economics of silver supply, particularly considering the silver supply constraints affecting global markets.
Byproduct Dependency—A Hidden Bottleneck
| Primary Metal | Silver Byproduct % | Production Driven By |
|---|---|---|
| Copper | 35% | Copper market economics |
| Zinc | 25% | Zinc market economics |
| Lead | 15% | Lead market economics |
| Gold | 5% | Gold price trends |
Around 75-80% of all silver mined globally is recovered as a byproduct from deposits primarily developed for other metals. Only 20-25% originates from mines directly targeting silver.
Implications:
- Even significant price gains in silver do not reliably trigger increased output, as the majority of global supply is tethered to base metal market cycles.
- If copper, zinc, or lead prices decline, corresponding reductions in base metal output also reduce global silver production, even if silver prices are high.
- The capital and regulatory requirements involved in pivoting from byproduct to primary silver extraction are significant and rarely economically feasible on relevant timeframes.
Declining Grades and Concentration Risks
Silver mine production is down by 8% from the 2016 peak, primarily due to:
- Ore grades persistently declining in mature mining districts
- Operational interruptions from weather events, permit delays, and labour unrest
- Closure of marginally profitable mines unable to justify the requisite capital investment in the face of tightening regulation and rising costs
Countries such as Mexico and Peru together represent nearly 40% of primary silver output, amplifying political and geographic risk. Regional disruptions—like social unrest or regulatory crackdowns—can send global markets into immediate turmoil.
New Production: Timelines and Technical Hurdles
Bringing new primary mines online involves:
- Exploration and Discovery: 2-5 years of geological surveys and resource estimates
- Permitting and Environmental Approvals: 1-3 years, highly variable by country
- Development and Construction: 2-4 years for requisite infrastructure and ramp-up
- Full Production: Typically achieved 5-12 years from initial discovery
Rising environmental standards and regulatory bottlenecks impose further delays and costs, making rapid supply response structurally impossible even in the face of persistent deficits.
Recycling—Not a Silver Bullet
While recycling provides meaningful secondary supply, it is limited by:
- The diffusely distributed and consumptive nature of industrial silver use (e.g., lost in electronics, solar panels, and chemicals)
- Challenging global collection logistics for end-of-life products
- High extraction costs versus metal value in complex assemblies
Technological advances in recycling recoveries are ongoing, but their impact is incremental compared to structural demand growth.
Physical Silver Market Tightness: The Data Behind the Squeeze
Inventory data across major exchanges reveal the strain placed on physical silver markets by persistent deficits. In addition, the market squeeze impact demonstrates how these pressures affect global finance.
-
COMEX Registered Inventories
- 2020: Peaked at 346 million ounces
- Late 2023: Fell to 82 million ounces
- By 2025: Further reductions, with anecdotal reports of multiple industrial users unable to secure timely deliveries
-
London Metal Exchange Stocks
- Remaining silver inventories at historic lows
- Market makers experiencing delays and higher premiums when securing large volumes
How Do Lease Rates Signal Real-Time Scarcity?
Competition for remaining physical inventory is shown through sharply escalating lease rates:
- September 2025: Lease rates rose above **5%**—a multi-year extreme and a strong indicator of stress among dealers and industrial end-users.
- Normal lease rates historically hovered close to zero in well-supplied conditions.
Key Insight:
Profound, rapid depletion of exchange inventories is a structural consequence of the ongoing silver supply deficit. Unlike previous cyclical squeezes, current events are being driven by relentless physical drawdowns, not merely speculative paper trading or transient inventory bottlenecks. Furthermore, analysis from industry experts indicates this crisis is rewriting industry economics.
Inventory Depletion Table: COMEX Registered Silver
| Year | Inventory (million oz) |
|---|---|
| 2020 | 346 |
| Late 2023 | 82 |
| Late 2025 | <82 (estimated lower) |
Investment Risks and Opportunities Created by the Deficit
The structural silver supply deficit is redefining price discovery, procurement risks, and the spectrum of investment strategies. Moreover, understanding gold-silver ratio insights provides valuable context for investment decisions.
Market Stress and Price Mechanism Shifts
Depleted inventories and physical sourcing challenges are undermining traditional pricing models. Instead:
- Physical spot premiums remain elevated over futures prices, reflecting logistics and regional risk.
- Lease rate spikes and arbitrage-driven geographic metal flows (e.g., London to New York and back) create volatile, unpredictable intra-month price swings.
- The distinction between commercial versus investment demand is blurring, as both groups find themselves directly competing during periods of acute tightness.
Supply Chain and Industrial User Strategy
Companies dependent on silver are reassessing sourcing strategies to manage new volatility and uncertainty:
- Locking in contracts with higher premiums or stockpiling to mitigate future disruptions
- Allocating capital to research alternative materials, especially for price-sensitive manufacturing segments
- Improving recycling and scrap recovery where technically and economically viable
Portfolio Allocation and Speculative Opportunity
For investors, the unfolding supply crisis opens several avenues for participation:
- Physical Silver Holdings: High premiums may persist, but direct ownership provides exposure to ongoing physical scarcity.
- Mining Equities: Particularly those with primary silver output, as they hold leverage to rising prices and potential supply expansions.
- ETFs and ETPs: Institutional channels with increased functionality, though physical delivery risk becomes a factor in extreme conditions.
Note that elevated volatility may cut both ways—spikes followed by sharp corrections are typical during tight market cycles.
Disclaimer: Investing in silver or silver-related securities involves market risk. Forecasts are based on current supply, demand, and policy trends; future outcomes may diverge.
Projecting the Longevity of the Silver Supply Deficit
Mine Development Timelines
- Even the fastest-track mining projects rarely move from discovery to production in under five years.
- Complex permitting regimes and the rise of environmental and social impact standards—especially in prime silver jurisdictions such as Mexico and Peru—make decade-long lead times increasingly common.
Recycling Constraints
- Only a modest percentage of industrially consumed silver is currently recoverable. Most silver in solar panels, electronics, and batteries is effectively lost for years or decades due to technological or economic limits.
- Marginal improvements are being made in recycling, but these cannot offset rapidly compounding primary deficits.
Demand Curve Outlook
Structural trends underpinning demand growth are unlikely to reverse in the near term:
- National and regional net-zero energy targets will drive expanded deployment of solar, grid storage, and electrification—all silver-intensive sectors.
- Semiconductor and high-performance electronics demand will benefit from shifts in artificial intelligence, data centres, and next-generation communications growth.
- Continued geopolitical and monetary dislocation could catalyse further retail and institutional silver accumulation, reinforcing supply scarcity.
Consequently, a combination of slow-moving supply expansion, limited recycling, and robust multi-sector demand suggests the silver supply deficit is positioned to persist, with ongoing inventory depletion, sporadic volatility, and periodic price squeezes remaining core characteristics of the market.
The next major ASX story will hit our subscribers first
Table: Silver Supply Deficit at a Glance
| Year | Global Demand (oz) | Mined Supply (oz) | Annual Deficit (oz) | Exchange Inventories (COMEX, oz) |
|---|---|---|---|---|
| 2021 | ~1.05 billion | ~825 million | ~100-120 million | ~310 million |
| 2022 | ~1.08 billion | ~830 million | ~120 million | ~220 million |
| 2023 | ~1.10 billion | ~820 million | ~135 million | ~150 million |
| 2024 | ~1.11 billion | ~820 million | 148.9 million | 82 million |
| 2025 est. | 1.12 billion | 813 million | 95-117 million | <82 million (est.) |
Conclusion and Further Exploration
The silver supply deficit is not a transient anomaly but a structural phenomenon anchored in market mechanics, geological realities, and evolving global demand. For those seeking exposure, risk, and opportunity in the sector, the crisis offers both a cautionary tale and multiple strategies to navigate the challenges ahead.
For deeper insights into related markets, exploring similar trends in gold, platinum, and palladium can help contextualise silver dynamics within the broader precious metals complex.
This analysis does not constitute specific investment advice. Market conditions can change rapidly; investors should conduct their own due diligence or consult a qualified financial advisor before taking positions exposed to the silver supply deficit.
Looking for Silver Mining Opportunities on the ASX?
Discovery Alert's proprietary Discovery IQ model delivers real-time alerts on significant silver and precious metals discoveries across Australian markets, instantly empowering subscribers to identify actionable opportunities ahead of the broader market. Begin your 30-day free trial today and secure your market-leading advantage in this supply-constrained environment.