August 12, 2026
Why Silver's Supply Crisis Is Different From Any Commodity Shortage Before It
Most commodity shortages resolve themselves through a predictable mechanism: prices rise, producers invest, supply expands, and the gap closes. Silver is breaking that model entirely. The forces driving the current silver supply deficit and rising prices are not cyclical disruptions that a few new mines can fix. They are structural, compounding, and accelerating at a pace that conventional supply-side economics cannot easily address.
Understanding why requires stepping back from price charts and looking at the physical and industrial architecture of the silver market itself.
When big ASX news breaks, our subscribers know first
Silver's Dual Identity: Why No Other Metal Competes on the Same Terms
Silver occupies a genuinely unique position in the global commodity hierarchy. On one side of the ledger, it functions as a monetary asset with millennia of history as a store of value, moving in concert with gold during periods of financial stress and geopolitical uncertainty. On the other side, it is an indispensable industrial input with properties that modern technology increasingly cannot replicate.
Silver carries the highest electrical conductivity of any known element, outperforming copper on a per-weight basis in applications where efficiency is critical. This single physical characteristic explains why the metal has become embedded in solar photovoltaic systems, electric vehicle electronics, semiconductor packaging, and now AI data centre infrastructure. Furthermore, silver's dual role as both monetary and industrial asset means no credible substitute exists for many of these high-performance applications, which means demand is structurally inelastic in ways that distinguish silver from almost every other industrial metal.
The convergence of investment demand and industrial consumption creates a compounding price pressure mechanism unique to silver. When economic uncertainty rises, investment demand surges simultaneously with the industrial demand that the clean energy transition sustains year-round.
The United States has formally classified silver as a critical mineral, reflecting growing recognition among major economies that scarcity risk is real and strategically significant. This classification places silver alongside copper, lithium, and nickel in energy transition supply chains, though silver's supply constraints are arguably more severe given its byproduct dependency.
The Anatomy of a Multi-Year Silver Supply Deficit
Reading the Numbers: What the Data Actually Shows
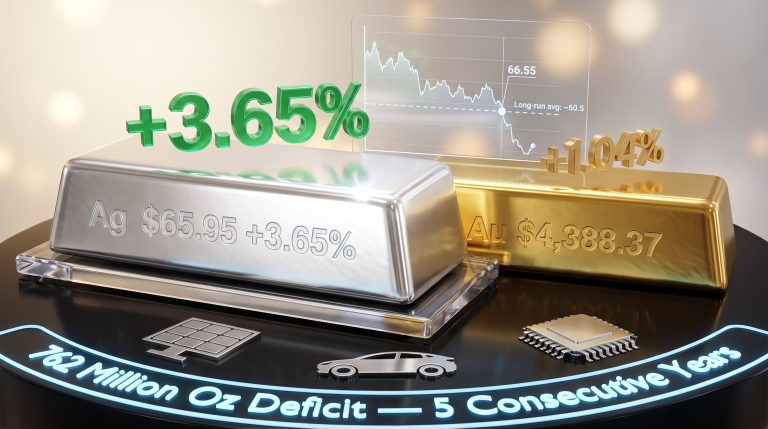
The silver market has recorded supply deficits for at least five consecutive years, running from 2021 through 2025, with 2026 projected to extend that streak to a sixth year. The numbers from the Silver Institute's World Silver Survey 2026 paint a clear picture:
| Metric | Figure |
|---|---|
| Global mine production (2025) | ~846.6 million ounces |
| Silver recycling contribution (2025) | ~197.6 million ounces (13-year high) |
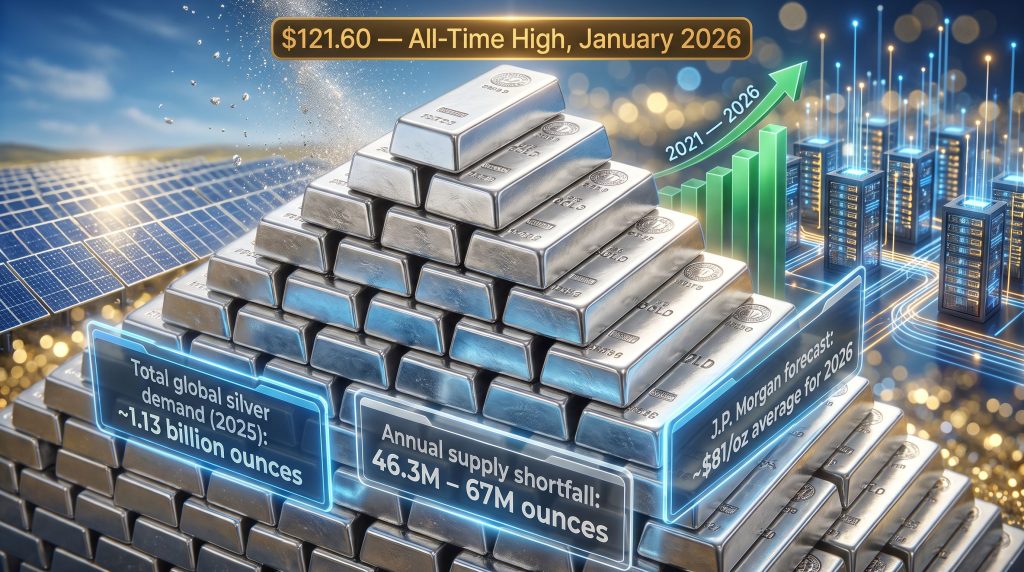
| Total global silver demand (2025) | ~1.13 billion ounces |
| Annual supply shortfall range (2026 forecasts) | 46.3 million – 67 million ounces |
| Consecutive years of market deficit | 5+ years (2021–2026) |
| JPMorgan estimated annual demand excess (peak years) | 100 – 250 million ounces |
What stands out in this data is that recycling reached its highest level in thirteen years and still failed to close the gap. This is a critical insight that often goes underappreciated in market commentary. When record recycling volumes cannot resolve a deficit, it signals that the shortfall is not a temporary inventory management problem but a fundamental imbalance between available production capacity and the scale of demand growth. For a deeper look at the figures underpinning these silver supply deficits, the trends become even more compelling on closer examination.
The Inventory Depletion Feedback Loop
Each year of deficit draws down above-ground stockpiles that once served as a buffer between supply disruptions and price volatility. As those buffers thin, the market becomes progressively more sensitive to demand surprises. A smaller annual deficit in 2026 compared to 2024 or 2023 does not indicate the market is healing; it indicates the market is operating with diminishing shock-absorbers.
Analysts who track physical silver flows between major trading hubs noted an episode of acute liquidity stress during 2026, when physical demand surged and inventories shifted rapidly between centres, briefly creating regional tightness. Conditions subsequently stabilised, but the episode illustrated how quickly a thin-inventory market can experience outsized price moves.
Why Silver Supply Cannot Simply Scale to Meet Demand
The Byproduct Problem: A Supply Ceiling Baked Into the Geology
Approximately 75% of global silver production is extracted not from dedicated silver mines but as a byproduct of zinc, lead, copper, and gold operations. This is perhaps the single most important and least understood structural constraint in the silver market.
When the primary metal being mined is copper or zinc, production volumes are governed by copper and zinc economics, not silver prices. A sustained rally in silver has limited power to incentivise production increases when the marginal production decision is being made by a zinc miner evaluating zinc margins. Silver is simply collected as a secondary revenue stream.
Decade-Long Development Timelines: The Time-Lag Problem
Even when dedicated silver mining projects are viable, they face a development timeline that makes near-term supply responses impossible. The journey from initial exploration through resource definition, feasibility studies, environmental approvals, permitting, financing, and construction to first production typically exceeds ten years for a new primary silver mine.
This structural lag means that even if silver prices remain elevated for years, new dedicated supply cannot arrive in time to address deficits within the current demand cycle. The industry is effectively locked into its existing supply base for the foreseeable future. Indeed, reviewing global silver production trends confirms that the largest operations are already running near their practical capacity ceilings.
Declining Ore Grades: The Hidden Cost Escalator
There is a geological dimension to the supply constraint that rarely receives attention outside specialist mining circles. Ore grade deterioration at many established silver-producing operations means miners must process progressively larger volumes of rock to extract each ounce of silver. This drives up energy consumption, water usage, reagent costs, and capital intensity per unit of output, making existing supply increasingly expensive to maintain even before any new capacity is considered.
A summary of the key supply-side constraints:
- Byproduct dependency: ~75% of output is tied to non-silver primary mining economics
- Extended development cycles: new primary mines require a decade or more to reach production
- Declining ore grades: rising extraction costs per ounce at established operations
- Geographic concentration risk: major producing regions carry operational and geopolitical exposure
- Regulatory and permitting complexity: environmental approval timelines continue to extend in most major mining jurisdictions
Industrial Demand: Five Sectors Pulling Silver in the Same Direction
Solar Energy: The Dominant Industrial Consumer
Solar photovoltaic manufacturing has become the single largest industrial consumer of silver globally. Every PV panel uses silver paste in its conductive pathways to collect and transmit electricity generated from sunlight. Panel manufacturers have engineered significant reductions in silver content per unit over the past decade, yet total solar-related silver consumption continues rising because global installation volumes are growing faster than efficiency gains can offset.
Research published in ScienceDirect projects that the solar sector alone could absorb up to 41% of total global silver production by 2030, a concentration of demand in a single end-use that has no precedent in the metal's history. If that projection proves accurate, disruptions to solar installation programmes would carry direct and measurable silver price implications.
Electric Vehicles: More Silver Per Vehicle, More Vehicles Per Year
Electric vehicles require significantly more silver than internal combustion engine equivalents due to their advanced battery management systems, power electronics, sensor arrays, and high-performance electrical connectors. As global EV adoption follows its projected multi-decade growth curve, the cumulative demand increment from transportation alone would represent a material and sustained addition to silver consumption.
The silver demand profile from EVs extends beyond the vehicles themselves. Charging infrastructure, smart grid integration systems, and emerging vehicle-to-grid (V2G) technology all rely on silver's conductivity properties, consequently compounding the demand signal from transportation electrification.
Artificial Intelligence Infrastructure: The Market's Newest Demand Driver
Perhaps the least anticipated source of silver demand growth is the global buildout of AI data centres. The computing hardware, semiconductor packaging, power distribution systems, and networking equipment required for large-scale AI infrastructure all incorporate silver for its thermal and electrical properties.
Technology companies are committing hundreds of billions of dollars to AI infrastructure globally, creating a demand stream for silver that is structurally independent of energy transition dynamics. This diversification of demand sources is significant because it reduces the silver market's vulnerability to any single sector slowdown.
Demand by Sector: A Snapshot
| End-Use Sector | Silver Application | Demand Trajectory |
|---|---|---|
| Solar PV | Photovoltaic cell conductors | Strongly rising |
| Electric vehicles | Electronics, battery systems, sensors | Strongly rising |
| AI data centres | Semiconductors, power management | Rapidly emerging |
| Smart electricity grids | Transmission and switching components | Growing |
| Consumer electronics | Circuit boards, connectors | Stable to growing |
| Industrial automation | Sensors, contacts, relays | Growing |
| Telecommunications | 5G infrastructure hardware | Growing |
Price Performance and Institutional Forecasts
Where Silver Trades Today and How It Got Here
Silver is currently trading in the range of $57 to $59 per ounce as of late July 2026, representing a level far above the metal's long-run historical averages. The path to current prices involved a surge of more than 130% during 2025 as investors responded to the combination of tightening supply conditions and accelerating industrial consumption. According to the Silver Institute's supply and demand data, the scale of this structural imbalance has been building for several years.
In January 2026, silver briefly touched an all-time high of approximately $121.60 per ounce before a substantial correction. Even after that pullback, the market has remained structurally well-supported, reflecting the durability of the underlying demand drivers rather than speculative excess.
What Major Institutions Are Projecting
| Institution / Source | Silver Price Forecast | Key Rationale |
|---|---|---|
| J.P. Morgan Global Research | ~$81/oz average for 2026 | Industrial consumption outpacing mine supply |
| Silver Institute (World Silver Survey 2026) | Continued deficit; elevated price support | Fifth consecutive year of structural shortfall |
| ScienceDirect Research (2030 projection) | Supply meets only 62%–70% of demand | Solar absorbing up to 41% of production |
| Reuters (February 2026 reporting) | ~$81/oz observed; all-time high ~$121.60 | Investment demand surge and physical tightness |
The Gold-to-Silver Ratio: A Historically Reliable Signal
Early in 2026, the gold-silver ratio climbed above 100, a level that historically has indicated silver is deeply undervalued relative to gold. This extreme reading reflected gold's outperformance during a period of acute geopolitical uncertainty and concerns about global trade dynamics, while silver's industrial demand exposure temporarily made it less attractive to risk-averse investors.
That relationship subsequently reversed as physical silver buying accelerated alongside rising prices for industrial metals, particularly copper. The ratio compressed to levels not seen in over a decade, signalling a meaningful shift in investor positioning. Historically, periods of ratio compression from extreme highs have often preceded further silver outperformance, though past patterns are not guarantees of future outcomes.
The next major ASX story will hit our subscribers first
The 2030 Scenario: When the Deficit Could Become Critical
What Research Models Are Projecting
The most sobering projections for the silver market come from academic and institutional modelling of the 2030 supply-demand balance. Under current demand trajectory assumptions, global silver mine production may satisfy only 62% to 70% of total demand by 2030, according to research published in ScienceDirect. The International Energy Agency's long-term mineral demand forecasts support the view that silver requirements will continue growing through 2040 as energy transition infrastructure scales globally.
Scenario Analysis: If solar installations continue growing at current rates and EV adoption follows projected curves, total silver demand could exceed 1.3 to 1.5 billion ounces annually by the early 2030s. Against a mine supply base that cannot quickly scale beyond 900 to 950 million ounces, the resulting structural gap would place sustained upward pressure on prices and potentially trigger material substitution research across multiple industries.
The Substitution Threshold: At What Price Does Technology Change?
A legitimate counterargument to the bullish silver thesis involves technological substitution. At sufficiently high prices, manufacturers have historically accelerated research into alternative materials or redesigned products to reduce dependence on expensive inputs. This dynamic has been observed in other commodity markets when price spikes persisted long enough to change engineering economics.
Silver's position is partially protected by its unique physical properties. Its electrical and thermal conductivity advantages over alternatives are most pronounced in high-performance, efficiency-critical applications like concentrated solar cells and advanced semiconductors, precisely the applications growing fastest. However, in lower-performance applications such as standard consumer electronics, substitution is more feasible and has already been occurring incrementally for years.
The substitution risk is real but likely to manifest gradually rather than abruptly, and it would require sustained high prices over an extended period to materially alter demand curves.
Silver Versus Other Energy Transition Metals: A Comparative Framework
The silver supply deficit and rising prices narrative gains additional context when compared to other metals competing for attention in energy transition portfolios. As analysts at Sprott Asset Management have noted, silver's structural constraints set it apart from metals where supply flexibility provides a natural corrective mechanism.
| Metal | Primary Demand Driver | Supply Flexibility | Deficit Status | Price Trend (2025–2026) |
|---|---|---|---|---|
| Silver | Solar, EVs, AI, electronics | Low (byproduct-dependent) | Persistent multi-year deficit | Strongly rising |
| Copper | Grid infrastructure, EVs | Moderate | Emerging deficit | Rising |
| Lithium | EV batteries | Moderate-high | Oversupply (near-term) | Declining |
| Nickel | EV batteries, stainless steel | High | Oversupply | Declining |
The contrast with lithium and nickel is particularly instructive. Both metals experienced demand excitement similar to silver but possessed higher supply flexibility, which allowed producers to expand output and ultimately create near-term oversupply conditions that crushed prices. Silver's byproduct dependency and decade-long development timelines effectively prevent this self-correcting mechanism from operating.
Frequently Asked Questions: Silver Supply Deficit and Rising Prices
What Is Causing the Silver Supply Deficit?
A persistent gap between total global silver demand, now exceeding 1.1 billion ounces annually, and combined mine production plus recycling output has created a structural shortfall. The deficit is driven by accelerating industrial consumption across solar energy, electric vehicles, AI infrastructure, and electronics, while supply growth remains constrained by the byproduct nature of most silver mining and decade-long timelines required to develop new dedicated mines.
How Many Years Has Silver Been in a Supply Deficit?
The silver market has recorded supply deficits for at least five consecutive years from 2021 through 2025, with 2026 projected to represent a sixth year of shortfall. Annual deficits have ranged from approximately 46 million to 250 million ounces depending on the methodology and year examined.
Could Silver Prices Reach $100 Per Ounce?
Institutional forecasts from J.P. Morgan project average silver prices of approximately $81 per ounce for 2026. Silver briefly reached an all-time high of approximately $121.60 per ounce in January 2026. If structural deficits deepen as projected through 2030 and solar demand continues absorbing an increasing share of available supply, price levels above $100 per ounce are within the range of plausible outcomes under bullish demand scenarios. This is speculative and should not be treated as financial advice.
Why Can't Silver Miners Produce More to Meet Demand?
Approximately 75% of global silver production is extracted as a byproduct of mining zinc, lead, copper, and gold. Production decisions for these primary metals are made independently of silver price signals, which limits the supply response. Additionally, developing a dedicated silver mine from exploration to production typically requires more than a decade, meaning new supply cannot be brought online quickly enough to resolve near-term deficits.
How Does Silver Demand From Solar Compare to Other Industries?
Solar photovoltaic manufacturing is currently the single largest industrial consumer of silver. Research projections suggest the solar sector could account for up to 41% of total global silver production by 2030, making it the dominant demand driver ahead of electronics, electric vehicles, and AI infrastructure.
Is Silver a Better Investment Than Gold Right Now?
Silver and gold serve different but complementary roles in a portfolio. Gold primarily functions as a monetary safe-haven asset, while silver combines safe-haven characteristics with significant industrial demand exposure. The gold-to-silver ratio climbed above 100 in early 2026, a level historically associated with silver being undervalued relative to gold, before subsequently compressing as industrial demand strengthened. Investors considering silver exposure should assess their own risk tolerance and consult qualified financial advice, as silver exhibits higher volatility than gold and is subject to both macroeconomic and industrial demand cycles.
Key Takeaways: The Silver Market in 2026 and Beyond
The structural case for continued silver supply deficit and rising prices rests on a convergence of factors that are unlikely to resolve quickly:
- Five-plus consecutive years of supply deficits have reduced above-ground inventory buffers to levels that amplify price sensitivity to demand changes
- Mine supply cannot respond quickly to price signals due to byproduct dependency and decade-long development timelines for new primary mines
- Industrial demand is accelerating structurally across solar, EVs, AI infrastructure, and electronics, sectors with policy-mandated growth trajectories across major economies
- Institutional price forecasts remain elevated, with J.P. Morgan projecting approximately $81 per ounce average for 2026 and research models suggesting supply could meet only 62% to 70% of demand by 2030
- Investment demand reinforces industrial pressure particularly during periods of macroeconomic uncertainty, creating compounding upward forces on price
- The gold-to-silver ratio has historically proven a reliable leading indicator of silver's relative value positioning, with readings above 100 often preceding significant silver outperformance
Silver's position at the intersection of clean energy infrastructure, advanced manufacturing, and digital technology creates a demand profile that is unlikely to weaken materially over the coming decade. The pace of net-zero transition commitments globally suggests consumption will remain elevated regardless of short-term economic fluctuations, while the supply side remains structurally constrained in ways that no price signal alone can quickly resolve.
This article is intended for informational purposes only and does not constitute financial advice. Commodity price forecasts involve significant uncertainty, and past performance is not indicative of future results. Readers should conduct their own research and consult qualified financial professionals before making investment decisions. For further coverage of energy transition metals and commodity market dynamics, visit CarbonCredits.com.
Want to Capitalise on the Next Major ASX Mineral Discovery Before the Broader Market?
Discovery Alert's proprietary Discovery IQ model delivers real-time alerts on significant ASX mineral discoveries — including silver and energy transition metals — turning complex data into actionable insights for both short-term traders and long-term investors. Explore Discovery Alert's discoveries page to understand how historic mineral discoveries have generated substantial returns, and begin your 14-day free trial today to position yourself ahead of the market.